Market Overview
| Study Period | 2021 - 2031 |
|---|---|
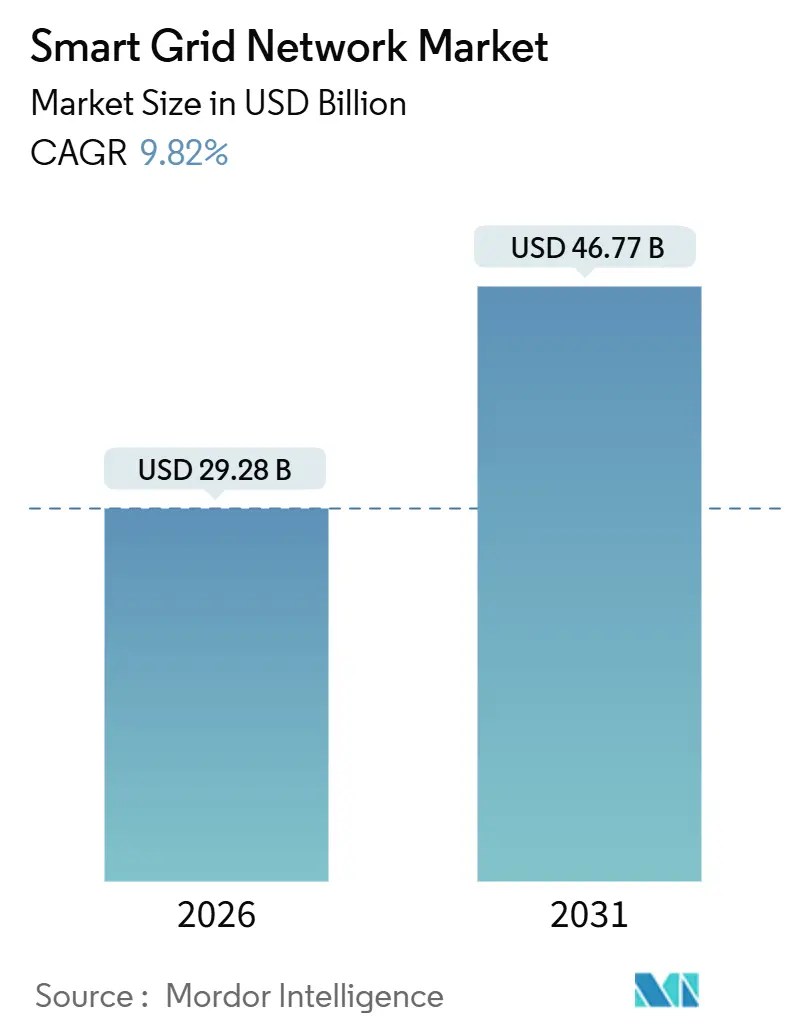
| Market Size (2026) | USD 29.28 Billion |
| Market Size (2031) | USD 46.77 Billion |
| Growth Rate (2026 - 2031) | 9.82% CAGR |
| Fastest Growing Market | Asia Pacific |
| Largest Market | North America |
| Market Concentration | Low |
Major Players *Disclaimer: Major Players sorted in no particular order Image © Mordor Intelligence. Reuse requires attribution under CC BY 4.0. | |
Smart Grid Network Market Analysis by Mordor Intelligence
The Smart Grid Network Market size is estimated at USD 29.28 billion in 2026, and is expected to reach USD 46.77 billion by 2031, at a CAGR of 9.82% during the forecast period (2026-2031).
Growing mandates for grid resilience, expanding distributed energy resources, and the spread of edge-computing architectures are converging to lift capital deployment. Hardware still delivered 60.8% of revenue in 2025, yet software is scaling faster at 13.5% each year as utilities pivot from asset replacement to algorithmic control. Distribution networks absorbed 48.0% of total spending, although consumption and prosumer investments are expanding at 12.6% as behind-the-meter systems multiply. North America retained 35.5% of the value, while Asia-Pacific recorded the fastest 14.8% annual rise, powered by large-scale provincial upgrades in China and feeder-separation mandates in India.[1]U.S. Department of Energy, “Grid Deployment Office Grant Allocations 2025,” energy.gov
Key Report Takeaways
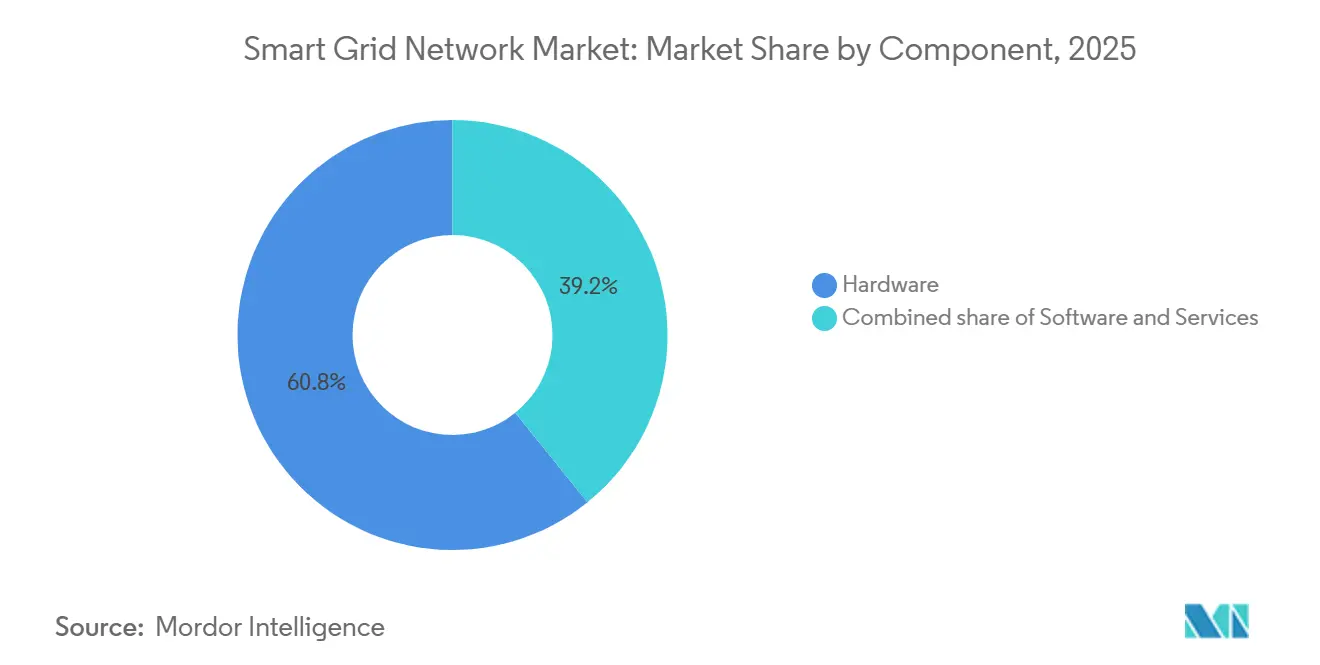
- By component, hardware captured 60.8% of the smart grid network market share in 2025, whereas software is advancing at a 13.5% CAGR through 2031.
- By grid stage, distribution networks held 48.0% of revenue in 2025, and the consumption/prosumer segment is forecast to expand at a 12.6% CAGR to 2031.
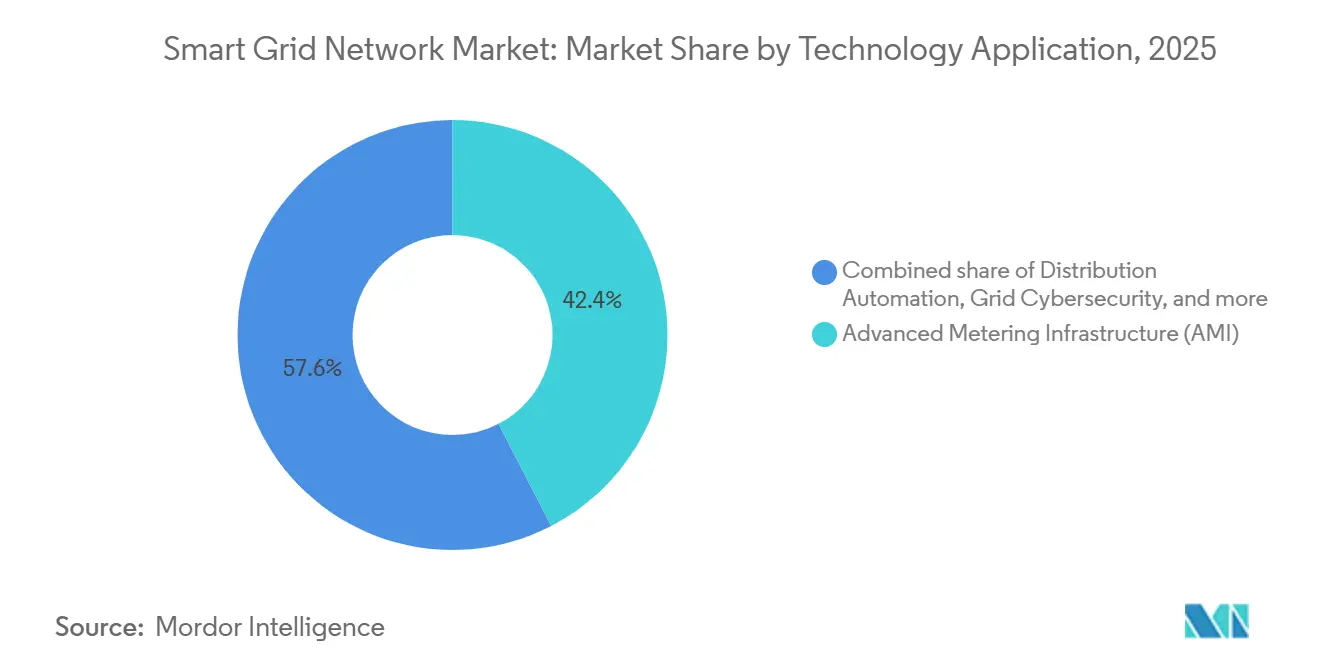
- By technology application, advanced metering infrastructure contributed 42.4% toward the smart grid network market size in 2025, while blockchain-enabled and AI-driven platforms are expected to grow at 14.3% annually.
- By communication technology, wired links commanded 55.1% of spending in 2025; wireless connections are climbing at a 13.1% CAGR on the back of 5G and low-power wide-area roll-outs.
- By end user, utilities and DSOs generated 59.7% of demand in 2025, yet industrial buyers are moving ahead at a 12.2% CAGR as they integrate microgrids and participate in demand response.
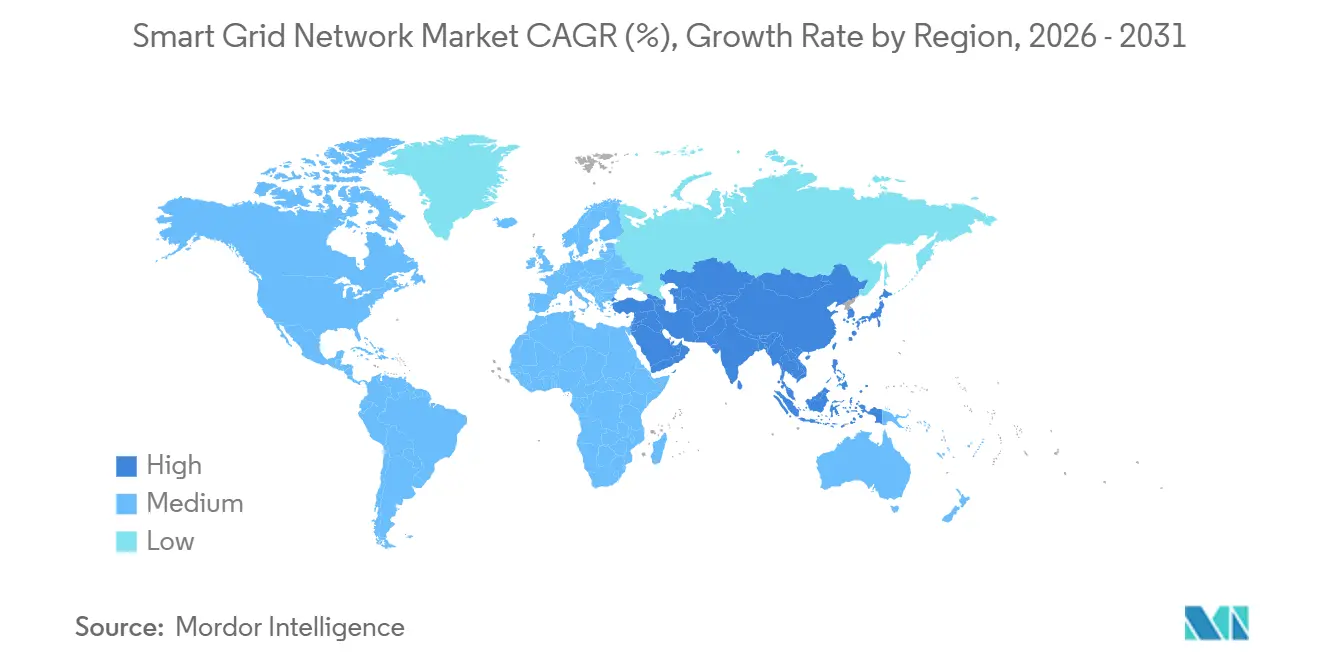
- By geography, North America generated 35.5% of global revenue in 2025, while Asia-Pacific is projected to grow at a 14.8% CAGR through 2031.
Note: Market size and forecast figures in this report are generated using Mordor Intelligence’s proprietary estimation framework, updated with the latest available data and insights as of January 2026.
Global Smart Grid Network Market Trends and Insights
Drivers Impact Analysis*
| Driver | (~) % Impact on CAGR Forecast | Geographic Relevance | Impact Timeline |
|---|---|---|---|
| Government-funded grid digitization mandates | +2.8% | Global, led by North America, EU, China | Medium term (2-4 years) |
| Rapid AMI roll-outs for demand-side management | +2.1% | North America and EU maturity, APAC acceleration | Short term (≤ 2 years) |
| Renewable and DER integration pressure | +1.9% | Global, acute in Germany, California, Australia | Long term (≥ 4 years) |
| AI-based predictive maintenance adoption | +1.4% | North America, Western Europe, Japan | Medium term (2-4 years) |
| 5G / LPWA connectivity enabling edge intelligence | +0.9% | APAC core, spill-over to MEA | Medium term (2-4 years) |
| Blockchain-enabled transactive energy platforms | +0.6% | Pilot clusters in U.S., EU, Australia | Long term (≥ 4 years) |
| Source: Mordor Intelligence | |||


Government-Funded Grid Digitization Mandates Drive Capital Deployment
Multi-year infrastructure packages are giving utilities funding certainty that lowers financing risk. In 2025, the U.S. Infrastructure Investment and Jobs Act reserved USD 3 billion for smart-grid demonstrations, and the REPowerEU framework earmarked EUR 29 billion for digital substations and cross-border interconnections.[2]U.S. Congress, “Infrastructure Investment and Jobs Act,” congress.gov China’s 14th Five-Year Plan requires 95% smart-meter penetration by 2026, moving procurement toward advanced metering and distribution automation. With regulators now demanding interoperability and cybersecurity compliance before rate approval, utilities are shifting spending from reactive maintenance to proactive optimization.
Rapid AMI Roll-Outs Enable Granular Demand-Side Management
North American utilities had installed more than 120 million smart meters by early 2025, reaching roughly 75% household penetration, while Europe achieved 58% coverage. Interval data empowers time-of-use tariffs that trim peak demand by up to 12%, and AMI feeds machine-learning models that detect transformer degradation six months in advance. Integrating AMI data with customer portals increases energy-efficiency program uptake, yet privacy concerns over granular household consumption continue to attract regulatory attention.
Renewable and DER Integration Pressure Strains Legacy Architectures
Behind-the-meter solar, batteries, and electric-vehicle chargers are reversing power flows. California recorded distributed solar exceeding midday demand on 112 days in 2025, while Germany surpassed 1.2 million DER connections. Utilities are installing distributed energy resource management systems, but protocol incompatibilities between inverters and utility controls slow progress. Demonstrations in South Australia showed aggregated residential batteries can supply 50 MW of regulation capacity, yet standardized APIs are needed to scale.
AI-Based Predictive Maintenance Reduces Outages and Costs
Embedding machine learning inside SCADA uncovers early equipment stress. GE’s analytics lowered transformer outages by 18%, saving each participating utility USD 4.2 million annually. Siemens reported that AI-driven monitoring extended breaker life by seven years in 23% of inspected units. The North American Electric Reliability Corporation logged a 14% decline in forced outages among adopters. Success, however, depends on high-quality sensor data and talent fluent in both power engineering and data science.
Restraints Impact Analysis*
| Restraint | (~) % Impact on CAGR Forecast | Geographic Relevance | Impact Timeline |
|---|---|---|---|
| High capex requirements | -1.2% | Global, acute in emerging markets | Short term (≤ 2 years) |
| Protocol and system interoperability gaps | -0.9% | North America, Europe, fragmented APAC | Medium term (2-4 years) |
| Shortage of cyber-physical talent | -0.7% | North America, Western Europe, Japan | Long term (≥ 4 years) |
| Geopolitical supply-chain restrictions | -0.5% | U.S.-China trade friction, EU-Russia split | Medium term (2-4 years) |
| Source: Mordor Intelligence | |||
High Capex Requirements Constrain Deployment Pace
Smart-grid roll-outs require large upfront spending that utilities must recover through rate cases or alternative financing. A 2025 NARUC review showed smart-grid costs averaged USD 180 per customer with payback periods longer than 10 years where performance-based ratemaking is absent. Emerging-market utilities face even tougher hurdles, relying on blended finance from the World Bank and regional banks to de-risk projects.
Protocol and System Interoperability Gaps Inflate Costs
Legacy SCADA, proprietary field protocols, and new IoT standards often fail to interoperate, forcing custom middleware. The IEC’s 2025 operator survey ranked interoperability as a top-three barrier for 68% of respondents. Utilities that adopt open standards early lower the total cost of ownership, while those locked into proprietary ecosystems struggle to diversify vendors and integrate new technologies.
*Our forecasts treat driver/restraint impacts as directional, not additive. The impact forecasts reflect baseline growth, mix effects, and variable interactions.
Segment Analysis
By Component: Software Growth Outpaces Hardware
Hardware represented 60.8% of smart grid network market revenue in 2025, but software is expanding at a 13.5% CAGR through 2031 as utilities re-allocate budgets toward analytics, cybersecurity, and orchestration platforms. Services provide the residual, growing in line with the overall market size. Hardware demand remains strong in Asia-Pacific and the Middle East, where electromechanical meters are being replaced, yet marginal returns from new sensors are falling in mature North American installations.
Software momentum stems from the adoption of advanced distribution management systems, distributed energy resource management suites, and customer information platforms. Schneider Electric booked a 19% year-over-year increase in software licenses in 2025.[3]Schneider Electric, “Annual Report 2025,” se.com Oracle’s cloud migrations trimmed IT costs for utilities by 30% on average. Heightened cyber threats are also steering 8-12% of IT budgets into intrusion detection and compliance monitoring. In parallel, system integrators and managed-service providers are expanding recurring revenue as utilities outsource grid-edge device management.


By Grid Stage: Consumption and Prosumer Segments Accelerate
Distribution networks controlled 48.0% of the smart grid network market revenue in 2025, anchored by feeder automation and fault detection. Consumption and prosumer outlays, however, are forecast to rise at a 12.6% CAGR, the fastest among grid stages. Generation and transmission draw the remainder, with selective upgrades for renewables integration.
Behind-the-meter resources are reshaping value flows. California’s incentive scheme added 1.8 GWh of residential battery capacity in 2025. Germany’s prosumer base expanded by 14% the same year. Virtual power plants in Australia are targeting 13 GW of dispatchable capacity by 2030. Transmission investment is more surgical, typified by USD 18 billion of projects in Texas to link renewable zones to load centers.
By Technology Application: Emerging Platforms Gain Share
Advanced metering infrastructure contributed 42.4% to the smart grid network market size in 2025, yet emerging areas such as blockchain-enabled trading, AI-driven fault prediction, and vehicle-to-grid aggregation are growing at 14.3% annually. Distribution automation ranks second, followed by grid cybersecurity and analytics.
Utilities in North America and Europe have finished mass meter deployment and are now monetizing data. Itron’s recurring software revenue grew 11% in 2025.[4]Itron, “Annual Report 2025,” itron.com Eaton’s distribution automation sales advanced 9% on Asia-Pacific demand. Cybersecurity spending continues to climb as regulators enforce stricter standards under NIS2 and updated NERC CIP rules. Pilots in California and Germany are proving blockchain transaction settlement, though clear market rules remain pending.
By Communication Technology: Wireless Gains Ground
Wired technologies, chiefly fiber and power-line carrier, held 55.1% of spending in 2025, but wireless connections are expanding at a 13.1% CAGR as 5G and LPWA reduce edge connectivity costs. Hybrid architectures that blend wired backhaul with wireless last-mile links are becoming the default.
Cisco counted double-digit growth in cellular IoT modules for utilities, and Japan’s 5G tests logged sub-10-millisecond response times supporting protection schemes. Low-power wide-area networks provide multi-year battery life for leak detection and environmental monitoring. Utilities are selecting hybrid configurations to balance bandwidth, reliability, and cost, especially where rural feeders stretch hundreds of kilometers.
By End User: Industrial Buyers Scale Faster
Utilities and DSOs accounted for 59.7% of demand in 2025, but industrial customers are set to advance at a 12.2% CAGR. Residential and commercial segments post intermediate growth tied to rooftop solar, building automation, and vehicle charging.
Manufacturers and data centers are installing microgrids to shave peak charges and win ancillary-service revenue. A North American auto plant cut demand charges by 18% through real-time load shifting in 2025. Hyperscale data centers reduced electricity costs by up to 9% using grid-interactive cooling controls. Utilities remain vital buyers because they shoulder reliability obligations, yet industrial momentum is diversifying the revenue base for vendors.

Geography Analysis
North America generated 35.5% of smart grid network market revenue in 2025, supported by mature meter penetration and USD 10.5 billion of federal grants and loans targeting modernization. Asia-Pacific is advancing at a 14.8% CAGR, reflecting China’s 500 million-plus meter base and India’s feeder-level automation program. Europe holds a robust position under the Green Deal, with Germany alone integrating over 1.2 million behind-the-meter assets.
North American utilities are focusing on distribution automation to weatherproof networks; Ontario cut outage duration by 16% after automated recloser deployment. Asia-Pacific spending spans advanced distribution management, feeder automation, and communication infrastructure upgrades. Japan and South Korea emphasize resilience against typhoons and seismic risk, deploying battery storage and demand response.
In Europe, cross-border interconnectors and flexibility markets are maturing. Nordic operators link district heating and power trading, while the United Kingdom is testing location-based flexibility auctions. South America is prioritizing loss reduction through metering in Brazil and transmission automation in Chile, whereas Saudi Arabia and the United Arab Emirates anchor early deployments in the Middle East.

Competitive Landscape
The smart grid network market shows moderate concentration: the top 10 vendors captured near 45% of the 2025 global revenue. Multinationals such as ABB, Siemens, GE, and Schneider Electric leverage integrated portfolios, whereas Oracle, IBM, and Cisco lead in analytics and cybersecurity platforms. Itron and Landis+Gyr dominate advanced metering infrastructure through installed-base stickiness. Asian suppliers, including Huawei and Hitachi, compete via bundled communication and automation solutions at aggressive price points.
Competitive dynamics are shifting toward platform ecosystems and recurring revenue. Utilities increasingly favor software subscriptions and managed services that wrap analytics, cybersecurity, and field-device management into performance-based contracts. Partnerships between utilities and hyperscale cloud providers are proliferating to deploy grid analytics at scale.
Strategic activity in 2025 included ABB’s USD 2.1 billion purchase of a 60% share in Hitachi Energy’s grid automation arm, Schneider Electric’s USD 450 million software campus expansion, and Siemens’ joint venture for Chinese production of intelligent devices. Vendors also added AI and cybersecurity talent through acquisitions as the market rewards differentiated software capabilities.
Smart Grid Network Industry Leaders
ABB Ltd
Schneider Electric SE
Siemens AG
General Electric Company
Itron Inc.
- *Disclaimer: Major Players sorted in no particular order

Recent Industry Developments
- December 2025: Schneider Electric committed USD 450 million for a grid-software development center in Bangalore to advance distribution management and DER orchestration.
- March 2025: Itron and CHINT Global released the first residential meter compliant with the DLMS Generic Companion Profile, boosting interoperability for utilities planning multi-vendor projects.
- February 2025: Germany amended its Energy Industry Law, mandating smart metering for consumers using more than 6,000 kWh annually and capping metering service charges to accelerate adoption.
- January 2025: NV Energy installed LineVision dynamic line-rating sensors that maximize existing transmission capacity and improve grid reliability.


Global Smart Grid Network Market Report Scope
The global smart grid network market is dedicated to revolutionizing traditional electricity grids. By harnessing advanced digital technologies, these grids now facilitate two-way communication, real-time monitoring, and intelligent control over power generation, transmission, distribution, and consumption. Integrating components like advanced metering infrastructure (AMI), sensors, communication networks, data analytics, automation systems, and grid management software, smart grid networks enhance the efficiency, reliability, and resilience of power systems.
The global smart grid network market is segmented by component, grid stage, technology application, communication technology, end-user, and geography. By component, the market is segmented by hardware, software, and services. By grid stage, the market is divided into generation, transmission, and others. By technology application, the market is segmented into AMI, distribution automation, transmission upgrades, and others. By communication technology, the market is segmented into wired, wireless, and hybrid. By end-user, the market is segmented into residential, commercial, industrial, and utilities. The report also covers the market size and forecasts for the subsea systems market across major regions. Market sizing and forecasts have been done for each segment based on revenue (USD billion).
By Component
| Hardware |
| Software |
| Services |
By Grid Stage
| Generation |
| Transmission |
| Distribution |
| Consumption/Prosumer |
By Technology Application Area
| Advanced Metering Infrastructure (AMI) |
| Distribution Automation |
| Transmission Upgrades and FACTS |
| Demand Response |
| Grid Cybersecurity |
| Grid Analytics and Software |
| Other Emerging Areas |
By Communication Technology
| Wired (Fiber, PLC) |
| Wireless (RF Mesh, Cellular IoT, 5G, LPWA) |
| Hybrid Architectures |
By End User
| Residential |
| Commercial |
| Industrial |
| Utilities and DSOs |
By Geography
| North America | United States |
| Canada | |
| Mexico | |
| Europe | Germany |
| France | |
| United Kingdom | |
| Spain | |
| Italy | |
| NORDIC Countries | |
| Russia | |
| Rest of Europe | |
| Asia-Pacific | China |
| Japan | |
| India | |
| South Korea | |
| ASEAN Countries | |
| Australia and New Zealand | |
| Rest of Asia-Pacific | |
| South America | Brazil |
| Argentina | |
| Colombia | |
| Rest of South America | |
| Middle East and Africa | Saudi Arabia |
| United Arab Emirates | |
| South Africa | |
| Egypt | |
| Rest of Middle East and Africa |
| By Component | Hardware | |
| Software | ||
| Services | ||
| By Grid Stage | Generation | |
| Transmission | ||
| Distribution | ||
| Consumption/Prosumer | ||
| By Technology Application Area | Advanced Metering Infrastructure (AMI) | |
| Distribution Automation | ||
| Transmission Upgrades and FACTS | ||
| Demand Response | ||
| Grid Cybersecurity | ||
| Grid Analytics and Software | ||
| Other Emerging Areas | ||
| By Communication Technology | Wired (Fiber, PLC) | |
| Wireless (RF Mesh, Cellular IoT, 5G, LPWA) | ||
| Hybrid Architectures | ||
| By End User | Residential | |
| Commercial | ||
| Industrial | ||
| Utilities and DSOs | ||
| By Geography | North America | United States |
| Canada | ||
| Mexico | ||
| Europe | Germany | |
| France | ||
| United Kingdom | ||
| Spain | ||
| Italy | ||
| NORDIC Countries | ||
| Russia | ||
| Rest of Europe | ||
| Asia-Pacific | China | |
| Japan | ||
| India | ||
| South Korea | ||
| ASEAN Countries | ||
| Australia and New Zealand | ||
| Rest of Asia-Pacific | ||
| South America | Brazil | |
| Argentina | ||
| Colombia | ||
| Rest of South America | ||
| Middle East and Africa | Saudi Arabia | |
| United Arab Emirates | ||
| South Africa | ||
| Egypt | ||
| Rest of Middle East and Africa | ||


Key Questions Answered in the Report
How large is the smart grid network market in 2026?
The market stands at USD 29.28 billion in 2026 and is projected to reach USD 46.77 billion by 2031.
Which segment is growing fastest by grid stage?
Spending tied to consumption and prosumer assets is rising at a 12.6% CAGR as rooftop solar, batteries, and EV chargers scale.
What drives rapid wireless adoption in utility grids?
Cheaper 5G, NB-IoT, and LPWA modules cut last-mile connectivity costs and deliver sub-10-millisecond latency for protection schemes.
Why are industrial customers investing in smart-grid solutions?
Manufacturers and data centers use microgrids and demand response to lower peak charges and earn ancillary-service revenue, pushing 12.2% annual growth.
How are utilities addressing cybersecurity risk?
Spending on intrusion detection, network segmentation, and compliance monitoring now claims 8-12% of IT budgets as NIS2 and NERC CIP standards tighten.
Which regions provide the strongest growth outlook?
Asia-Pacific leads with a 14.8% CAGR thanks to large meter upgrades in China and policy-driven automation in India and Southeast Asia.
Page last updated on:


