Market Overview
| Study Period | 2021 - 2031 |
|---|---|
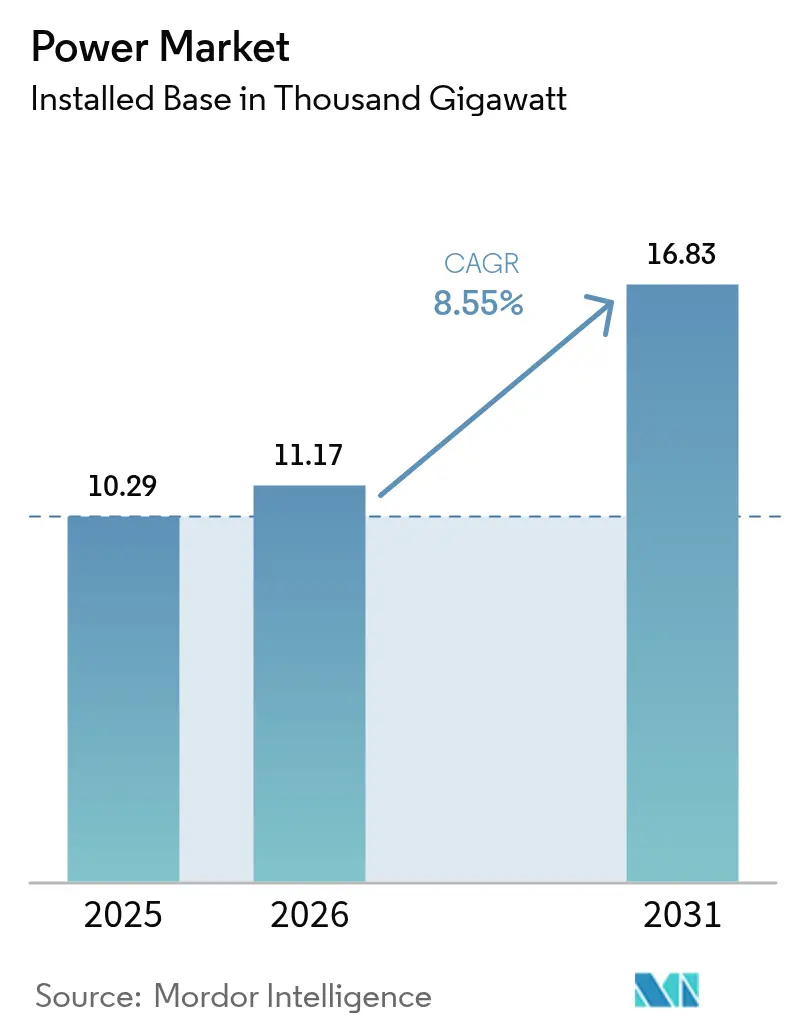
| Market Volume (2026) | 11.17 Thousand gigawatt |
| Market Volume (2031) | 16.83 Thousand gigawatt |
| Growth Rate (2026 - 2031) | 8.55% CAGR |
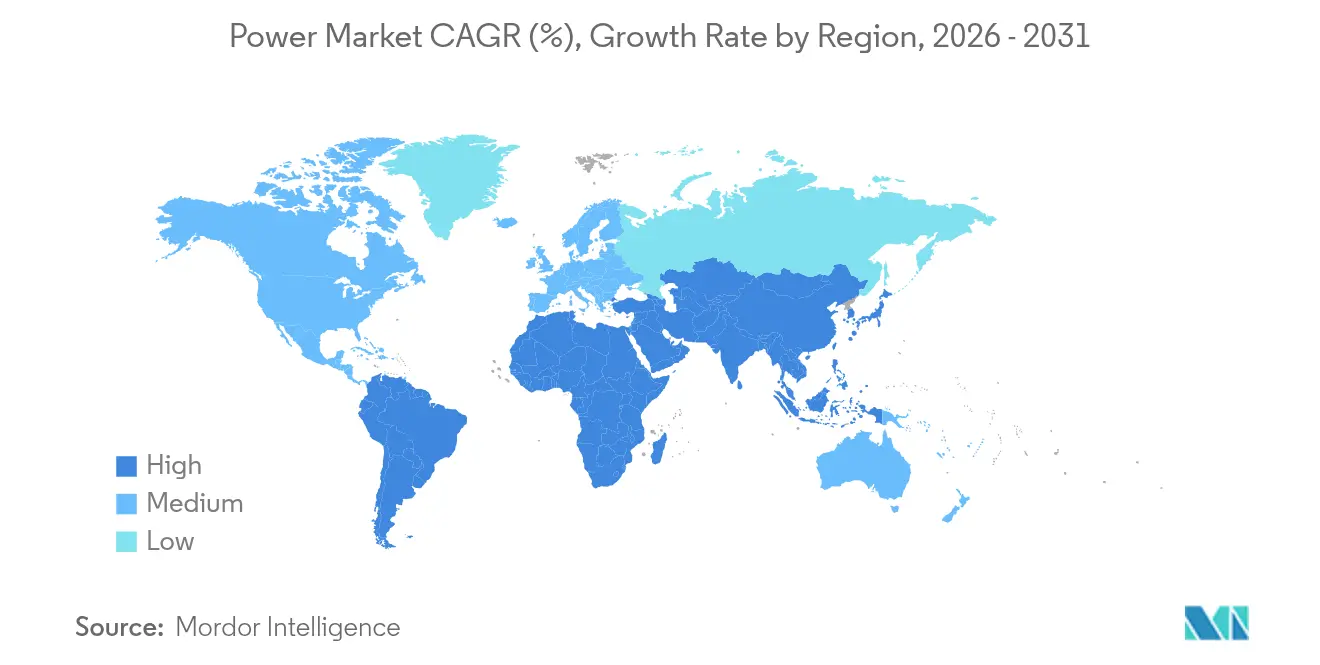
| Fastest Growing Market | South America |
| Largest Market | Asia Pacific |
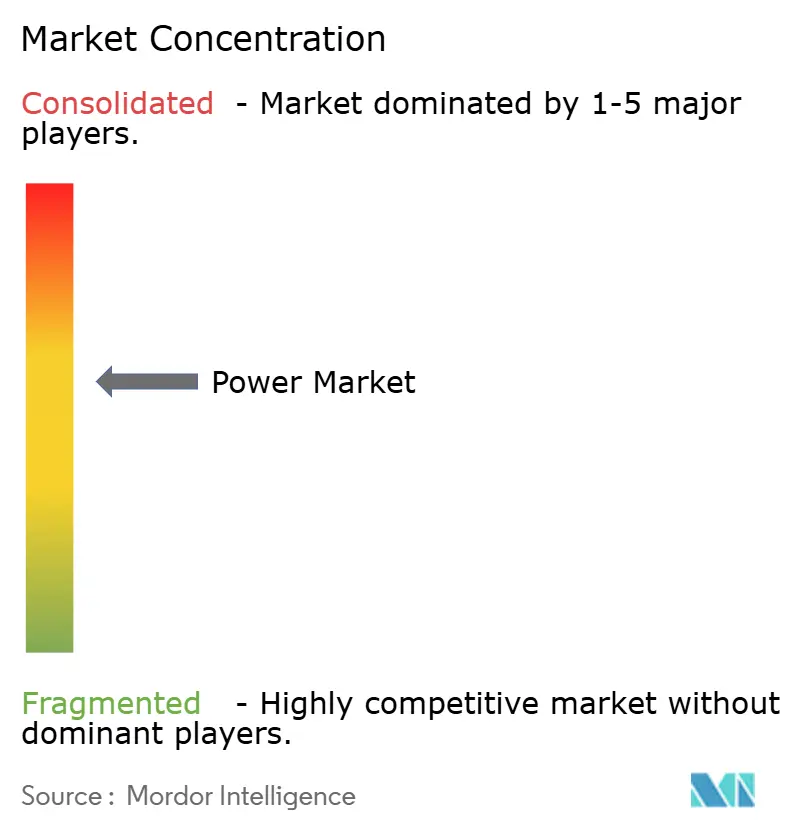
| Market Concentration | Medium |
Major Players *Disclaimer: Major Players sorted in no particular order Image © Mordor Intelligence. Reuse requires attribution under CC BY 4.0. | |
Power Market Analysis by Mordor Intelligence
The Power Market size was valued at 10.29 Thousand gigawatt in 2025 and estimated to grow from 11.17 Thousand gigawatt in 2026 to reach 16.83 Thousand gigawatt by 2031, at a CAGR of 8.55% during the forecast period (2026-2031).
Capacity growth stems from spiraling electricity demand created by data-center build-outs, industrial electrification, and early green-hydrogen uptake. Renewables account for nearly half of all new capacity and benefit from steep battery-storage cost declines that unlock multi-hour grid flexibility. Sovereign wealth and pension funds continue to channel USD 180 billion each year into high-voltage grid upgrades, tightening competition in the transmission segment. At the same time, grid bottlenecks and slow permitting threaten to stall 23% of approved clean-energy projects, exposing a mismatch between generation ambitions and infrastructure readiness.
Key Report Takeaways
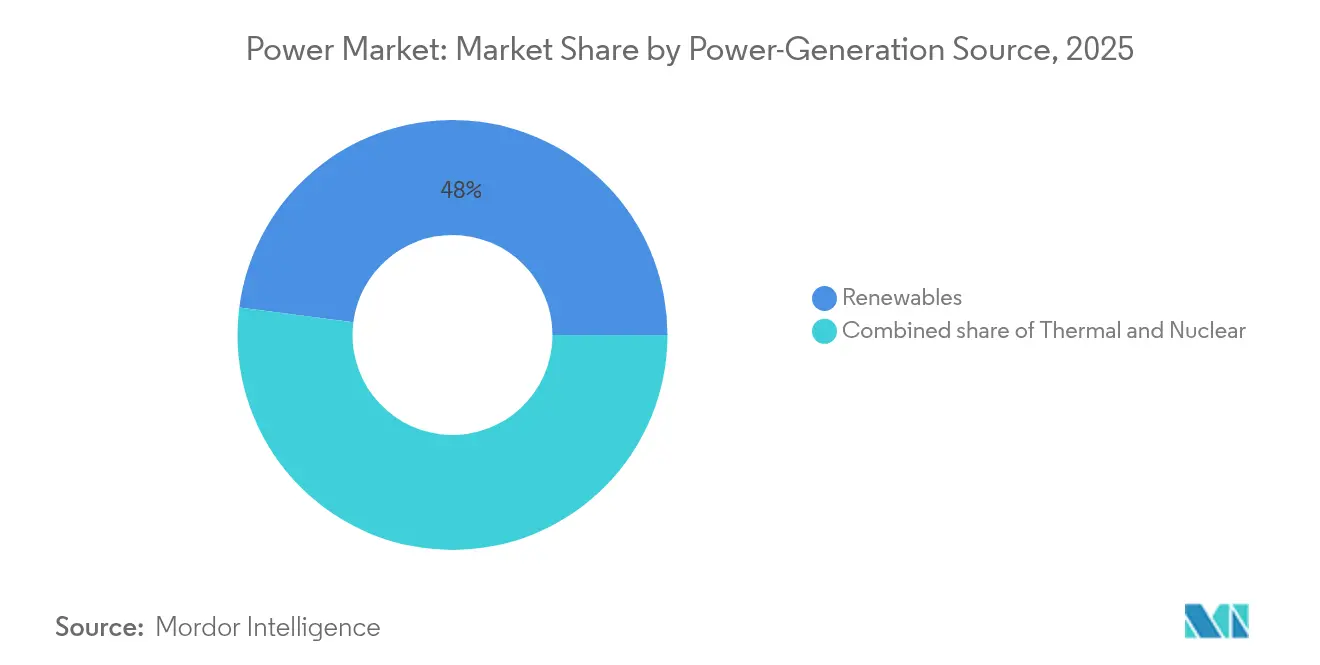
- By power-generation source, renewables held 47.95% revenue share in 2025, while offshore wind is projected to expand at a 23.10% CAGR through 2031.
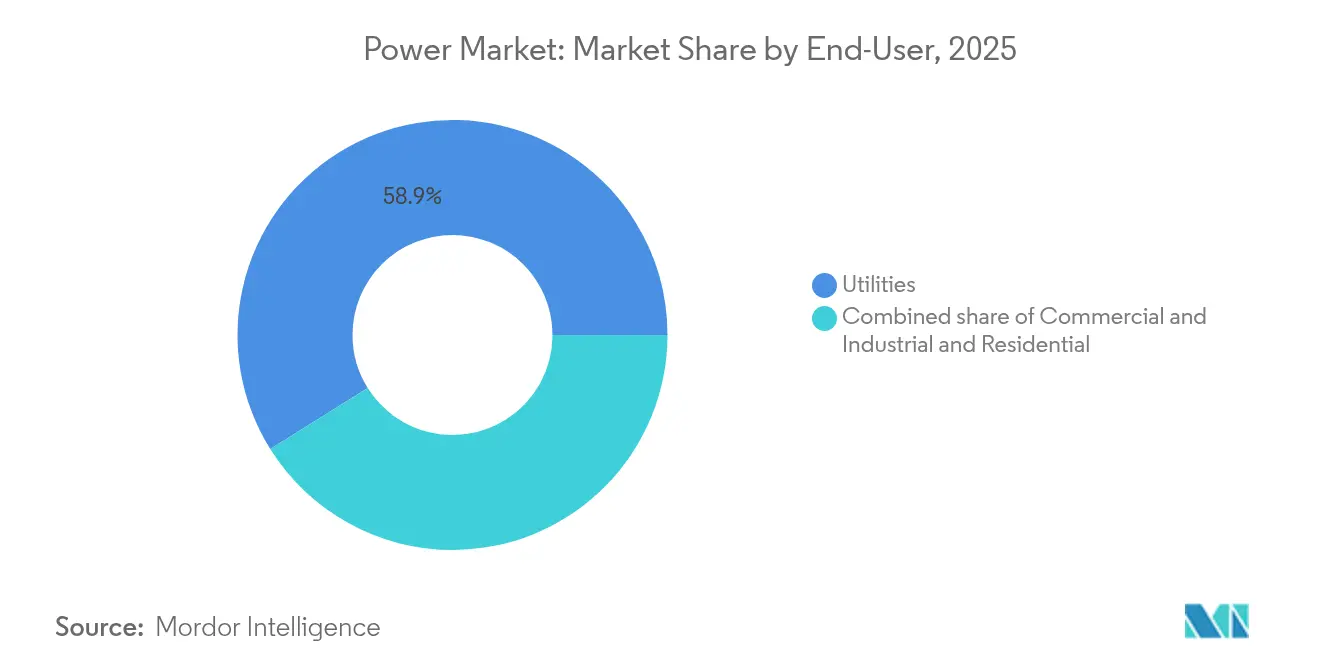
- By end-user, utilities held 58.90% of the global power market share in 2025, while residential demand is forecast to grow at a 12.35% CAGR through 2031.
- By geography, Asia-Pacific commanded a 44.20% share of the global power market size in 2025, and South America is advancing at a 15.10% CAGR through 2031.
Note: Market size and forecast figures in this report are generated using Mordor Intelligence’s proprietary estimation framework, updated with the latest available data and insights as of 2026.
Global Power Market Trends and Insights
Drivers Impact Analysis*
| Driver | (~) % Impact on CAGR Forecast | Geographic Relevance | Impact Timeline |
|---|---|---|---|
| Explosive data-center electricity demand | +2.1% | Global, concentrated in North America & APAC | Short term (≤ 2 years) |
| Electrification of industrial heat & transport | +1.8% | Europe & North America leading, APAC following | Medium term (2-4 years) |
| Government clean-energy subsidy waves | +1.5% | North America, Europe, China | Medium term (2-4 years) |
| Rapid cost decline in utility-scale storage | +1.2% | Global, fastest adoption in APAC & Australia | Short term (≤ 2 years) |
| Cross-border HVDC super-grid build-outs | +0.9% | Europe, North America, select APAC corridors | Long term (≥ 4 years) |
| Green-hydrogen electrolyzer build-outs | +0.7% | Europe, Middle East, Australia, Chile | Long term (≥ 4 years) |
| Source: Mordor Intelligence | |||


Explosive Data-Center Electricity Demand Surge
Data centers consumed 460 TWh in 2024, equaling Argentina’s entire annual load and representing 2% of world electricity.[1]International Energy Agency, “Electricity Usage in Data Centres,” iea.org Average hyperscale campuses now draw 100-200 MW of continuous power, forcing utilities to renegotiate interconnection rules and fast-track substation upgrades. Corporate buyers contracted 23.7 GW of clean energy in 2024 as tech giants sidestepped traditional utility supply models to secure 24/7 renewables. Virginia’s “data-center alley” already absorbs 25% of statewide generation, prompting regulators to revise capacity-market participation rules [PJM.com]. These concentrated loads heighten voltage-stability risk and drive premium capacity-contract pricing that flows through to retail tariffs. The global power market is therefore recalibrating around localized baseload spikes that were uncommon a decade ago.
Electrification of Industrial Heat & Transport
Electric arc furnaces captured 73% of new steel capacity in 2024, and heat pumps displaced natural gas in 40% of European industrial heating retrofits. On the mobility side, 14.1 million EVs added 85 TWh of net demand yet supplied 280 GWh of vehicle-to-grid storage that helped shave evening peaks. Nordic grids illustrate the convergence: synchronized EV charging and industrial heat-pump cycles create time-bundled consumption spikes that are balanced through granular tariff signals and AI-based dispatch. Aluminum smelters and chemical complexes are already relocating to wind-rich zones to capture cheap, firmed renewable power, locking in 15-20-year offtakes that underpin local transmission expansion. As similar patterns echo worldwide, the global power market anticipates sustained 15-20% rises in industrial consumption that call for USD 45 billion of annual distribution hardening.
Government Clean-Energy Subsidy Waves
The United States dedicated USD 369 billion to clean energy incentives under the Inflation Reduction Act, catalyzing 272 GW of fresh project announcements in 2024. Europe’s REPowerEU funneled EUR 300 billion into accelerated renewables and grid reinforcement, while China targeted 1,200 GW of new green capacity by 2030 with USD 440 billion of preferential lending. Subsidy-driven demand spikes lifted U.S. solar installs by 75% in 2024, yet negative-price hours dominated 67% of European day-ahead trades, exposing market-design flaws. The geographic clustering of incentives has also redrawn manufacturing maps, leaving 85% of global photovoltaic module output inside countries that underwrite local factories. Such policy asymmetries shape the next growth leg for the global power market by steering capital toward subsidy-rich technologies and regions.
Rapid Cost Decline in Utility-Scale Battery Storage
Battery pack costs fell 89% since 2010, hitting USD 132/kWh in 2024 and rendering 4-hour systems cheaper than gas peakers in 23 U.S. states. Annual installations soared to 42 GW, led by 22 GW in China and 9.4 GW in the U.S., and enabled traders to capture USD 180/MWh spreads between solar-noon oversupply and evening ramps. Commodity risk, however, escalated as lithium prices swung 340% during the year, widening project IRR bands and spurring interest in sodium-ion and iron-air chemistries. Meanwhile, duration mandates are lengthening; California alone requires 11.5 GW of multi-day storage by 2026 to weather prolonged renewable lulls. These cost and policy vectors jointly amplify storage’s influence on the global power market, tilting new-build economics decisively toward clean technologies.
Restraints Impact Analysis*
| Restraint | (~) % Impact on CAGR Forecast | Geographic Relevance | Impact Timeline |
|---|---|---|---|
| Grid bottlenecks & permitting delays | -1.40% | Global, acute in Europe & North America | Short term (≤ 2 years) |
| Critical-mineral supply-chain volatility | -1.10% | Global, supply concentrated in few countries | Medium term (2-4 years) |
| Rising renewable curtailment in saturated grids | -0.80% | Europe, California, select APAC markets | Short term (≤ 2 years) |
| Climate-induced hydropower variability | -0.60% | Global, severe in drought-prone regions | Long term (≥ 4 years) |
| Source: Mordor Intelligence | |||
Grid Bottlenecks & Permitting Delays
Transmission constraints sidelined 127 GW of shovel-ready renewables in 2024, translating into a USD 340 billion investment backlog. U.S. interconnection queues ballooned to 2,600 GW, five times the present grid capacity, with average study cycles extending 5.2 years.[2]Federal Energy Regulatory Commission, “Interconnection Queue Assessment 2025,” ferc.gov European cross-border lines ran at 95% utilization during windy hours, forcing 47 TWh of curtailment, particularly in Spain and Germany. Policymakers reacted by capping review periods to 12 months for pre-zoned projects under the EU Net-Zero Industry Act, yet community opposition still delays one in four HVDC builds. If unaddressed, these chokepoints could undercut the global power market’s decarbonization pathway by deferring capital and eroding investor confidence.
Critical-Mineral Supply-Chain Volatility
Lithium carbonate prices fluctuated between USD 17,000 and USD 58,000 per ton in 2024, destabilizing battery bid economics and prompting project hedging strategies. China controls 87% of rare-earth processing, leaving wind-turbine OEMs exposed to geopolitical risk. Copper deficits could reach 6.5 million tons yearly by 2030, given 16-year average mine lead times. Resource-rich democracies, including Australia and Canada, pledged USD 28 billion to expand refining, but environmental permitting has already stalled 34% of proposed lithium mines by more than two years. Supply-chain fragility, therefore, tempers the momentum of the global power market, raising cost uncertainty across batteries, wind, and grid conductors.
*Our forecasts treat driver/restraint impacts as directional, not additive. The impact forecasts reflect baseline growth, mix effects, and variable interactions.
Segment Analysis
By Power-Generation Source: Renewables Drive Capacity Expansion
Renewables commanded 47.95% of 2025 installed capacity and are scaling at 13.70% CAGR through 2031, underpinned by a record 346 GW of new solar and 116 GW of wind commissioned during the year. Solar photovoltaics, cheaper than marginal gas in most regions, dominate daytime supply and compress peak-price spreads. Wind plays the complementary role during evening hours, though integration challenges rise as variable output surpasses 30% of national mixes in 15 countries. Offshore wind, growing at a 23.10% CAGR, captures deep-water sites through floating foundations, accelerating uptake in Japan, South Korea, and California. Simultaneously, nuclear restarts and small modular reactor pilots add a nascent but strategic avenue for firm, low-carbon generation that can anchor industrial heat contracts. Coal and oil plants continue to retire or retrofit; 47 GW of coal capacity announced hydrogen co-firing conversions in 2024, though commercial viability remains tied to carbon prices above USD 80 per ton.
High renewable penetration tilts planning toward flexibility assets. Grid operators worldwide will require USD 2.8 trillion in cumulative investment for batteries, pumped-hydro, demand response, and expanded interconnectors over 2026-2031. Battery storage integration softens solar midday oversupply, while cross-border HVDC links move surplus wind to load centers. As these levers scale, the global power market embeds resilience through diversified resource stacks rather than single-fuel dominance. The renewables boom, therefore, redefines capital allocation, regulatory frameworks, and merchant-price formation across global electricity systems.


By End-User: Utilities Dominance Meets Residential Growth
Utilities retained 58.90% of 2025 demand and act as gatekeepers of transmission and wholesale trade. Yet the residential segment is growing at 12.35% CAGR as heat pumps, EV chargers, and rooftop solar proliferate across advanced economies. Behind-the-meter generation hit 180 GW in 2024, and virtual power-plant aggregators are stitching these resources into dispatchable clusters that bid into real-time markets. Corporate buyers, chiefly data-center and heavy-industry operators, inked 23.7 GW of renewable PPAs during the year, bypassing utilities for direct access to power plants. This shift squeezes utility revenue from traditional volumetric sales but unlocks new earnings streams in grid services, storage orchestration, and dynamic tariffs.
Regulators evolve in response, trimming net-metering credits and adding grid-access charges to reflect distribution upkeep. Utilities answer with demand-response programs and distributed energy resource management systems that monetize prosumer flexibility. Meanwhile, industrial mega-loads such as electrolyzers and electric arc furnaces cluster near renewable hubs, demanding bespoke interconnections and long-term capacity reservations. As a result, the global power market pivots from one-directional supply chains toward bidirectional flows where every customer can simultaneously consume, store, and produce electricity. This fluid landscape forces incumbents to refine pricing, expand digital capabilities, and adopt platform business models.
Geography Analysis
Asia-Pacific led the global power market with 44.20% capacity share in 2025, anchored by China’s 1,411 GW fleet and India’s 425 GW. China commissioned 216 GW of new renewables during the year, more than Germany’s installed base, yet also added 47 GW of coal to safeguard grid inertia. India, by contrast, balances solar ambition with regional battery tenders that target 50 GWh of storage by 2026. Japan and South Korea lean on offshore wind and advanced nuclear to curb imported-fuel dependence; Japan intends to reach 45 GW of offshore turbines by 2040, while South Korea experiments with 12 GW of floating solar. The region’s integration strain remains high, with renewable curtailment surpassing 8.2% in northwest China due to limited transmission, underscoring the urgency of interprovincial HVDC lines.
South America emerged as the fastest-expanding slice of the global power market at 15.10% CAGR, propelled by green-hydrogen hubs in Chile and lithium-driven grid storage demand in Argentina and Brazil. Brazil boasts 195 GW of installed capacity, leveraging low-cost wind and hydro to decarbonize mining and agriculture. Chile’s Atacama solar boom supplies both mining loads and hydrogen export terminals, achieving sub-USD 30/MWh levelized costs. Beyond renewables, Argentina’s Vaca Muerta shale gas underpins firm capacity additions that stabilize an increasingly variable generation fleet. Cross-border interconnectors, including the Andes-Pacific HVDC, unlock regional trade that optimizes hydropower between wet and dry seasons.
Europe sustained 22.80% of global capacity in 2025, concentrating on flexibility and energy-security upgrades after the 2022 gas crisis. Germany installed 17 GW of renewables while leaning on Nordic hydro and French nuclear imports to balance frequency. The United Kingdom added 3.2 GW of offshore wind, cementing its leadership in floating foundations. Yet mature grids confront rising saturation; negative-price hours proliferate, storage economics improve, and wholesale markets scramble to reconfigure settlement periods to five minutes. North America and the Middle East & Africa lag in share but represent promising growth. The United States installed 32 GW of renewables in 2024, buoyed by IRA tax credits, and the UAE put 5.6 GW of solar into its 2071 net-zero roadmap. Regional diversification, therefore, buffers the global power market against policy or resource shocks in any single geography.

Competitive Landscape
Generation ownership remains fragmented even as transmission consolidates. State-owned enterprises control 65% of grid infrastructure, whereas private developers hold the bulk of renewable pipelines. The top-10 solar EPCs managed only 23% of 2024 deployments, signaling low concentration in generation. Conversely, HVDC equipment is oligopolistic: the three biggest vendors shipped 67% of converter stations last year. Utilities such as Enel and NextEra continue shedding coal and gas fleets to emphasize renewables, storage, and digital grid platforms, indicating strategic pivots from asset heaviness toward service orientation.
Technology convergence intensifies rivalry. Battery-augmented renewable developers now compete head-to-head with thermal generators in capacity markets. Virtual power plant operators aggregate rooftop PV, EV chargers, and smart appliances, commanding multi-GW portfolios that rival mid-size utilities. Patent filings in grid-scale storage jumped 340% in 2024, with Chinese firms dominating new chemistries and European companies excelling in power electronics.[3]World Intellectual Property Organization, “Global Patents in Energy Storage 2025,” wipo.int Strategic alliances multiply: Google pairs with Nevada utilities on AI-optimized demand response that clips peak load by 15%. As profit pools migrate from pure energy sales to bundled solutions, the global power market rewards firms that integrate generation, flexibility, and software under a single customer interface.
Capital structure also shifts. Sovereign funds and pension investors favor regulated-asset-based returns in transmission, acquiring stakes in backbone lines from Australia to the United Kingdom. Project-finance lenders, meanwhile, grapple with commodity price swings that complicate battery and wind economics, tightening debt covenants and raising interest-coverage thresholds. Corporate decarbonization targets stimulate off-balance-sheet PPAs, driving a parallel funding avenue outside traditional utility rate bases. Overall, the competitive fabric remains dynamic, shaped by policy, technology, and finance, all moving at differing speeds across segments.
Power Industry Leaders
State Grid Corporation of China
Electricité de France (EDF)
Enel SpA
Engie SA
Iberdrola SA
- *Disclaimer: Major Players sorted in no particular order

Recent Industry Developments
- October 2025: Brookfield Asset Management closed its Global Transition Fund II at USD 20 billion to accelerate clean energy, including 10 GW of renewable and storage projects in India via Evren. Key investors include ALTÉRRA (USD 2B) and Norges Bank (USD 1.5B), with USD 3.5B in co-investments, totaling USD 23.5B raised.
- October 2025: China completed the world’s first wind-powered underwater data center in Shanghai, using offshore wind and seawater cooling to achieve over 95% green electricity and a PUE of ≤1.15. The 24 MW facility demonstrates low-carbon subsea computing and paves the way for a 500 MW offshore wind-powered UDC, supporting Shanghai’s goal of 200 EFLOPS computing capacity by 2027.
- August 2025: ACWA Power began commercial operations of a 2.7 GW solar PV portfolio in Saudi Arabia, comprising the Al Kahfah (1.4 GW), Ar Rass 2 (1 GW of a planned 2 GW), and SAAD 2 (365.7 MW of 1.1 GW) projects, in partnership with Badeel (PIF). The SAR12.2 billion (USD 3.3 billion) projects supply electricity to the Saudi Power Procurement Company under a May 2023 offtake agreement.
- July 2025: ENGIE fully commissioned the 650 MW Red Sea Wind Energy farm in Ras Ghareb, Egypt, the largest in the Middle East and Africa, powering over one million homes and cutting 1.3 million tons of CO₂ annually. Developed by a consortium led by ENGIE and backed by international financiers, the project operates under a 25-year PPA with the Egyptian Electricity Transmission Company.


Global Power Market Report Scope
Generally, electricity generation is the process of generating electric power from primary energy sources. For utilities in the electricity industry, electricity generation is the process of delivering (transmission, distribution, etc.) electricity to end users or storing it. The market size and forecasts for each segment have been done regarding installed capacity (GW). The scope of Power Market report includes:
By Power-Generation Source
| Thermal (Coal, Natural Gas, Oil and Diesel) |
| Nuclear |
| Renewables (Solar, Wind, Hydro, Geothermal, Biomass & Waste, Tidal) |
By End-User
| Utilities |
| Commercial and Industrial |
| Residential |
By T&D Voltage Level (Qualitative Analysis only)
| High-Voltage Transmission (Above 230 kV) |
| Sub-Transmission (69 to 161 kV) |
| Medium-Voltage Distribution (13.2 to 34.5 kV) |
| Low-Voltage Distribution (Up to 1 kV) |
By Geography
| North America | United States |
| Canada | |
| Mexico | |
| Europe | United Kingdom |
| Germany | |
| France | |
| Spain | |
| Nordic Countries | |
| Russia | |
| Rest of Europe | |
| Asia-Pacific | China |
| India | |
| Japan | |
| South Korea | |
| Malaysia | |
| Thailand | |
| Indonesia | |
| Vietnam | |
| Australia | |
| Rest of Asia-Pacific | |
| South America | Brazil |
| Argentina | |
| Colombia | |
| Rest of South America | |
| Middle East and Africa | United Arab Emirates |
| Saudi Arabia | |
| South Africa | |
| Egypt | |
| Rest of Middle East and Africa |
| By Power-Generation Source | Thermal (Coal, Natural Gas, Oil and Diesel) | |
| Nuclear | ||
| Renewables (Solar, Wind, Hydro, Geothermal, Biomass & Waste, Tidal) | ||
| By End-User | Utilities | |
| Commercial and Industrial | ||
| Residential | ||
| By T&D Voltage Level (Qualitative Analysis only) | High-Voltage Transmission (Above 230 kV) | |
| Sub-Transmission (69 to 161 kV) | ||
| Medium-Voltage Distribution (13.2 to 34.5 kV) | ||
| Low-Voltage Distribution (Up to 1 kV) | ||
| By Geography | North America | United States |
| Canada | ||
| Mexico | ||
| Europe | United Kingdom | |
| Germany | ||
| France | ||
| Spain | ||
| Nordic Countries | ||
| Russia | ||
| Rest of Europe | ||
| Asia-Pacific | China | |
| India | ||
| Japan | ||
| South Korea | ||
| Malaysia | ||
| Thailand | ||
| Indonesia | ||
| Vietnam | ||
| Australia | ||
| Rest of Asia-Pacific | ||
| South America | Brazil | |
| Argentina | ||
| Colombia | ||
| Rest of South America | ||
| Middle East and Africa | United Arab Emirates | |
| Saudi Arabia | ||
| South Africa | ||
| Egypt | ||
| Rest of Middle East and Africa | ||


Key Questions Answered in the Report
What is the projected capacity of the global power market by 2031?
The global power market is forecast to reach 16,829.74 GW by 2031, reflecting an 8.55% CAGR from 2026 levels.
Which region is growing fastest in new power capacity?
South America shows the highest growth, advancing at a 15.10% CAGR through 2031 as lithium mining and green-hydrogen exports expand.
How dominant are renewables in new capacity additions?
Renewables supplied 73% of 2024 capacity additions and already hold 47.95% of installed capacity, posting a 13.70% CAGR outlook.
Why are data centers reshaping electricity demand patterns?
Hyperscale facilities now draw up to 200 MW each and collectively consumed 460 TWh in 2024, causing localized baseload spikes and grid upgrades.
What role does battery storage play in grid flexibility?
Utility-scale battery costs dropped to USD 132/kWh, enabling 42 GW of global installations in 2024 that arbitrage renewable oversupply into evening demand peaks.
Page last updated on:


