Market Overview
| Study Period | 2021 - 2031 |
|---|---|
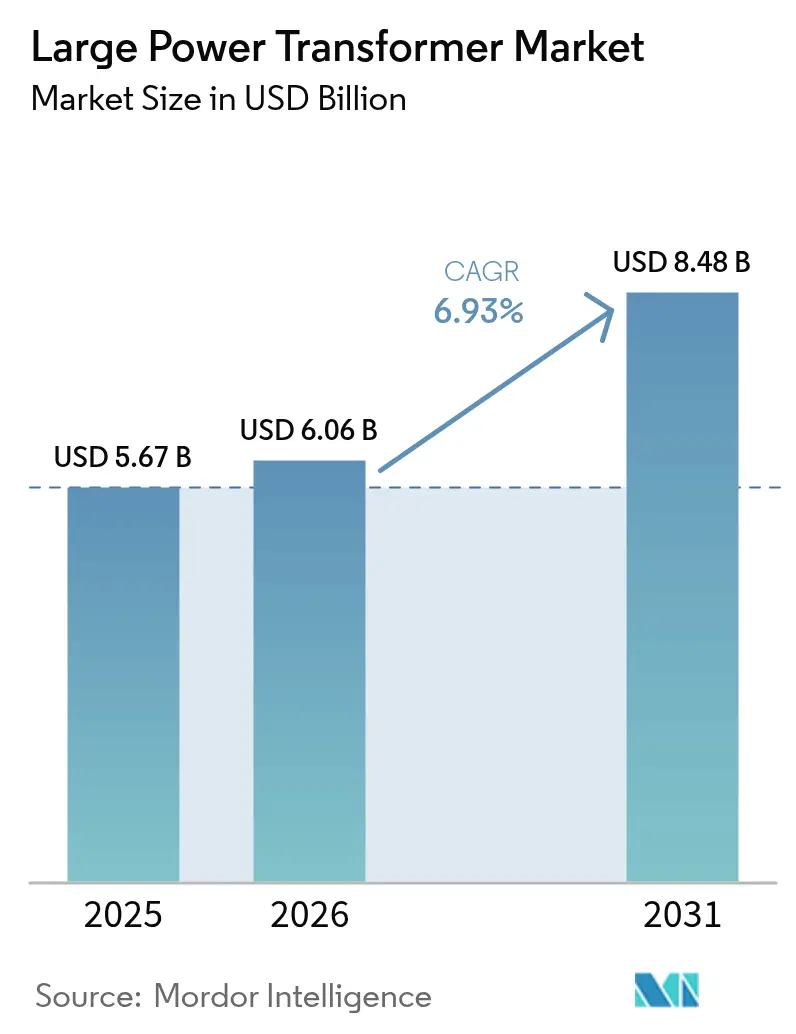
| Market Size (2026) | USD 6.06 Billion |
| Market Size (2031) | USD 8.48 Billion |
| Growth Rate (2026 - 2031) | 6.93% CAGR |
| Fastest Growing Market | Asia Pacific |
| Largest Market | Asia Pacific |
| Market Concentration | Medium |
Major Players *Disclaimer: Major Players sorted in no particular order Image © Mordor Intelligence. Reuse requires attribution under CC BY 4.0. | |
Large Power Transformer Market Analysis by Mordor Intelligence
The Large Power Transformer Market size was valued at USD 5.67 billion in 2025 and estimated to grow from USD 6.06 billion in 2026 to reach USD 8.48 billion by 2031, at a CAGR of 6.93% during the forecast period (2026-2031).
A 6.4% year-over-year rise in 2025 is expected, showing resilient demand even as material costs and manufacturing capacity remain tight. Expansion programs in China, India, and ten ASEAN member states keep procurement pipelines full, while aging fleets in North America and Europe trigger steady replacement orders. Utilities increasingly specify ester-based fluids, digital monitoring, and modular tank designs to meet climate-resilience mandates, helping suppliers shift from single-order manufacturing to platform-based production. Supply-chain risk has become a strategic concern; many buyers now place multi-year framework orders to secure allocation well before projects receive final permits.
Key Report Takeaways
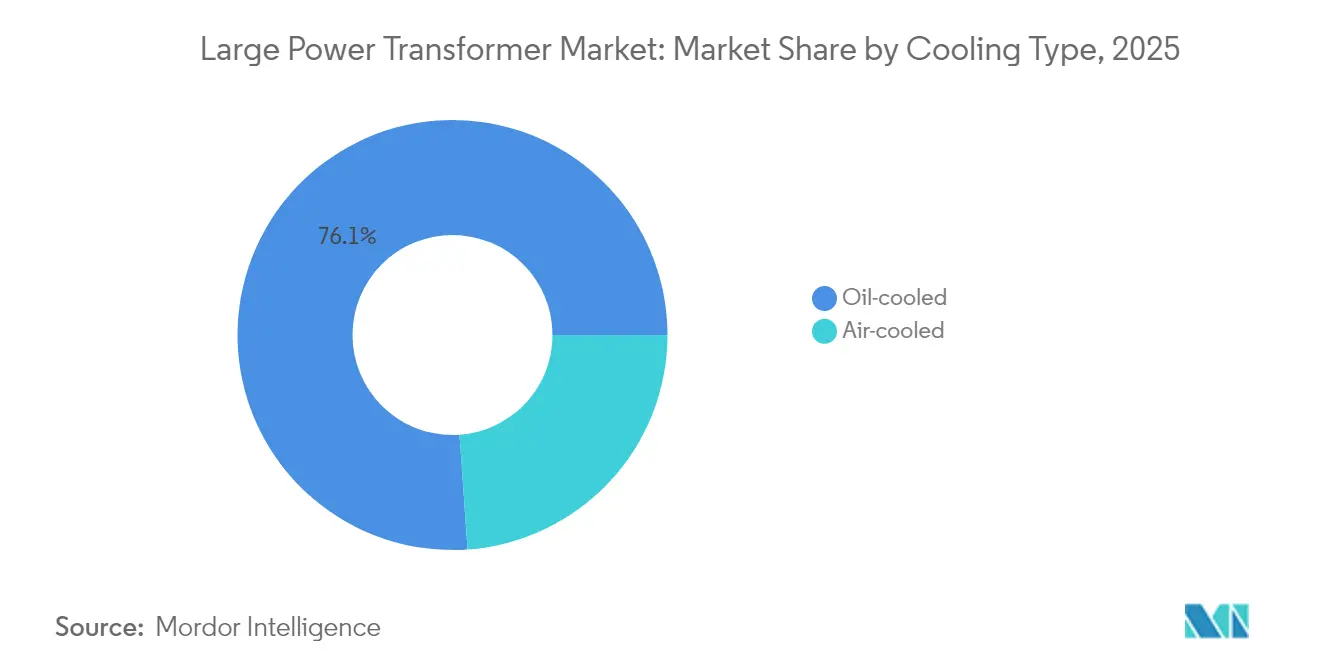
- By cooling type, oil-cooled designs led with a 76.12% revenue share in 2025; air-cooled units are forecast to post the fastest growth of 7.95% CAGR through 2031.
- By phase, three-phase units captured 64.05% of the large power transformer market share in 2025, while single-phase alternatives are set to advance at a 6.48% CAGR to 2031.
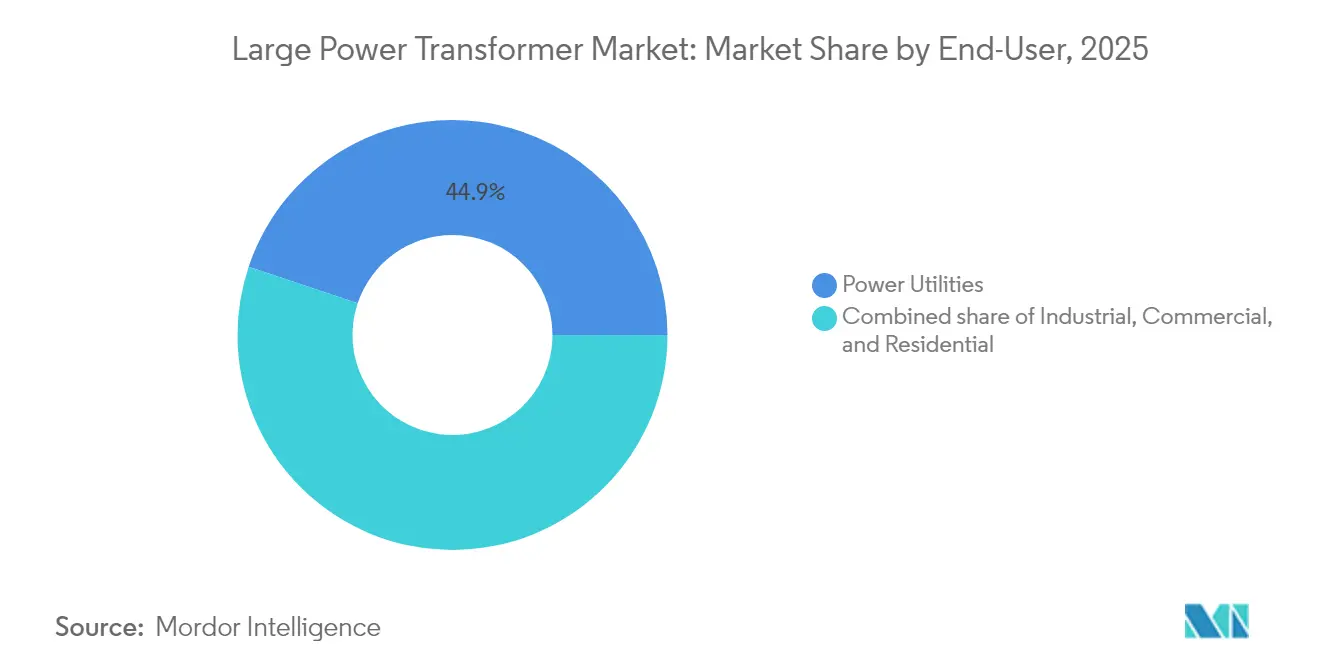
- By end-user, power utilities accounted for 44.85% of 2025 orders, whereas industrial customers exhibited the highest 8.02% CAGR outlook through 2031.
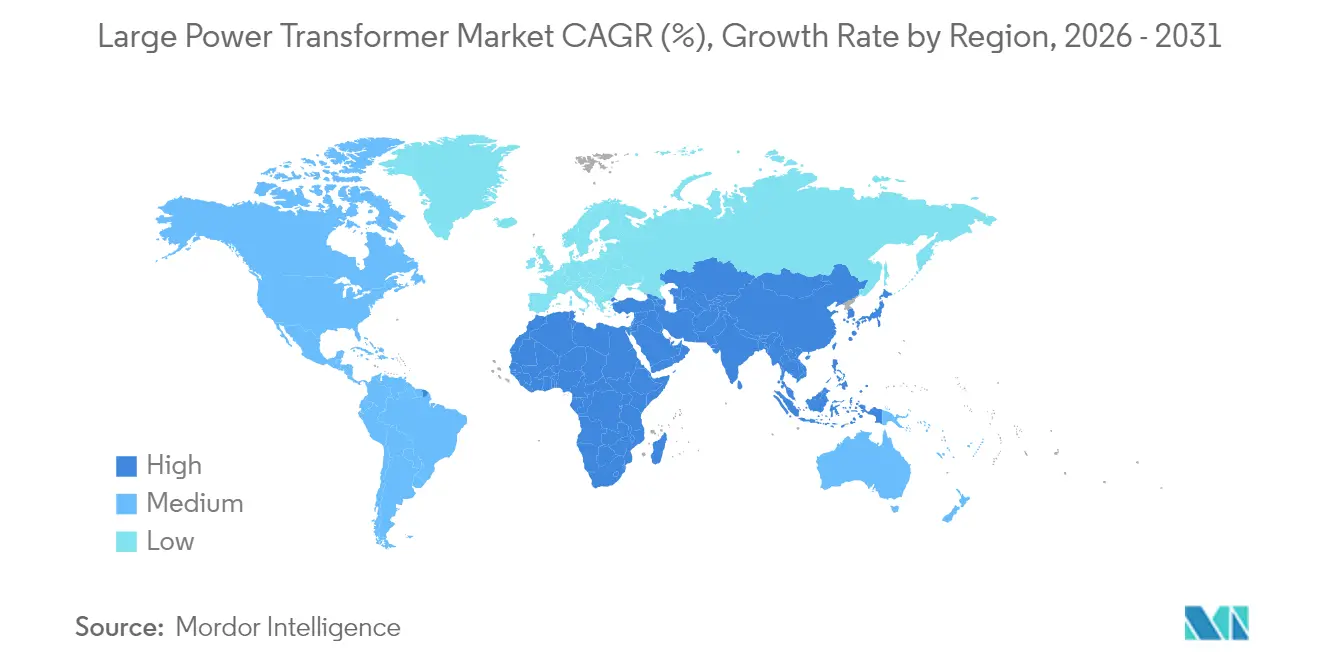
- By geography, the Asia-Pacific region dominated with 42.75% of 2025 revenue and is also projected to deliver a 7.45% regional CAGR through 2031.
Note: Market size and forecast figures in this report are generated using Mordor Intelligence’s proprietary estimation framework, updated with the latest available data and insights as of 2026.
Global Large Power Transformer Market Trends and Insights
Drivers Impact Analysis*
| Driver | % Impact on CAGR Forecast | Geographic Relevance | Impact Timeline |
|---|---|---|---|
| Rapid grid-expansion programs in emerging economies | +2.0% | APAC core, spill-over to MEA | Medium term (2-4 years) |
| Accelerated integration of large-scale renewables | +1.5% | Global | Long term (≥ 4 years) |
| Replacement cycle for ageing >40-yr transformer fleet | +1.0% | North America & EU | Short term (≤ 2 years) |
| HV transformers for green-hydrogen electrolyser clusters | +0.6% | Europe & Middle East | Long term (≥ 4 years) |
| Inter-regional HVDC corridors for hyperscale data-centres | +1.2% | Global | Medium term (2-4 years) |
| Climate-resilience mandates for substation assets | +0.5% | North America & EU | Medium term (2-4 years) |
| Source: Mordor Intelligence | |||
Rapid Grid-Expansion Programs in Emerging Economies
Governments across the Asia-Pacific have embarked on the most ambitious transmission build-outs in modern history. China is spending USD 70 billion annually on approximately 800 kV ultra-high-voltage corridors, such as the 2,370-kilometer Gansu-Zhejiang link, which transports 36 TWh of renewable electricity each year.[1]People’s Daily Staff, “China Builds World’s Highest UHVDC Transmission Project,” people.cn India’s USD 109 billion plan aims to achieve 500 GW of new renewable capacity by 2030, while the ASEAN Power Grid plans to allocate USD 100 billion for cross-border interconnections that will serve more than 670 million residents.[2] Asian Development Bank editors, “ASEAN Power Grid Vision,” adb.org Similar mega-projects are also emerging in Africa; for instance, the Ethiopia-Kenya electricity highway now delivers electricity equivalent to 10% of Kenya’s peak demand through a single 1,045-kilometre intertie. These undertakings are transforming ordering patterns: utilities now purchase multi-year blocks of identical three-phase units to accelerate construction schedules and secure volume discounts.
Accelerated Integration of Large-Scale Renewables
The International Energy Agency calculates that global grids must add more than 80 million kilometres of new lines by 2040 to accommodate the deployment of renewable energy, driving USD 140 billion in transmission spending in 2024 alone.[3]International Energy Agency, “Building the Future Transmission Grid,” iea.org HVDC has emerged as the preferred architecture for transmitting bulk renewable power over long distances, as demonstrated by projects such as the 885-kilometre SunZia line, which will export 3,500 MW of New Mexico wind energy to Arizona. Europe’s SuedOstLink and SuedLink corridors rely on 525 kV converter transformers able to operate at sea-cable temperatures and variable load profiles. Sub-Saharan and North African exporters plan to send up to 24 GW of clean power to Europe via subsea cables, further expanding the customer base for high-capacity units. Digital-twinned transformers equipped with dynamic ratings unlock 20-40% incremental throughput on existing lines, creating a secondary revenue pool for sensor-enabled retrofits.
Replacement Cycle for Ageing Above 40-Year Transformer Fleet
Utilities in developed markets are facing a wave of retirement as assets installed during the 1970s oil-price shock reach the end of their design life. The U.S. Department of Energy reports that the average age of large power transformers is 38 years, significantly exceeding the nominal 30-year benchmark. Field autopsies conducted by TEPCO reveal that moisture levels, rather than chronological age, dictate the failure risk; units with low water content can last upwards of 80 years, whereas high-moisture assets deteriorate rapidly. Climate change compounds the urgency: MIT modeling demonstrates that a 1 °C rise in ambient temperature can reduce the thermal lifespan by 10%, implying 20-40% shorter lives for equipment operating in 2040 climate scenarios. Consequently, utilities are front-loading replacement budgets and specifying ester-based insulating fluids, along with forced-oil cooling, to survive hotter summers.
HV Transformers for Green-Hydrogen Electrolyser Clusters
Gigawatt-scale electrolysis facilities consume electricity in pulses and at power-quality levels that differ significantly from those of traditional loads. The Dutch HydroHub roadmap has identified 22 onshore sites where ≥380 kV connections will feed green-hydrogen clusters, each demanding step-down transformers rated for rapid load swings and high harmonic distortion, according to the Institute for Sustainable Process Technology. Cooling systems must tolerate large reactive-power fluctuations, leading manufacturers to adopt dual-pump oil circuits and high-temperature solid-insulation composites. European industrial hubs, particularly around Rotterdam and the Rhine, are piloting such designs to enable hydrogen production to marginally curtail output during grid-stress events without damaging the transformer. Early field feedback confirms that smart-breaker coordination, combined with real-time frequency monitoring, minimizes electrolyser trips, thereby reducing the revenue risk associated with power cuts.
Restraints Impact Analysis*
| Restraint | % Impact on CAGR Forecast | Geographic Relevance | Impact Timeline |
|---|---|---|---|
| Volatile copper & electrical-steel prices | −1.1% | Global | Short term (≤ 2 years) |
| 18–24-month manufacturing lead-times vs project delays | −0.8% | Global | Medium term (2-4 years) |
| Community opposition to new transmission corridors | −0.7% | North America & Europe | Medium term (2-4 years) |
| Skilled coil-winding labor shortages | −0.6% | Global | Long term (≥ 4 years) |
| Source: Mordor Intelligence | |||
Volatile Copper & Electrical-Steel Prices
BHP expects global copper demand to rise by 70% to more than 50 million tonnes annually by 2050, driven primarily by electrification megatrends. Transformers are uniquely copper-intensive: a 400 MVA unit may contain up to 25 t of conductor, so a 10% price swing can shift unit economics by millions of dollars. Complicating matters, grain-oriented electrical steel—essential for achieving high efficiency—remains in chronic short supply because only a handful of mills worldwide produce the requisite texture. Qualifying a new mill can take three years due to stringent core-loss tests, leaving original-equipment manufacturers to hedge with financial derivatives or negotiate price-escalation clauses with utility buyers. The result is contract structures that reset prices quarterly rather than the traditional yearly cadence, a change that many public procurement rules still struggle to accommodate.
18–24-Month Manufacturing Lead-Times vs Project Delays
A surge in public-tender volumes has stretched factory waiting lists well beyond historic norms. Estimates indicate that transformer demand has increased by 23% since 2019, whereas global nameplate capacity has risen by less than 5%. Skilled labour shortages amplify the problem because coil-winding and core-stacking require years of apprenticeship. Automation programs, such as laser-guided core-cutting, have begun to improve throughput; however, temporary line stoppages during retooling actually increase backlogs in the near term. Developers are therefore ordering equipment at financial close rather than at notice-to-proceed, tying up capital but preventing 12- to 24-month project slips. Some utilities have also launched “evergreen framework” contracts that guarantee minimum annual volumes to preferred suppliers in exchange for priority slotting.
*Our forecasts treat driver/restraint impacts as directional, not additive. The impact forecasts reflect baseline growth, mix effects, and variable interactions.
Segment Analysis
By Cooling Type: Oil-Cooled Strength, Air-Cooled Momentum
Oil-immersed designs accounted for 76.12% of 2025 revenue, reflecting proven thermal capacity and long service life. That share is expected to hold even as air-cooled units record the fastest 7.95% CAGR. Utilities often select air-cooled styles when land values, fire safety rules, or maintenance access make liquid containment difficult. Research on nano-enhanced cellulose insulation has reduced hotspot temperatures by 5–10 °C, thereby extending the mean time to failure for both cooling systems.
Air-cooled adoption is most visible in rooftop solar inverters, metro rail traction substations, and data-center campuses that favor sealed designs. Meanwhile, ester-fluid hybrids offer a compromise: they match the heat-transfer capacity of oil yet provide higher fire points and biodegradability. The U.S. grid-modernization program now ties investment tax credits to the use of less-flammable fluids, accelerating a shift toward natural esters.


By Phase: Three-Phase Efficiency Steers Market Leadership
Three-phase designs accounted for 64.05% of 2025 revenue and are expected to maintain a 7.24% CAGR through 2031. Their symmetrical load flow, lower conductor mass per kVA, and smaller pad footprint keep total installed cost down relative to single-phase options. Single-phase ownership is expanding in modular wind and solar arrays because transport rules favor lighter skid-mounted blocks that can be relocated when offtake agreements expire. Reinhausen’s 3,200 A on-load tap changer underpins larger three-phase builds suitable for 525 kV converter stations.
Utilities also pursue U.S. Department of Energy pilot units that feature reconfigurable windings, supporting multiple voltage ratios within the same tank, which enables faster rerouting during contingencies. Japan’s decade-long field trial of a 3,000 MVA, 1,100 kV three-phase prototype has validated dielectric reliability, reinforcing confidence in ultra-high-capacity builds.
By End-User: Utility Core, Industrial Upswing
Power utilities accounted for 44.85% of the 2025 orders, reflecting their statutory duty to maintain grid adequacy. Forward procurement now emphasizes digital-ready assets; for example, Hitachi Energy’s latest framework with a European TSO bundles IoT sensors as a default specification. Industrial buyers—spanning metals, chemicals, and hyperscale IT—form the fastest-growing segment, with an 8.02% CAGR. Data-center developers in northern Europe and the U.S. Midwest zones request units with low audible noise and harmonic-filter windings to meet local zoning criteria.
Commercial and residential categories remain modest in value terms, yet they benefit from electric-vehicle charging hubs and distributed rooftop solar that require medium-capacity step-down transformers. Brazil’s state-owned utility Cemig earmarked USD 7.1 billion equivalent for transmission upgrades between 2025 and 2029, underscoring that regulated utilities still dictate baseline volume
Geography Analysis
Asia-Pacific produced 42.75% of 2025 revenue and carries the fastest 7.45% regional CAGR outlook. China alone channels USD 70 billion per year into ultra-high-voltage construction, exemplified by the 1,901-kilometer Gansu-Zhejiang ±800 kV corridor that transports wind and solar power from the northwest to the coastal east. India’s USD 109 billion transmission master plan and the ASEAN Power Grid’s USD 100 billion budget further expand the addressable base, while Japan’s validated 3,000 MVA designs showcase regional leadership at the technical frontier. Australia adds momentum with projects such as CopperString 2032, which will build a 1,100-kilometre backbone to integrate Queensland renewables. Consequently, suppliers operating in the region enjoy order visibility well into the next decade.
The growth in the Middle East & Africa region is powered by megaprojects aimed at exporting renewable electricity to Europe and deepening intra-African trade. Morocco’s 11.5 GW Xlinks initiative will install 4,000 kilometres of submarine cable and require multiple 525 kV converter stations. In parallel, Gulf utilities leverage petrodollar surpluses to build redundant inter-emirate links and to pilot green-hydrogen corridors. Sub-Saharan Africa witnesses incremental yet symbolic milestones, such as the Ethiopia-Kenya intertie, which has already displaced diesel generation equal to 10% of Kenyan peak load. Financing hurdles persist, but multilateral lenders are increasingly underwriting currency hedging to unlock private-sector participation and expedite transformer procurement.
North America and Europe are pursuing steady, replacement-driven demand trajectories, coupled with obligations to integrate renewables. U.S. supply constraints have pushed lead times for specialized units into the 18-24 month window, triggering Department of Energy programs that incentivize domestic production. European network operators must juggle ageing asset fleets with the Tier 3 eco-design rule, which is expected to be implemented by 2027, under which efficiency penalties for low-grade core steel will tighten further. Germany’s SuedLink HVDC corridor and the UK’s proposed Morocco interconnector together exemplify how Europe leverages large-scale imports to meet net-zero targets. South America, although still a smaller market, is showing increasing depth: Brazil’s 2024 transmission auctions attracted a record level of interest, and the Ecuador–Peru 500 kV interconnection is slated for contract award in 2025.

Competitive Landscape
The large power transformer market remains moderately consolidated, yet capital-intensive barrier-to-entry dynamics continue to limit new entrants to niche segments. Hitachi Energy leads with an announced USD 6 billion global expansion, allocating USD 1.5 billion to transformers alone, including new capacity in Finland, Spain, and Virginia, which will add 4,000 skilled jobs. Siemens Energy differentiates through digital twin platforms integrated with its Gridscale X portfolio, having secured multi-year service agreements across Malta and the Netherlands. GE Vernova has focused on the North American market share by acquiring SPX Transformer Solutions, thereby gaining additional coil-winding lines and substation service teams.
Asian competitors scale rapidly. Hyosung Heavy Industries will nearly double its Memphis output to 250 units per year by 2027, targeting a more than 10% U.S. share. HD Hyundai Electric plans a USD 274 million revamp of Alabama and Ulsan plants, bolstering its lead in ≥765 kV class deliveries. Vertically integrated Chinese firms have begun marketing split-tank transformer kits that reduce shipping times to North America, although geopolitical considerations and compliance with U.S. cybersecurity regulations limit their market penetration. Technology raceways now centre on ester-fluid insulation, flexible dual-voltage windings, and AI-driven anomaly detection that can predict failures 6–12 months in advance. Private-equity funds, exemplified by Mill Point Capital’s Voltaris platform, view these capabilities as value-creation levers and have entered with buy-and-build strategies focused on North American mid-cap manufacturers.
Strategic playbooks converge on vertical integration of core steel, regionalised factory footprints, and collaborative R&D with utilities aimed at climate-proof designs. Hitachi Energy’s Virginia facility, for instance, will host an R&D centre on eco-friendly dielectric fluids and advanced nanocomposite insulation, supported by a grant from the U.S. National Science Foundation. Siemens Energy’s partnership with German TSOs pilots 3D-printed tap-changer components that cut maintenance outages by 40%. Meanwhile, GE Vernova’s Lithuanian plant has begun using hydrogen-fired furnaces for core-annealing, lowering carbon intensity per unit by 20%. As production techniques modernize, top-tier players argue that scale economies and intellectual property depth will further raise competitive barriers.
Large Power Transformer Industry Leaders
Siemens Energy AG
Hitachi Energy Ltd
Toshiba Energy Systems & Solutions Corporation
GE Vernova
Mitsubishi Electric Corporation
- *Disclaimer: Major Players sorted in no particular order


Recent Industry Developments
- April 2025: Hitachi Energy expands its U.S. footprint with a USD 22.5 million investment in a new 75,000-sq-ft plant in Atkins, Virginia, upgrading the adjacent Bland facility and creating about 120 jobs.
- March 2025: Hyosung Heavy Industries unveils a plan to double U.S. transformer output to more than 250 units annually by 2027.
- March 2025: Hitachi Energy allocates an additional USD 250 million to expand global transformer output, targeting completion by 2027.
- January 2025: HD Hyundai Electric invests USD 274 million to lift capacity at its Alabama and Ulsan plants by 30%.


Global Large Power Transformer Market Report Scope
The scope of the large power transformer market report includes:
By Cooling Type
| Air-cooled |
| Oil-cooled |
By Phase
| Single-Phase |
| Three-Phase |
By End-User
| Power Utilities (includes, Renewables, Non-renewables, and T&D) |
| Industrial |
| Commercial |
| Residential |
By Geography
| North America | United States |
| Canada | |
| Mexico | |
| Europe | Germany |
| United Kingdom | |
| France | |
| Italy | |
| Spain | |
| Russia | |
| Rest of Europe | |
| Asia-Pacific | China |
| India | |
| Japan | |
| South Korea | |
| ASEAN Countries | |
| Australia and New Zealand | |
| Rest of Asia-Pacific | |
| South America | Brazil |
| Argentina | |
| Chile | |
| Rest of South America | |
| Middle East and Africa | Saudi Arabia |
| United Arab Emirates | |
| South Africa | |
| Egypt | |
| Rest of Middle East and Africa |
| By Cooling Type | Air-cooled | |
| Oil-cooled | ||
| By Phase | Single-Phase | |
| Three-Phase | ||
| By End-User | Power Utilities (includes, Renewables, Non-renewables, and T&D) | |
| Industrial | ||
| Commercial | ||
| Residential | ||
| By Geography | North America | United States |
| Canada | ||
| Mexico | ||
| Europe | Germany | |
| United Kingdom | ||
| France | ||
| Italy | ||
| Spain | ||
| Russia | ||
| Rest of Europe | ||
| Asia-Pacific | China | |
| India | ||
| Japan | ||
| South Korea | ||
| ASEAN Countries | ||
| Australia and New Zealand | ||
| Rest of Asia-Pacific | ||
| South America | Brazil | |
| Argentina | ||
| Chile | ||
| Rest of South America | ||
| Middle East and Africa | Saudi Arabia | |
| United Arab Emirates | ||
| South Africa | ||
| Egypt | ||
| Rest of Middle East and Africa | ||


Key Questions Answered in the Report
How big will the large power transformer market be by 2031?
It is projected to reach USD 8.48 billion by 2031, supported by a 6.93% CAGR during 2026-2031.
Which region will grow the fastest in transformer demand?
Asia-Pacific leads both size and growth, with a 7.45% regional CAGR forecast through 2031 due to heavy grid-build programs.
Why are delivery lead times so long for large transformers?
Limited global manufacturing capacity and skilled labor shortages have extended delivery windows to 120–210 weeks for specialized units.
What cooling technology is gaining traction besides oil-immersed units?
Air-cooled and ester-fluid hybrids are expanding because they reduce fire risk and lower maintenance in urban or remote sites.
Which end-user segment is expanding fastest?
Industrial buyers, particularly data-center and green-hydrogen operators, are expected to post an 8.02% CAGR through 2031.
Page last updated on:


