
Payment Processing Solutions Market Size and Share
Market Overview
| Study Period | 2020 - 2031 |
|---|---|
| Market Size (2026) | USD 96.89 Billion |
| Market Size (2031) | USD 221.16 Billion |
| Growth Rate (2026 - 2031) | 17.95 % |
| Fastest Growing Market | Asia Pacific |
| Largest Market | North America |
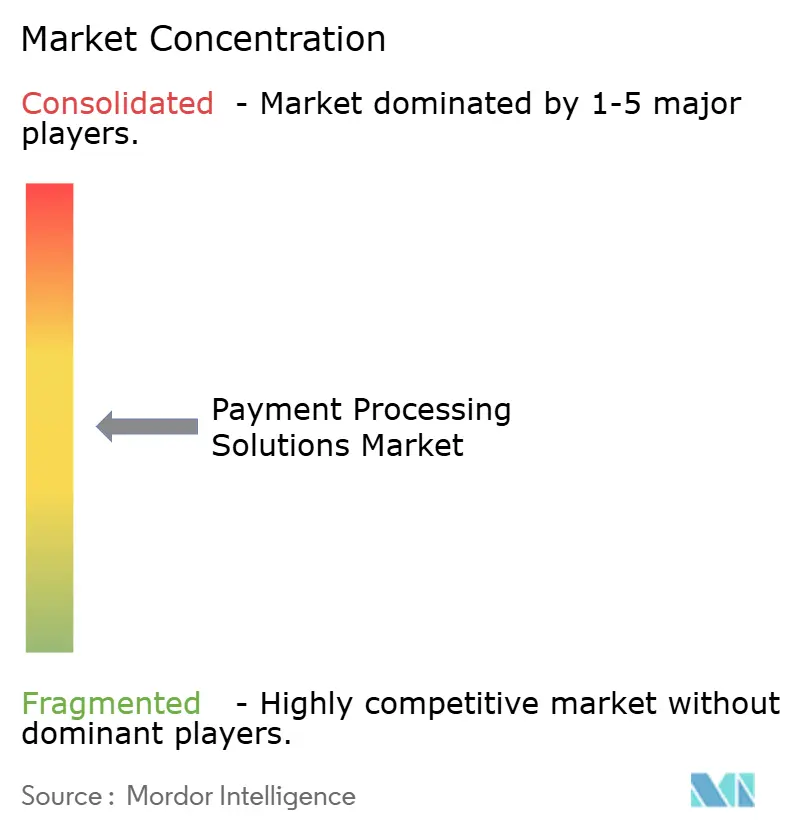
| Market Concentration | Medium |
Major Players *Disclaimer: Major Players sorted in no particular order Image © Mordor Intelligence. Reuse requires attribution under CC BY 4.0. | |
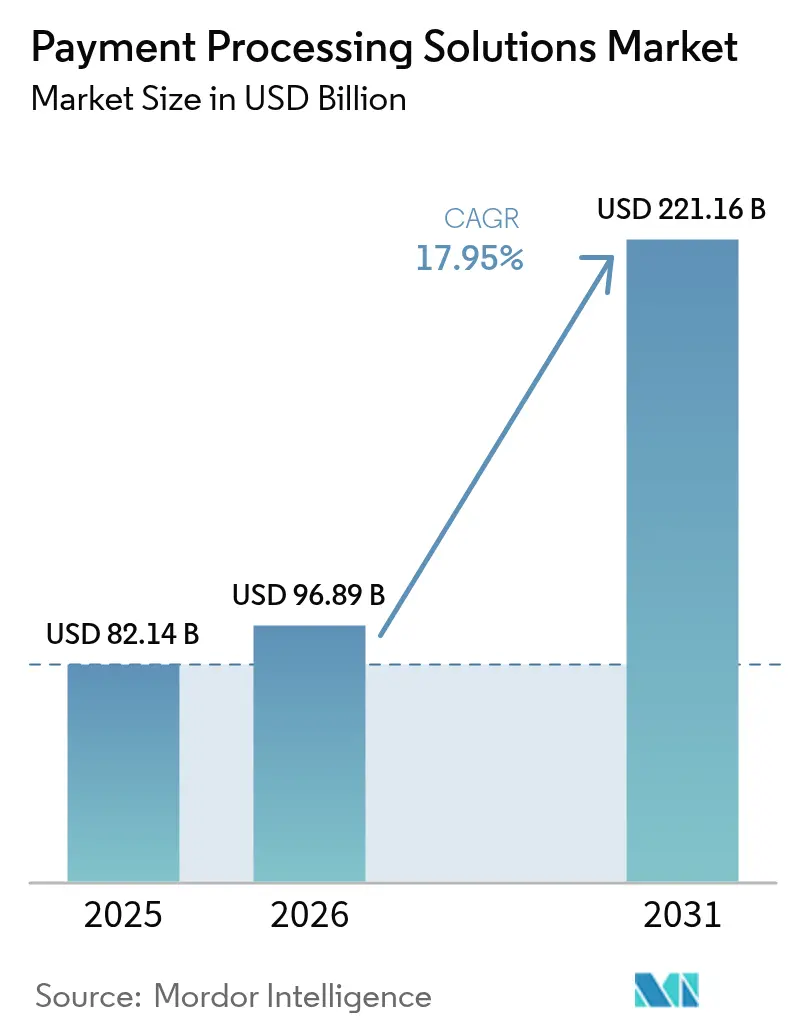
Payment Processing Solutions Market Analysis by Mordor Intelligence
The payment processing solutions market size is expected to grow from USD 82.14 billion in 2025 to USD 96.89 billion in 2026 and is forecast to reach USD 221.16 billion by 2031 at 17.95% CAGR over 2026-2031. Regulatory mandates for cash-light economies, the rollout of real-time rails, and API-first infrastructures that embed settlement inside business software are reshaping revenue pools for incumbents and new entrants alike. Central banks in Asia and the Nordics are pushing instant payment schemes that lower transaction costs and drive financial inclusion, while tokenization programs led by Visa and Mastercard reduce fraud risk and lift authorization rates. [2]PYMNTS, “Visa Says 10 Billion Tokenized Payments Are Just the Beginning,” pymnts.com Cross-border e-commerce is accelerating demand for multi-currency engines, especially as consumer-to-merchant flows grow faster than business-to-business volumes.
Competitive pressure continues to intensify: fintech unicorns and Big Tech platforms are offering vertically integrated payment stacks, prompting incumbents to pursue mega-acquisitions to secure scale advantages and defend margins. Margin headwinds from interchange volatility, fragmented regulatory requirements, and PCI-DSS 4.0 compliance costs challenge profitability, but processors that provide cloud-native, tokenized, and embedded finance capabilities are positioned to capture the next wave of growth.
Key Report Takeaways
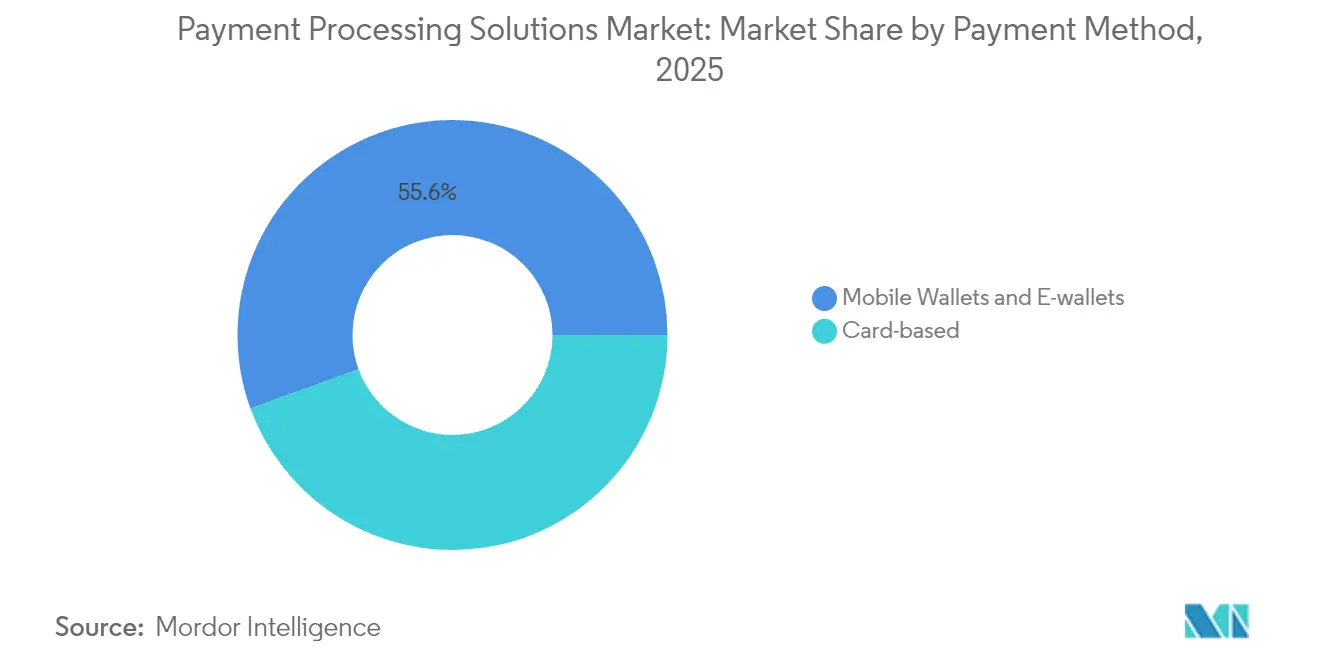
- By payment method, card-based payments held 44.45% of the payment processing solutions market share in 2025, while mobile wallets are forecast to expand at 22.65% CAGR through 2031.
- By deployment mode, cloud solutions captured 57.85% revenue share in 2025; the segment is advancing at a 18.7% CAGR to 2031.
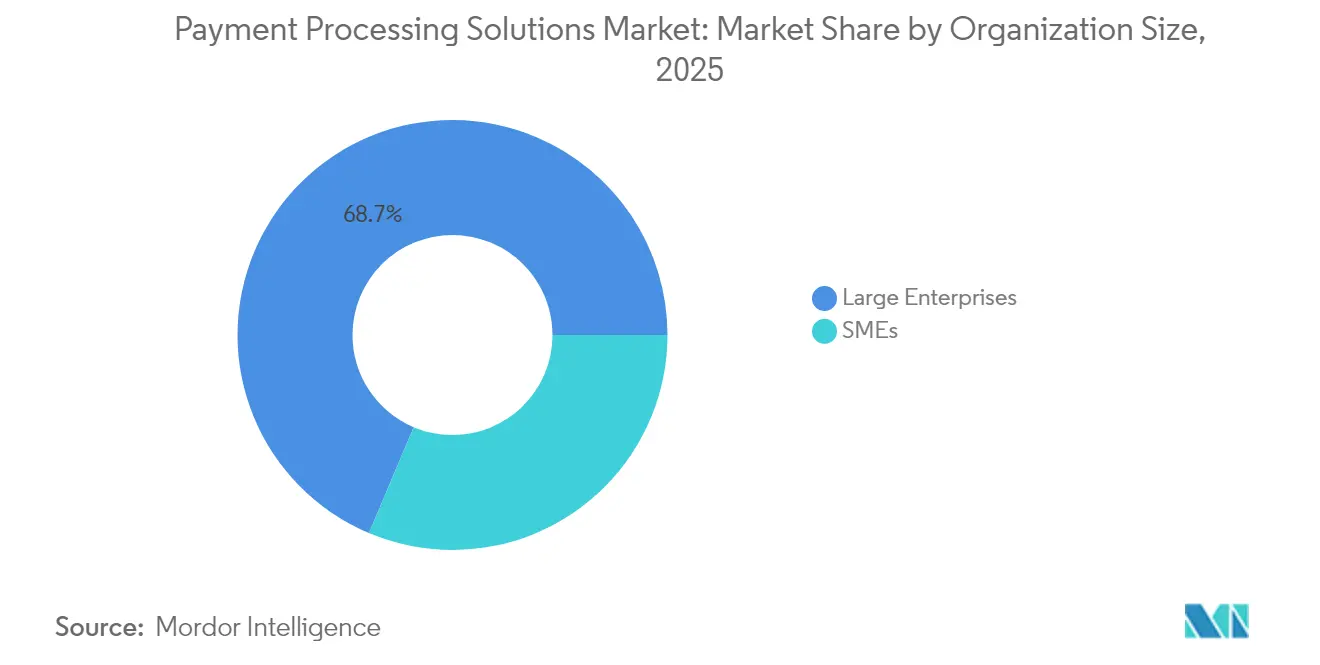
- By organization size, large enterprises accounted for 68.65% of the payment processing solutions market size in 2025, whereas SMEs are growing the fastest at a 20.75% CAGR.
- By end-user industry, retail and e-commerce commanded 41.25% share in 2025; healthcare is set to post a 21.95% CAGR between 2026-2031.
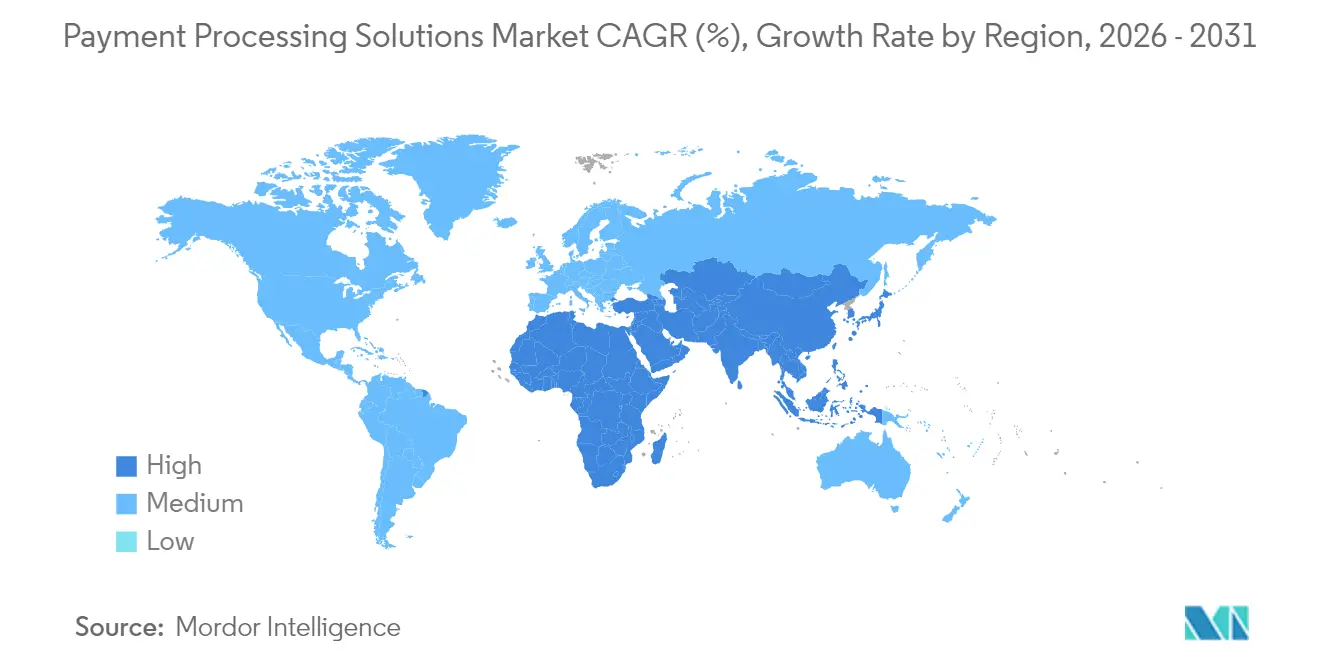
- By geography, North America led with 35.80% share in 2025, while Asia-Pacific is projected to record a 20.85% CAGR over the forecast period.
Note: Market size and forecast figures in this report are generated using Mordor Intelligence’s proprietary estimation framework, updated with the latest available data and insights as of 2026.
Market Trends and Insights
Drivers Impact Analysis of Payment Processing Solutions Market*
| Driver | (~) % Impact on CAGR Forecast | Geographic Relevance | Impact Timeline |
|---|---|---|---|
| Rapid Adoption of Real-Time Payment Infrastructure in Emerging Markets | +4.2% | Asia-Pacific, Latin America, with spillover to MEA | Medium term (2-4 years) |
| Integrated Platforms Delivering Value-Added Services to SMEs | +3.8% | Global, with early gains in North America & Europe | Short term (≤ 2 years) |
| Regulatory Push Toward Cashless Economies in Asia & Nordics | +3.1% | APAC core, Nordic countries, selective EU markets | Long term (≥ 4 years) |
| Network Tokenization Boosting Card-Not-Present Authorization Rates | +2.9% | Global, led by North America & Europe | Short term (≤ 2 years) |
| Embedded Finance Expanding Acceptance Points | +2.7% | Global, concentrated in developed markets | Medium term (2-4 years) |
| Cross-Border E-commerce Requiring Multi-Currency Processing | +1.6% | Global, with emphasis on trade corridors | Long term (≥ 4 years) |
| Source: Mordor Intelligence | |||
Rapid adoption of real-time payment infrastructure in emerging markets
Central-bank-sponsored rails now operate in 79 countries and settle transactions within seconds, cutting float and failed-payment costs. ACI Worldwide estimated that real-time systems supported USD 164 billion in GDP across 40 economies in 2023 and could reach USD 285.8 billion by 2028. India’s UPI processed 120 billion transactions in 2023, while Brazil’s Pix logged 8.1 billion transactions in Q1 2023, illustrating how government mandates accelerate adoption and create templates for other markets. Regional initiatives such as ASEAN’s Regional Payment Connectivity promise seamless cross-border instant transfers that bypass correspondent banking. Processors that integrate these rails gain volume scale, lower per-transaction costs, and extend reach to unbanked users.
Integrated platforms delivering value-added services to SMEs
SMEs seek unified solutions that bundle payments with invoicing, financing, and analytics. Stripe’s Revenue & Finance Automation suite surpassed a USD 500 million run rate in 2024, demonstrating merchants’ appetite for adjacent services. The payment processing solutions market benefits as API-first architectures let providers embed card acceptance, ACH, and alternative methods into accounting or POS software with minimal code. SMEs value faster onboarding and integrated dashboards, creating higher retention and upsell opportunities for processors.
Regulatory push toward cashless economies in Asia & Nordics
Open-banking rules, QR-code mandates, and interoperability requirements reduce reliance on cash and traditional card networks. The Philippines targets 50% digital retail transactions by 2027, underpinned by expanding real-time infrastructure. Nordic regulators promote account-to-account payments through open APIs, reinforcing the shift toward low-cost rails. Processors able to navigate complex compliance frameworks secure first-mover advantages and long-term contracts with banks and merchants.
Network tokenization boosting card-not-present authorization rates
Visa processed 10 billion tokenized payments in 2024, and Mastercard plans to tokenize 100% of European e-commerce transactions by 2030. Merchant authorization rates improve by 26% on average, while fraud liability declines. Tokenization also enables automatic credential updates, reducing involuntary subscription churn. Payment processors offering turnkey token services command premium pricing and create switching costs that fortify market share.
Restraints Impact Analysis of Payment Processing Solutions Market*
| Restraint | (~) % Impact on CAGR Forecast | Geographic Relevance | Impact Timeline |
|---|---|---|---|
| Interchange & Scheme-Fee Volatility Pressuring Margins | -2.1% | Global, with acute impact in North America & Europe | Short term (≤ 2 years) |
| Fragmented Regional Regulations Hindering Cross-Border Compliance | -1.8% | Global, particularly affecting multi-regional operators | Medium term (2-4 years) |
| High Cost of PCI-DSS & Fraud Mitigation for Small Acquirers | -1.3% | Global, with disproportionate impact on emerging markets | Long term (≥ 4 years) |
| Source: Mordor Intelligence | |||
Interchange & scheme-fee volatility pressuring margins
Visa and Mastercard fee adjustments added USD 502 million in annual merchant costs during 2024, and the UK Payment Systems Regulator estimates businesses pay GBP 250 million (USD 320 million) extra each year from unexplained increases. Processors operating on thin spreads either absorb the costs or pass them on, risking churn. Some respond by promoting lower-cost account-to-account routing, but such shifts demand investment in new rails and merchant education.
Fragmented regional regulations hindering cross-border compliance
Forthcoming PSD3 and PSR rules in Europe, divergent wallet mandates in Asia, and varying data-privacy regimes force processors to maintain multiple compliance stacks. Smaller providers encounter outsized legal and technical costs, creating barriers to entry and potential consolidation. Modular compliance architecture is a strategic response but requires continuous regulatory monitoring capabilities.
*Our forecasts treat driver/restraint impacts as directional, not additive. The impact forecasts reflect baseline growth, mix effects, and variable interactions.
Payment Processing Solutions Market Segment Analysis
By Payment Method:
Mobile wallets accelerate digital transformationCard-based payments maintained 44.45% of the payment processing solutions market share in 2025, supported by entrenched infrastructure and consumer familiarity. Meanwhile, mobile wallets are projected to register a 22.65% CAGR through 2031, propelled by super-app ecosystems and biometric authentication that streamline checkout. Asia-Pacific already sees digital wallets accounting for nearly 70% of e-commerce value. Tokenization blurs the boundaries between payment types, improving card authorization rates and enabling one-click wallet transactions. Processors equipped with token orchestration and biometric SDKs can serve both modalities seamlessly, reinforcing customer stickiness.
Network tokenization is forecast to double global volumes by 2029, enhancing security for all payment types. For merchants, the decision increasingly centers on reducing fraud and optimizing acceptance, not on the underlying form factor. Processors that combine network-level tokens with device-bound credentials offer differentiated risk management and reduce PCI scope, supporting higher approval rates and lower chargebacks.



By Deployment Mode:
Cloud infrastructure underpins scalabilityCloud deployments accounted for 57.85% of the payment processing solutions market in 2025 and are expanding at a 18.7% CAGR. Providers leverage elastic compute to handle seasonal peaks, roll out new payment methods rapidly, and integrate AI-driven fraud screening in real time. Real-time analytics dashboards give merchants transaction-level visibility, while automated compliance updates reduce manual overhead. Hybrid architectures are gaining traction among highly regulated merchants that store sensitive data on-premise while utilizing cloud APIs for routing and settlement.
On-premise installations persist where data-sovereignty laws or legacy POS systems demand local control, but their share continues to erode as regulators clarify cloud-security standards. Processors offering containerized micro-services can deploy identical codebases on cloud or edge locations, minimizing complexity and accelerating market entry across jurisdictions.
By Organization Size:
SMEs unlock the next growth waveLarge enterprises contributed 68.65% of the payment processing solutions market size in 2025, reflecting their sizeable transaction volumes and multi-currency needs. They negotiate lower per-transaction pricing yet demand premium modules such as dynamic routing, A/B testing for authorization, and consolidated treasury dashboards. Growth, however, is plateauing as most Fortune 500 merchants already run modern stacks.
SMEs represent the fastest-growing cohort with a 20.75% CAGR to 2031. Cloud and API-first models reduce onboarding from weeks to minutes, meeting SMEs’ appetite for simple yet powerful tools. Bundling payments with accounting or e-commerce software drives adoption, while value-added financing, such as cash-advance products tied to settlement flows, creates new revenue streams for processors.
By End-User Industry:
Healthcare outpaces traditional retailRetail and e-commerce retained the largest share at 41.25% in 2025, underpinned by omnichannel strategies that demand unified token vaults and inventory-linked settlement. Still, margin pressure from interchange fees pushes retailers to explore account-to-account options and loyalty-linked closed-loop wallets.
Healthcare is projected to grow at 21.95% CAGR through 2031, as providers digitize billing and automate insurance-payer reconciliation. CAQH data show that full automation could unlock USD 1.82 billion in annual savings for the sector, providing strong economic incentive for adoption. Processors catering to healthcare must navigate HIPAA compliance, patient financing, and split settlement between providers and insurers, creating defensible niches.
Geography Analysis
North America Payment Processing Solutions Market
North America controlled 35.80% of the payment processing solutions market in 2025, benefiting from high card penetration, large enterprise demand, and advanced fraud-mitigation technologies. Growth moderates as regulators scrutinize interchange fees and real-time account-to-account rails such as FedNow gain traction. Competitive differentiation hinges on AI-driven risk tools and value-added data services that justify premium pricing.
APAC Payment Processing Solutions Market
Asia-Pacific is forecast to contribute the highest incremental volume, advancing at 20.85% CAGR through 2031. Government-backed instant rails and mobile-first consumer behavior underpin expansion. India’s UPI and China’s wallet ecosystems provide case studies in scale, while Southeast Asian initiatives improve cross-border connectivity. Processors must offer local language SDKs, QR code interoperability, and real-time payout capabilities to capture share.
EMEA and LATAM Payment Processing Solutions Market
Europe maintains a sizeable position, aided by open-banking mandates and PSD3/PSR reforms that level the playing field. Account-to-account payment requests, strong customer authentication, and data-privacy directives create complexity that favors well-capitalized providers. Latin America experiences rapid wallet uptake and instant-payment adoption, exemplified by Brazil’s Pix, which processed 8.1 billion transactions in Q1 2023. Middle East and Africa markets remain nascent but show growth potential as financial-inclusion programs roll out national switches and encourage mobile-money use.

Regulatory Landscape
Payment processing solutions operate under overlapping regimes covering licensing, consumer protection, data privacy, AML/CTF controls, and security standards. In the European Union, the PSD3 and PSR package advanced in 2026, including a May 2026 European Parliament ECON committee compromise intended to reduce national variance through a directly applicable regulation. This raises the premium on harmonized compliance capabilities for multi-country acquirers, gateways, and orchestration platforms.
In the United Kingdom, HM Treasury opened a July 2026 consultation on modernising the payment services regulatory framework (covering themes such as Open Banking and tokenised payments). In the United States, the CFPB Personal Financial Data Rights rule (Section 1033), finalized in 2024, continues to shape open-data expectations for payment initiation and account-to-account experiences. A June 2026 OCC proposed rule to implement GENIUS Act standards for payment stablecoin issuers also expands the perimeter around digital-asset-linked payment flows, bringing additional BSA/AML requirements into scope.
Value Chain Analysis
The value chain spans merchants (online and in-store), payment facilitators/ISOs, gateways and orchestration layers, acquirers and processors, card networks (e.g., Visa and Mastercard) and alternative rails (real-time A2A schemes), issuer banks, and downstream settlement, reconciliation, and chargeback operations. Enabling layers include identity/KYC, fraud and risk engines, token vaults and network tokenization services, dispute management, and compliance tooling (PCI controls, AML screening, and data-protection governance). Cloud and API-first delivery has shortened integration cycles, but it also shifts more operational responsibility to platform providers for uptime, security monitoring, and continuous compliance updates.
Enterprise software and vertical platforms are becoming important distribution points, with payments embedded into ERPs, travel platforms, and commerce dashboards. J.P. Morgan Payments launched an integrated supply chain finance solution with Oracle in July 2025 (ERP-configured workflows), Sabre signed a strategic agreement with CellPoint Digital in April 2025 to integrate payment orchestration into SabreSonic and Radixx, and Juspay and Sabre partnered in December 2025 to integrate tokenisation with Sabre Direct Pay. These moves highlight the growing role of orchestration and tokenization layers between merchants and acquiring stacks, especially for multi-currency, multi-channel environments such as travel and cross-border commerce.
Competitive Landscape
The payment processing solutions market exhibits moderate concentration. Traditional processors respond to fintech entrants through acquisitions and platform consolidation. Global Payments’ USD 24.25 billion Worldpay deal enriched cross-border capabilities, while Shift4’s USD 2.5 billion Global Blue purchase added tax-free shopping and DCC services.[2]Reuters, “Global Payments to Buy Worldpay,” reuters.com Stripe processed USD 1.4 trillion in 2024 and achieved its first profitable year, underscoring the scaling power of developer-centric models.
Technology is the main battleground: machine-learning-based fraud detection, token orchestration, and payment-orchestration layers differentiate offerings. Patent filings on blockchain-based subscription platforms indicate continued innovation.[3]USPTO, “Subscription and Cryptocurrency Payment Management Platforms,” uspto.report Vertical specialization deepens, with healthcare, logistics, and hospitality demanding tailored workflows. Cryptocurrency and account-to-account innovators challenge incumbents but face regulatory and merchant-adoption hurdles.
Strategic alliances emerge between processors and software vendors to embed payments into sector-specific platforms, reducing merchant acquisition costs and increasing long-term retention. Market leaders invest heavily in compliance automation, ensuring rapid adaptation to evolving regulations across regions.
Payment Processing Solutions Industry Leaders
Mastercard Inc.
CCBill, LLC
PayPal Holdings Inc. (Braintree)
Square Inc. (Block)
Visa Inc.
- *Disclaimer: Major Players sorted in no particular order
Payment Processing Solutions Market Companies Covered in this Report
- Paysafe Group
- Mastercard Inc.
- Square Inc. (Block)
- CCBill LLC
- PayPal Holdings Inc. (Braintree)
- FIS (Worldpay)
- Visa Inc.
- Global Payments Inc.
- Fiserv (First Data)
- Worldline SA
- Stripe Inc.
- PayU Inc.
- Adyen NV
- Elavon Inc.
- Total System Services (TSYS)
- BluePay Processing LLC
- Klarna Bank AB
- Checkout.com
- Alipay (Ant Group)
- WePay (JPMorgan Chase)
- Amazon Pay
- Revolut Ltd.

Market Opportunities and Future Outlook
Opportunities are concentrating around always-on settlement, tokenization, and embedded distribution channels where processors can bundle acceptance with risk, treasury, and reconciliation. Real-time payment rails operating across many jurisdictions create whitespace for providers that can abstract local scheme differences into a single API while offering instant payouts and automated exception handling, especially for SMEs adopting integrated platforms. Network tokenization also remains an addressable expansion area given its demonstrated scale and security role. For example, Visa reported processing 10 billion tokenized payments in 2024, which supports demand for token orchestration, credential lifecycle management, and reduced PCI scope for merchants.
Cross-border processing and new settlement choices are widening the product surface area beyond traditional card flows. In 2026, major incumbents invested in interoperable infrastructures and tokenized money capabilities, including Visa announcing a 500 million euro investment in European payments infrastructure with a new Eurozone data center, Mastercard announcing an agreement to acquire BVNK to connect on-chain payments and fiat rails, and Citi enabling near real-time cross-border payments with Siam Commercial Bank going live on Citi 24/7 USD Clearing alongside Citi Token Services. These developments align with opportunities for multi-currency routing, 24/7 liquidity management, and compliant integration of stablecoin or tokenized deposit rails into existing merchant acceptance stacks, particularly where fragmented regional regulation increases the value of managed compliance and programmable controls.
Recent Industry Developments in Payment Processing Solutions Market
- July 2026: Mastercard announced Mastercard Wallet Services, enabling banks and fintechs to add contactless payment capabilities inside iOS and Android apps via SDKs connected to Mastercard Digital Enablement Service. The announcement strengthens the enablement layer around tokenized credentials and expands the addressable market for issuers and fintechs seeking faster time-to-market without building full in-house provisioning stacks.
- May 2026: BigCommerce and PayPal introduced BigCommerce Payments by PayPal for U.S. merchants, embedding payment acceptance, balance visibility, and payout management directly into the BigCommerce dashboard. This deepens the shift toward platform-native payments where distribution comes from commerce software, helping processors win merchants through integrated workflows rather than standalone gateway sales.
- April 2025: Global Payments announced an agreement to acquire Worldpay for USD 24.25 billion while divesting its Issuer Solutions unit to FIS for USD 13.5 billion. The transaction reshapes competitive dynamics by concentrating resources on merchant acquiring and cross-border capabilities, while accelerating consolidation among large-scale payment processors.


Payment Processing Solutions Market Report Scope and Research Methodology
Market Definition and Coverage
For this study, the market covers software and services that enable merchants and service providers to accept and process digital payments, from transaction capture through authorization, routing, clearing, and settlement, including related fraud and tokenization functions.
Scope exclusions: We exclude consumer lending products, pure banking core systems, and hardware-only point-of-sale devices when they are sold without processing software or related service revenue.
Segments Covered in This Report
- By Payment Method
- Card-based (Credit, Debit, Pre-paid)
- Mobile Wallets & E-wallets
- By Deployment Mode
- On-Premise
- Cloud
- By Organization Size
- Small & Medium Enterprises
- Large Enterprises
- By End-user Industry
- Retail & E-commerce
- Food Service & Hospitality
- Healthcare
- Transport & Logistics
- Media & Entertainment
- Other End-user Industries
- By Geography
- North America
- United States
- Canada
- Mexico
- Europe
- United Kingdom
- Germany
- France
- Italy
- Spain
- Rest of Europe
- Asia-Pacific
- China
- India
- Japan
- South Korea
- Rest of Asia-Pacific
- South America
- Brazil
- Argentina
- Rest of South America
- Middle East
- United Arab Emirates
- Saudi Arabia
- Rest of Middle East
- Africa
- South Africa
- Nigeria
- Rest of Africa
- North America
Data Sources, Market Sizing, and Validation
Desk Research
Desk research helped us set realistic boundaries and build the first demand pool for payment processing solutions. We relied on public, non-paywalled references such as central bank and regulator releases on payment volumes and fraud, BIS payments statistics, World Bank Global Findex indicators, and IMF exchange rate series to keep currency translation consistent.
To convert payment activity into revenue signals, we also reviewed company annual reports, investor presentations, and audited filings that describe take rates, mix shifts, and geographic exposure. Patent databases were used in a light way to check the pace of change around tokenization, routing, and authentication, which typically affects average pricing over time. These sources are not exhaustive, and we referred to additional public materials for data collection, validation, and research clarification.
Primary Interviews and Surveys
Primary work was used to sanity-check the desk model and close gaps where pricing and mix are not clearly published. We spoke with payment operations leaders, product owners, and sales managers across acquirers, processors, gateways, and merchant-facing solution providers. Feedback was balanced across APAC, EMEA, and the Americas to avoid anchoring on a single market rail or buyer type.
Distribution of primary research fieldwork respondents
| Company type | Respondent position | Region |
|---|---|---|
| Top tier: 38% | CXOs: 12% | APAC: 38% |
| Mid tier: 44% | Functional/Unit leaders: 40% | EMEA: 36% |
| Smaller Players: 18% | Managers: 48% | Americas: 26% |
Market-Sizing & Forecasting
Sizing starts from a top-down build where payment volume indicators are reconstructed by region, then converted into an addressable revenue pool using realistic take-rate ranges and solution attach assumptions. Once that total is formed, it is cross-checked with selective bottom-up approximations, such as sampled revenue disclosures, channel feedback on pricing, and a volume times average fee logic for key use cases.
A few practical inputs that guided the model include card versus wallet share shifts, cross-border transaction mix, fraud and chargeback intensity (which changes solution bundling), cloud adoption for processing stacks, and the rate of real-time payment rail usage where it affects routing and fee structures. When bottom-up inputs had gaps, ranges were built from comparable cohorts and then narrowed using interview feedback on what is typical in each region.
Forecasts were developed using scenario analysis supported by expert views on price compression, mix upgrades (like tokenization and orchestration add-ons), and currency movement impact on reported revenues. Assumptions are kept easy to re-run so updates can be applied without rebuilding the full model.
Data Validation & Update Cycle
Outputs are checked against independent signals, including reported payment volume trends, changes in take rates discussed in public filings, and step changes tied to regulation or major rail upgrades. If a region or end-use total looks inconsistent, the drivers are re-tested and respondents are re-contacted to confirm whether the variance is real or model-led.
Before sign-off, the model goes through multi-step analyst review, followed by anomaly checks across growth rates, implied pricing, and currency translation. Reports are refreshed annually, with interim updates when material events occur, and a final pre-delivery pass is done so clients receive the latest updated view.
Mordor Intelligence's Payment Processing Solutions Market Size Compared Against Other Published Estimates
Published market sizes for payment processing solutions often differ because each publisher refreshes inputs at different times and converts multi-currency revenues using different timing assumptions. The same market can also look larger or smaller depending on whether pricing is modeled as a flat average fee or adjusted for mix shifts like cross-border flows and value-added security services.
In our build, exchange-rate timing and fee progression were re-checked during the latest refresh, and transaction mix checks from interviews were used to keep implied ASPs realistic. This is one practical reason the total can diverge from older snapshots, including the figure shown by Mordor Intelligence.
Benchmark comparison
| Source | Market Size | Gaps in Research Methodology |
|---|---|---|
| Mordor Intelligence | USD 96.89 B (2026) | |
| Global Consultancy A | USD 88.40 B (2026) | Uses more conservative fee-rate assumptions and applies a single blended take rate across regions, which can understate revenue where cross-border and value-added security services are higher. |
| Industry Association B | USD 104.60 B (2026) | Leans on reported payment volumes and broad industry ratios, and may include adjacent payment services that sit outside pure processing software and service revenues, thereby lifting the total. |
The spread across the three figures is mainly explained by refresh timing, currency conversion choices, and how pricing is stepped up or held flat as payment mix changes. By keeping the model tied to payment activity signals and then validating implied fees with interview checks, the estimate stays traceable to repeatable inputs rather than one-off assumptions.


Key Questions Answered in the Report
What is the current size of the payment processing solutions market?
The market stands at USD 96.89 billion in 2026 and is projected to reach USD 221.16 billion by 2031.
Which region is growing the fastest?
Asia-Pacific is forecast to expand at a 20.85% CAGR during 2026-2031, driven by real-time rails and mobile-wallet adoption.
Which payment method is gaining the most traction?
Mobile wallets lead in growth with a 22.65% CAGR, reflecting super-app integration and biometric security.
Why are SMEs important for future growth?
SMEs are expected to grow at 20.75% CAGR because API-first, cloud-based platforms lower onboarding barriers and bundle payments with value-added services.
How will tokenization impact processors?
Network tokenization lifts authorization rates, reduces fraud, and creates switching costs, allowing processors to charge premium fees.
What are the key challenges facing processors?
Interchange fee volatility, fragmented regulations, and PCI-DSS 4.0 compliance costs pressure margins and drive industry consolidation.
Page last updated on:


 Your data is secure and never sold or shared.


