Cross Border Payments Market Size and Share
Market Overview
| Study Period | 2020 - 2031 |
|---|---|
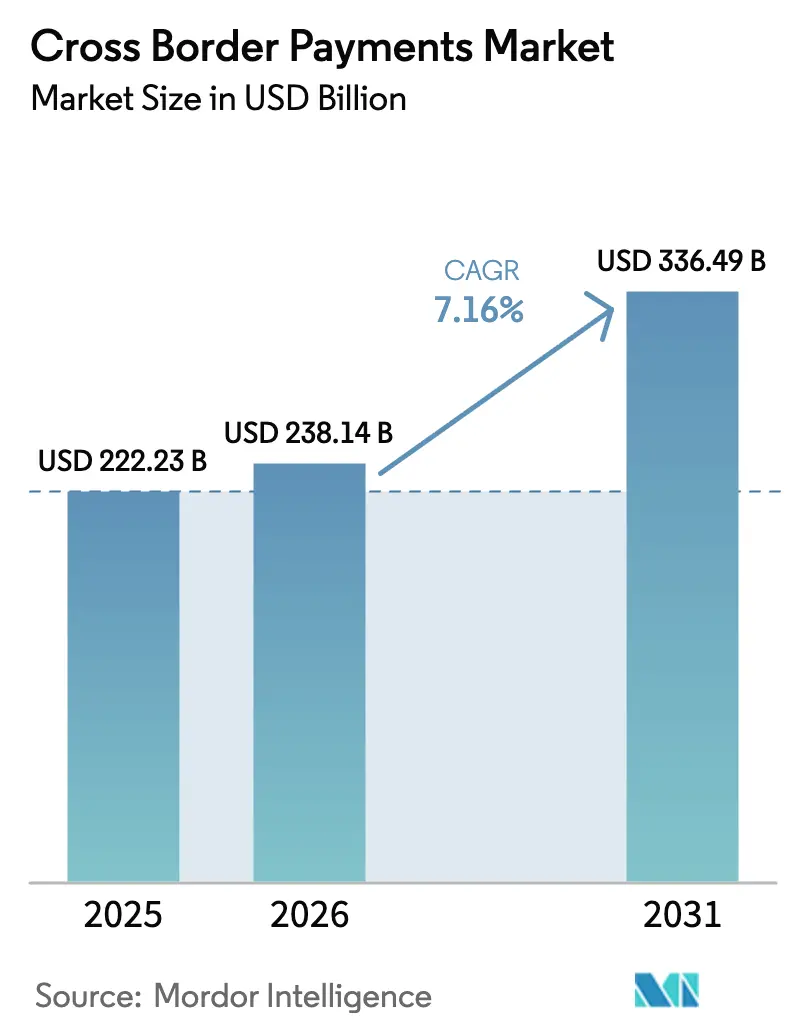
| Market Size (2026) | USD 238.14 Billion |
| Market Size (2031) | USD 336.49 Billion |
| Growth Rate (2026 - 2031) | 7.16% CAGR |
| Fastest Growing Market | Asia Pacific |
| Largest Market | North America |
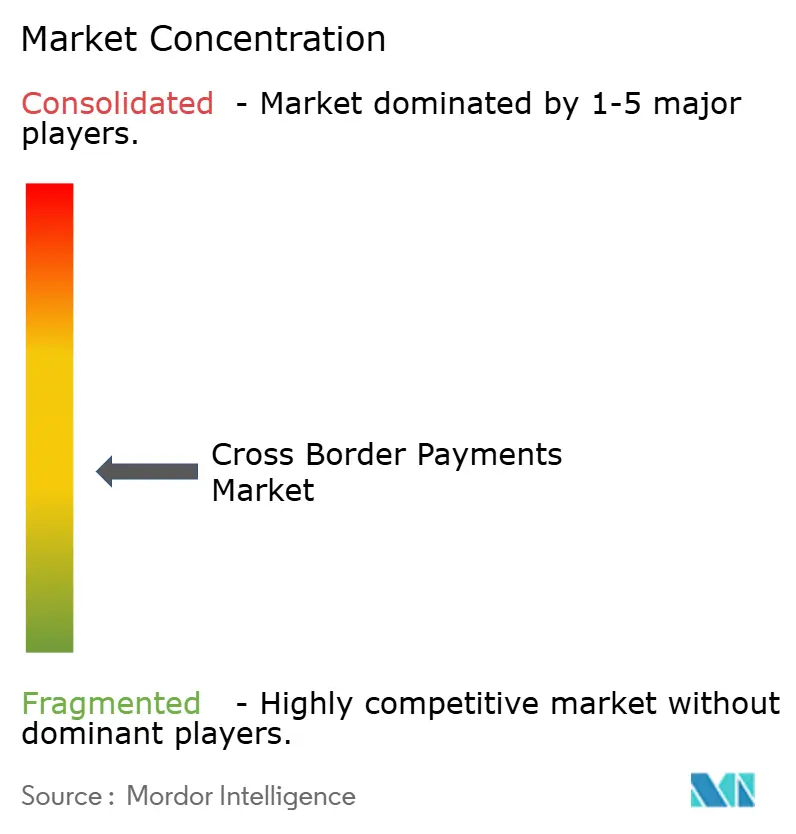
| Market Concentration | Medium |
Major Players*Disclaimer: Major Players sorted in no particular order Image © Mordor Intelligence. Reuse requires attribution under CC BY 4.0. | |
Cross Border Payments Market Analysis by Mordor Intelligence
The cross border payments market size is projected to be USD 222.23 billion in 2025, USD 238.14 billion in 2026, and reach USD 336.49 billion by 2031, growing at a CAGR of 7.16% from 2026 to 2031. Robust expansion reflects how instant-settlement rails, open-banking mandates, and embedded-finance orchestration layers dismantle correspondent-banking friction. Fintech challengers aggregate foreign-exchange (FX) liquidity across multiple venues, trimming spreads by up to 60 basis points on major corridors and pulling high-frequency flows away from banks. Real-time links such as UPI-PayNow and FedNow pilots compress settlement windows from several days to seconds, prompting corporates and consumers to migrate volume to instant channels. Regulatory de-risking by global banks, however, has thinned correspondent lines across 23 African nations, raising end-user fees on frontier routes and sustaining a two-speed pricing landscape that still offers arbitrage opportunities for liquidity aggregators.
Key Report Takeaways
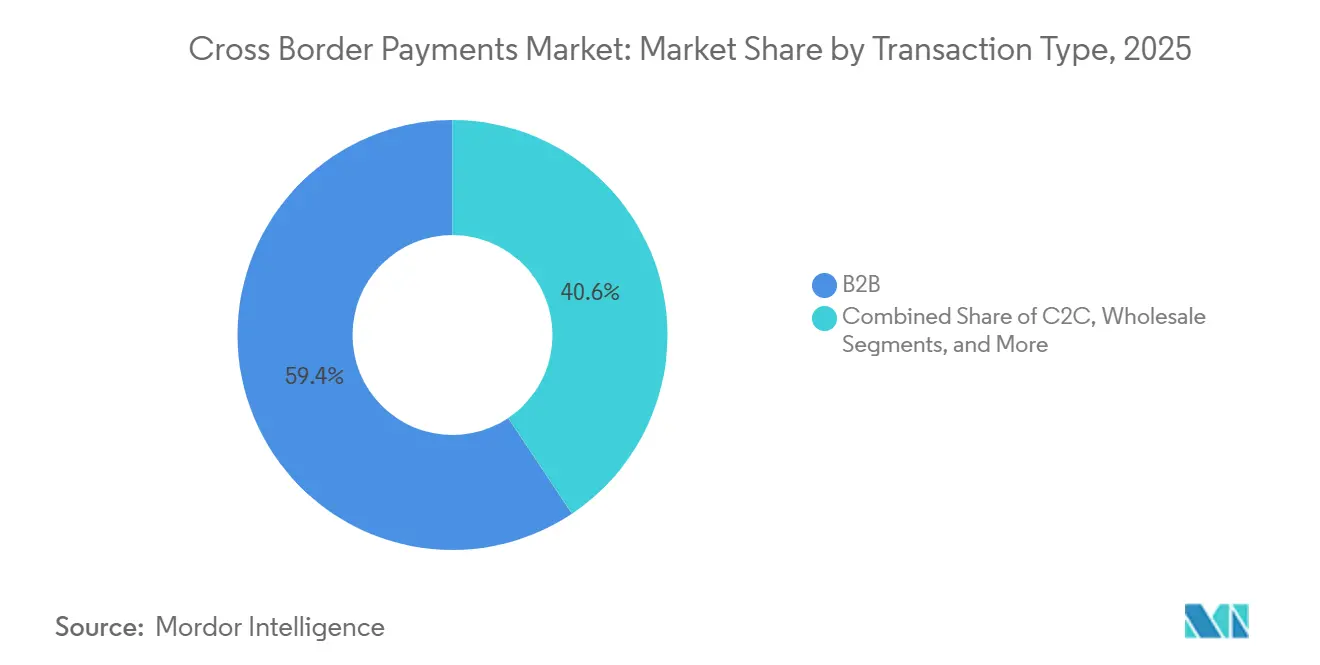
- By transaction type, business-to-business flows held 59.39% of the cross-border payments market share in 2025, while consumer-to-consumer remittances are forecast to expand at an 8.43% CAGR through 2031.
- By channel, bank transfers accounted for 44.67% of 2025 volume, whereas money transfer operators are advancing at a 7.83% CAGR through 2031.
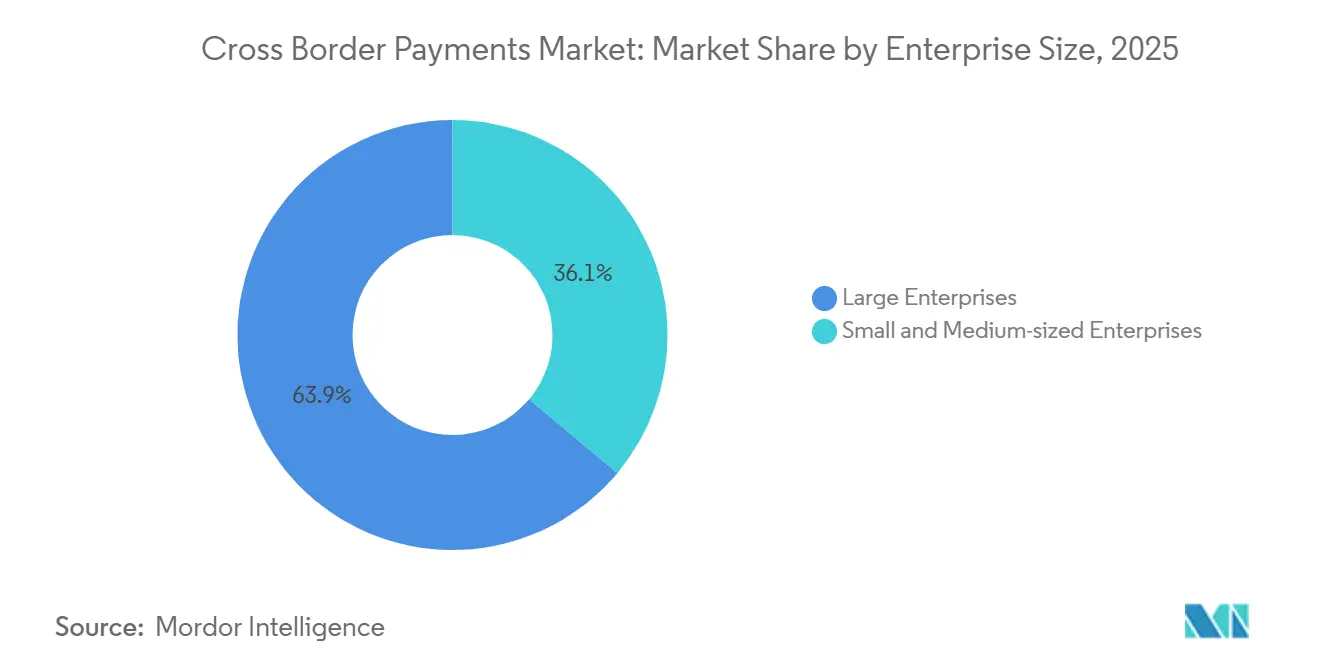
- By enterprise size, large enterprises commanded 63.92% of 2025 volume, yet small and medium-sized enterprises are projected to grow at 8.03% annually to 2031.
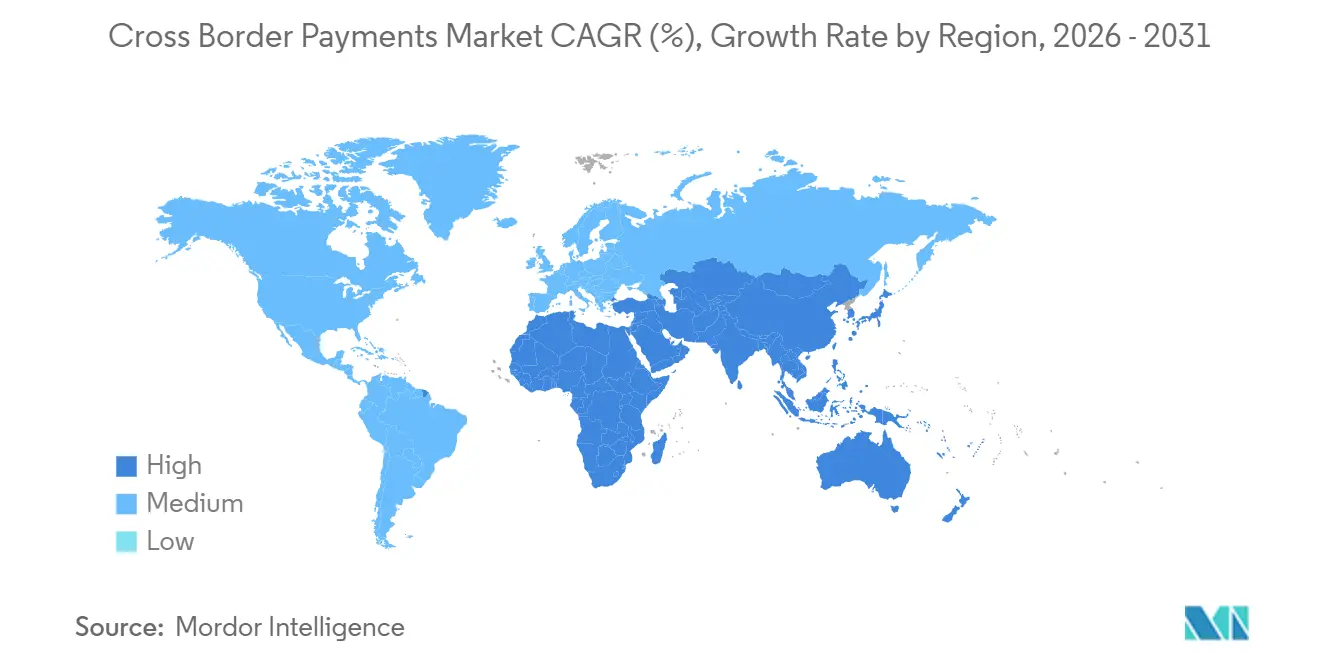
- By geography, North America led with 33.59% share in 2025, while Asia-Pacific is poised to rise at a 9.16% CAGR over the period.
- By end user, business enterprises contributed 62.59% of 2025 flows, and individual users are expected to climb at 7.64% per year to 2031.
Note: Market size and forecast figures in this report are generated using Mordor Intelligence’s proprietary estimation framework, updated with the latest available data and insights as of 2026.
Global Cross Border Payments Market Trends and Insights
Drivers Impact Analysis*
| Driver | (~) % Impact on CAGR Forecast | Geographic Relevance | Impact Timeline |
|---|---|---|---|
| Rising B2B E-Commerce Export Volumes in Asia | +1.2% | Asia-Pacific core, spill-over to North America and Europe | Medium term (2-4 years) |
| Growing Adoption of ISO 20022 Messaging Standards in EU Payment Hubs | +0.8% | Europe, spreading to North America and Asia-Pacific | Long term (≥ 4 years) |
| SWIFT gpi and Instant FX Windows Boosting Same-Day Settlement Demand | +0.9% | Global, strongest in North America, Europe, Asia-Pacific | Short term (≤ 2 years) |
| PSD3-Driven Open-Banking APIs Accelerating European Cross-Border P2P | +0.7% | Europe, early pilots in United Kingdom and selected Asia-Pacific markets | Medium term (2-4 years) |
| Integration of Request-to-Pay Rails with Cross-Border Networks in North America | +0.5% | North America, potential spill-over to South America | Medium term (2-4 years) |
| Embedded Finance Platforms Orchestrating Multi-Jurisdictional Payouts for SaaS Vendors | +0.6% | Global, led by North America and Europe | Short term (≤ 2 years) |
| Source: Mordor Intelligence | |||
Rising B2B E-Commerce Export Volumes in Asia
Cross-border B2B e-commerce exports from Asia reached USD 1.8 trillion in 2025 as digital platforms embedded payment orchestration directly into supply-chain workflows. Chinese manufacturers using Alibaba’s settlement rails processed 47% more international invoices than in 2024, while Indian exporters linked to unified payment interface portals cut receipt times from 14 days to 36 hours.[1]United Nations Conference on Trade and Development, “B2B E-Commerce in Asia 2025,” unctad.org Reserve Bank of India, “UPI Cross-Border Transactions Report 2025,” rbi.org.in Faster proceeds compress working-capital cycles for small enterprises that once waited up to 45 days for clearance. Vietnam, Thailand, and Indonesia recorded 22% year-over-year growth in 2025 volumes as regional free-trade pacts harmonized customs data with ISO 20022 messages. Instant invoice settlement now trims transaction costs by as much as 80 basis points, enabling exporters to price more competitively and displace incumbents reliant on letters of credit.
Growing Adoption of ISO 20022 Messaging Standards in EU Payment Hubs
The European Central Bank required ISO 20022 compliance for all TARGET transactions by November 2025, obliging banks to transmit richer remittance data. SWIFT reports that 78% of European correspondents completed migration by December 2025, up from 41% mid-2024. Structured data fields slash payment rejections by 35% and remove manual reconciliation that once added a full day to settlement. Interoperability between SEPA Instant Credit Transfer and cross-border networks is expected to bring end-to-end settlement to under 60 seconds by 2027, reshaping liquidity management for multinational treasurers.
SWIFT gpi and Instant FX Windows Boosting Same-Day Settlement Demand
SWIFT gpi processed 85 million cross-border payments in 2025, with 63% crediting within 30 minutes. Instant FX windows convert currency at initiation rather than at each correspondent hop, trimming spreads by up to 40 basis points on United States dollar-euro and United States dollar-pound corridors. Corporates now require same-day value to optimize working capital, and banks unable to meet this standard have forfeited up to 20% of their payment revenue to fintech rivals. The urgency is even sharper in Asia-Pacific, where exporters need immediate confirmation to release goods from bonded warehouses.
PSD3-Driven Open-Banking APIs Accelerating European Cross-Border P2P
The European Commission finalized PSD3 in March 2025, extending open-banking mandates to cross-border P2P payments.[2]European Commission, “Payment Services Directive 3 Implementation,” ec.europa.eu Revolut and Wise integrated the new APIs to price FX below 20 basis points, undercutting banks by up to 80%. Strong customer authentication lowered fraud on cross-border P2P by 42% in the first six months, boosting user confidence. Open-banking penetration reached 38% of European retail customers in 2025, signaling permanent migration away from correspondent rails.
Restraints Impact Analysis*
| Restraints | Impact on CAGR | Geographic Relevance | Peak Impact |
|---|---|---|---|
| De-Risking by Global Banks Cutting Correspondent Lines in Africa | -0.6% | Africa, secondary effects in Middle East and South America | Long term (≥ 4 years) |
| Persistently High FX Mark-Ups on Exotic Currency Corridors | -0.5% | Africa, South America, select Asia-Pacific and Middle East | Medium term (2-4 years) |
| Data-Residency Rules Limiting Cloud Deployment in MENA | -0.3% | Middle East and North Africa | Medium term (2-4 years) |
| Rising Regulatory Scrutiny of Crypto-Based Remittance Channels in G20 Economies | -0.4% | Global, strictest in North America, Europe, select Asia-Pacific | Short term (≤ 2 years) |
| Source: Mordor Intelligence | |||
De-Risking by Global Banks Cutting Correspondent Lines in Africa
Global banks terminated relationships with 127 African institutions during 2024-2025, citing compliance costs and reputational risk. Remittance providers in Nigeria, Kenya, and Ghana now reroute transfers through hubs in the United Arab Emirates and South Africa, adding up to 48 hours and USD 12 to a USD 200 transaction.[3]World Bank, “Remittance Prices Worldwide Report Q4 2025,” worldbank.org Volume shrinkage pushes per-payment compliance costs higher, prompting further exits and deepening exclusion. Pilot alternatives, such as the Pan-African Payment and Settlement System, moved less than USD 2 billion in 2025 because limited central-bank participation stifled liquidity AFDB.ORG. Until regulatory regimes converge, frontier corridors will remain costly and slow.
Persistently High FX Mark-Ups on Exotic Currency Corridors
Average FX mark-ups on African, South American, and select Asian currencies stood at 4.8% in 2025, triple spreads on major pairs. Fragmented liquidity widens bid-ask spreads by up to 300 basis points during volatility, eroding the digital-channel advantage over informal networks. Providers must warehouse larger currency buffers, tying up capital. Blockchain pilots that pool liquidity are limited to sub-USD 500 million monthly volumes because of reserve-asset uncertainty. Without transparent reference rates and deeper interbank markets, exotic-corridor mark-ups will continue to weigh on remittance growth.
*Our forecasts treat driver/restraint impacts as directional, not additive. The impact forecasts reflect baseline growth, mix effects, and variable interactions.
Segment Analysis
By Transaction Type: B2B Dominance Masks Rapid C2C Upswing
Business-to-business transactions held 59.39% of the 2025 volume, anchoring the cross-border payments market size for transaction-type flows. Embedded finance inside enterprise resource planning systems automates hedge execution and payment routing, cutting treasury overhead by as much as 40%. Consumer-to-consumer remittances, though smaller, are forecast to grow 8.43% annually, propelled by mobile-first operators that bypass correspondent banks and compress FX spreads below 50 basis points. High-frequency interbank settlements and government aid disbursements comprise the remaining share, sensitive to reserve-currency diversification policies.
C2C momentum reflects diaspora adoption of digital wallets that replace cash pickup with instant wallet-to-wallet transfers. Corridors such as United States-Mexico and Saudi Arabia-Philippines processed 34% more C2C payments in 2025, aided by sandbox regimes that let fintechs hold customer funds. B2B flows still benefit from Asia-Pacific free-trade rules requiring electronic payment confirmation before customs release, ensuring that the segment’s share erodes only gradually.


By Channel: Bank Stronghold Faces Money-Transfer Operator Disruption
Bank transfers retained 44.67% share in 2025, underpinning the cross border payments market size by channel because corporates value settlement finality and regulatory clarity. Money transfer operators are expanding at a 7.83% CAGR, leveraging ISO 20022 request-to-pay messages to bring settlement under 60 seconds. Card networks occupy a strategic niche as Visa Direct and Mastercard Move enable gig-platform payouts within minutes. Blockchain rails, mobile-money links, and cash networks represent the residual mix, with East-West Africa mobile-money schemes clearing USD 8 billion in 2025.
Liquidity-aggregation engines help MTOs quote transparent all-in pricing, speeding small-enterprise migration from banks to save up to 80 basis points. Banks maintain an edge on high-value corridors where regulatory scrutiny is highest, yet fee compression is pushing them to adopt instant-payment architecture to stay relevant.
By Enterprise Size: Large-Firm Scale Meets SME Agility
Large companies generated 63.92% of the 2025 volume, dominating the cross-border payments market share for enterprise-size flows. They marshal dedicated treasury teams and multi-bank relationships to secure tight FX pricing. Small and medium-sized enterprises, however, are projected to expand at 8.03% annually to 2031 as embedded finance layers inside accounting, checkout, and invoicing software eliminate the need for specialist expertise APIs offering multi-currency accounts in 40-plus currencies, democratize global sales for software-as-a-service exporters.
SMEs in Southeast Asia and Eastern Europe saw settlement times fall from a week to under 24 hours in 2025, thanks to instant-FX orchestration, improving cash-flow predictability. Large enterprises will keep volumetric primacy because of complex supply-chain settlements and transfer-pricing compliance, yet SME acceleration signals a structural broadening of the customer base.
By End User: Enterprise Volume Leads, but Consumer Momentum Builds
Business enterprises accounted for 62.59% of 2025 flows, anchoring the cross-border payments market size across end users with payroll, supplier, and royalty settlements. Individual users are projected to grow 7.64% per year as regulators license non-bank fintechs to hold deposits and facilitate wallet-to-wallet remittances. Government entities, including multilateral lenders, represent the balance, increasingly turning to blockchain platforms for transparency. Consumer-side elasticity is high; a 20-basis-point price advantage triggers provider switching. Licensing reforms in the Philippines and India unlocked instant deposit to mobile wallets, cutting costs by up to 50%.
Businesses, meanwhile, love embedded finance platforms that auto-hedge and route payments, sustaining their volume leadership even as consumer growth quickens. Business enterprises held 62.92% of all flows in 2025, spanning industries from electronics to professional services. CFOs are upgrading ERP integrations to feed payment data directly into real-time dashboards, improving cash positions and compliance triggers. The cross border payments market size for business users is tracking a mid-single-digit CAGR supported by global supply-chain diversification. Individual consumers form the highest-growth end-user cohort at 7.67% CAGR. Migrant labour, cross-border freelancers and digital nomads value instant wallet-to-wallet payouts denominated in USD stablecoins or local e-money. Providers that embed pay-out optionality, card, bank or wallet, win stickiness. Governments adopt the same rails for conditional cash transfers, broadening usage beyond pure remittance cases.
Geography Analysis
North America retained 33.59% of cross border payments market share in 2025, buoyed by FedNow and RTP integrations that enable same-day payroll and supplier settlement. The Federal Reserve’s service processed more than 200 million instant payments in 2025, with pilot corridors linking Canadian and Mexican systems. Stripe and Adyen each reported 28% year-over-year growth in United States-origin B2B cross-border flows. Canada’s Real-Time Rail went live in 2026, extending instant links to United States clearinghouses, while Mexico’s CoDi accepted inbound remittances that land in under 60 seconds.
Asia-Pacific is projected to grow at 9.16% CAGR, the fastest regional pace for the cross border payments market. The PayNow-UPI bridge moved USD 1.2 billion in 2025 transactions, and PromptPay-PayNow plus DuitNow connections created a seamless Southeast Asian corridor processing 47 million transfers. China’s Cross-Border Interbank Payment System handled USD 96 trillion in 2025, up 24% from 2024, showing sizeable momentum in renminbi-denominated trade settlement. India recorded 18.4 billion UPI cross-border transactions in fiscal 2025, reflecting diaspora inflows that bypass correspondent banks.
Europe leverages PSD3-driven open-banking APIs and the TARGET Instant Payment Settlement system, which cleared EUR 1.8 trillion (USD 2.0 trillion) in 2025, with cross-border volume at 31%. Middle East corridors from the Gulf Cooperation Council to South Asia processed USD 142 billion in remittances, aided by the United Arab Emirates Instant Payment Platform. Africa’s growth lags because correspondent-line withdrawals inflate fees by up to 12%, though pilot regional schemes seek to reverse the trend. South America benefits from Brazil’s Pix, which moved BRL 4.9 trillion (USD 980 billion) in 2025, and upcoming links to Argentina and Uruguay promise further expansion.

Competitive Landscape
The cross border payments market is moderately fragmented; the top 10 providers controlled roughly 48% of 2025 volume. Incumbents such as SWIFT, Visa, and Mastercard capitalize on network effects and regulatory familiarity to retain corporate and interbank flows. Yet fintech disruptors, Wise, Revolut, Stripe, are capturing 15-20% annual share gains in retail and SME segments through transparent all-in pricing that undercuts bank FX spreads by as much as 80%. Strategic focus centers on API orchestration that aggregates liquidity from several FX venues and instant rails, minimizing latency.
Stripe’s USD 1.1 billion purchase of stablecoin firm Bridge signals industry appetite for blockchain rails capable of parallel settlement. Ripple’s On-Demand Liquidity, using XRP as a bridge asset, processed USD 15 billion in 2025, proving blockchain can scale for low-value remittances. Compliance rigor remains a differentiator: platforms meeting Financial Action Task Force travel-rule requirements gain access to institutional liquidity pools barred to less-regulated actors.
Competition is fiercest in consumer remittance corridors such as the United States-Mexico and the United Kingdom-India, where margins have compressed to under 50 basis points. Providers pursue volume scale or vertical integration into adjacent offerings like hedging tools and multi-currency accounts. Exotic-currency corridors still yield 5-8% all-in fees, attracting new entrants that can aggregate fragmented liquidity and offer fixed-rate guarantees for underserved lanes.
Cross Border Payments Industry Leaders
Adyen N.V.
Stripe, Inc.
PayPal Holdings, Inc.
American Express Company
Payoneer Global Inc.
- *Disclaimer: Major Players sorted in no particular order

Recent Industry Developments
- January 2026: Visa expanded its Visa Direct cross-border push-to-card service to 47 additional countries, enabling gig-platform payouts within 30 minutes of initiation.
- December 2025: Mastercard acquired the remaining stake in Currencycloud for USD 1.2 billion, folding multi-currency accounts into Mastercard Move.
- November 2025: Wise launched an infrastructure-as-a-service product that lets banks white-label its FX engine and instant rails, onboarding 12 European challenger banks.
- October 2025: JPMorgan Chase scaled its Liink blockchain network to 427 institutions across 78 countries, processing USD 2.4 billion in Q4 2025 cross-border value.


Global Cross Border Payments Market Report Scope
The Cross Border Payments Market Report is Segmented by Transaction Type (B2B, C2C, Wholesale, Other Transaction Types), Channel (Bank Transfers, Cards, Money Transfer Operators, Other Channels), Enterprise Size (Small and Medium-sized Enterprises, Large Enterprises), End-User (Business Enterprises, Individuals and Consumers, Government), and Geography (North America, Europe, Asia-Pacific, Middle East, Africa, South America). The Market Forecasts are Provided in Terms of Value (USD).
| B2B |
| C2C |
| Wholesale |
| Other Transaction Types |
| Bank Transfers (SWIFT, ACH, RTP) |
| Cards |
| Money Transfer Operators |
| Other Channels |
| Small and Medium-sized Enterprises |
| Large Enterprises |
| Business Enterprises |
| Individuals / Consumers |
| Government |
| North America |
| Europe |
| Asia-Pacific |
| Middle East |
| Africa |
| South America |
| By Transaction Type | B2B |
| C2C | |
| Wholesale | |
| Other Transaction Types | |
| By Channel | Bank Transfers (SWIFT, ACH, RTP) |
| Cards | |
| Money Transfer Operators | |
| Other Channels | |
| By Enterprise Size | Small and Medium-sized Enterprises |
| Large Enterprises | |
| By End-User | Business Enterprises |
| Individuals / Consumers | |
| Government | |
| By Geography | North America |
| Europe | |
| Asia-Pacific | |
| Middle East | |
| Africa | |
| South America |


Key Questions Answered in the Report
What is the current value of the cross border payments market?
It stood at USD 238.14 billion in 2026 and is on track to reach USD 336.49 billion by 2031.
Which segment is growing fastest within cross-border payment flows?
Consumer-to-consumer remittances are forecast to rise at an 8.43% CAGR through 2031.
Why are money transfer operators gaining share against banks?
They combine instant FX windows with ISO 20022 messaging, cutting settlement times to under a minute and lowering spreads by up to 60 basis points.
Which region leads growth over the forecast period?
Asia-Pacific is projected to register a 9.16% CAGR, the highest among all regions, due to real-time payment linkages that bypass correspondent banks.
How fragmented is the provider landscape?
The top 10 players hold about 48% of transaction volume, indicating moderate fragmentation and room for new entrants with specialized liquidity solutions.
Page last updated on:


