Market Overview
| Study Period | 2020 - 2031 |
|---|---|
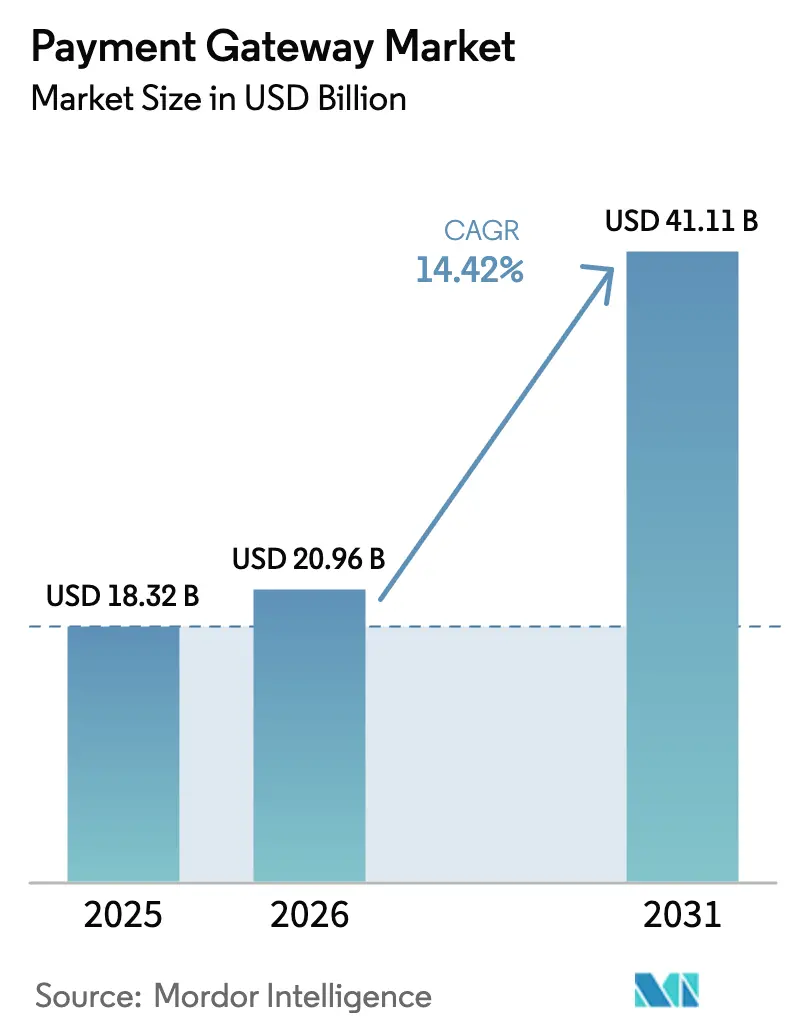
| Market Size (2026) | USD 20.96 Billion |
| Market Size (2031) | USD 41.11 Billion |
| Growth Rate (2026 - 2031) | 14.42% CAGR |
| Fastest Growing Market | Middle East |
| Largest Market | Asia Pacific |
| Market Concentration | Medium |
Major Players*Disclaimer: Major Players sorted in no particular order Image © Mordor Intelligence. Reuse requires attribution under CC BY 4.0. | |
Payment Gateway Market Analysis by Mordor Intelligence
The Payment Gateway Market size was valued at USD 18.32 billion in 2025 and is estimated to grow from USD 20.96 billion in 2026 to reach USD 41.11 billion by 2031, at a CAGR of 14.42% during the forecast period (2026-2031). The growth trajectory reflects rapid expansion of real-time payment rails, stricter strong-customer-authentication mandates, and a surge in buy-now-pay-later (BNPL) flows that multiply API calls and deepen gateway engagement. Hosted architectures remain dominant, but self-hosted deployments are accelerating as enterprises seek tighter control over token vaults and routing logic. Small and medium enterprises (SMEs) continue to drive volume thanks to low-code integrations and subscription pricing, while mobile in-app checkouts rise on the back of super-apps embedding software development kits directly into ride-hailing and food-delivery journeys. Regionally, Asia Pacific retains the largest share, yet the Middle East is set to deliver the fastest growth on the strength of cashless-commerce mandates and a central bank digital currency (CBDC) pilot.
Key Report Takeaways
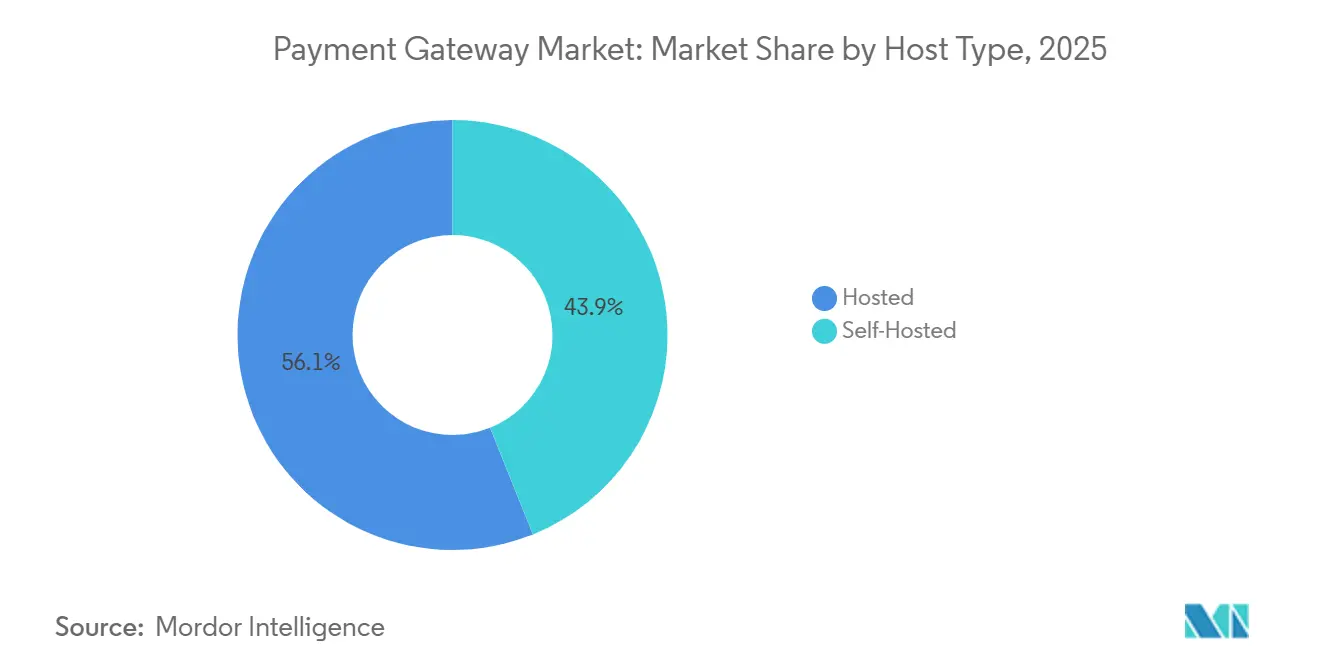
- By host type, hosted gateways captured 56.66% of 2025 revenue while self-hosted solutions are forecast to expand at a 16.46% CAGR through 2031.
- By enterprise size, SMEs led with 65.62% of 2025 volume, whereas large enterprises are poised for a 15.82% CAGR to 2031.
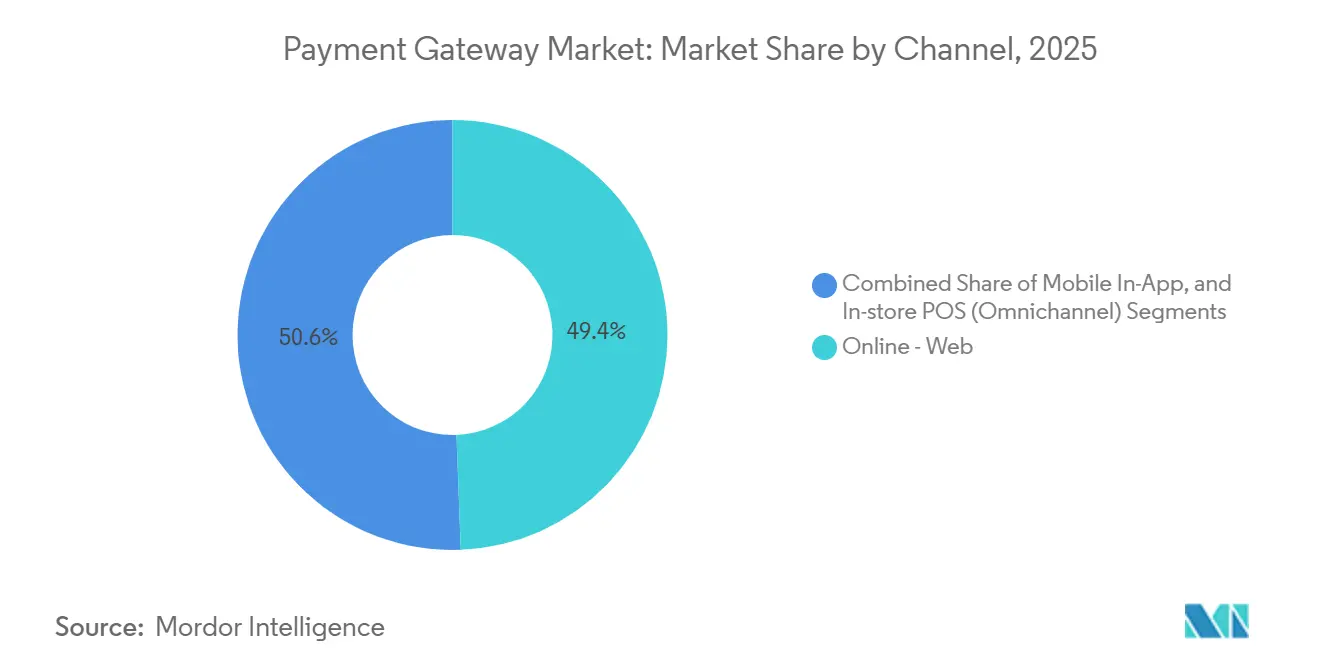
- By channel, online web accounted for 98.38% share in 2025, but mobile in-app payments are advancing at a 15.76% CAGR.
- By end-user industry, retail and e-commerce held 31.52% of 2025 demand, and travel and hospitality is projected to record the fastest 14.68% CAGR.
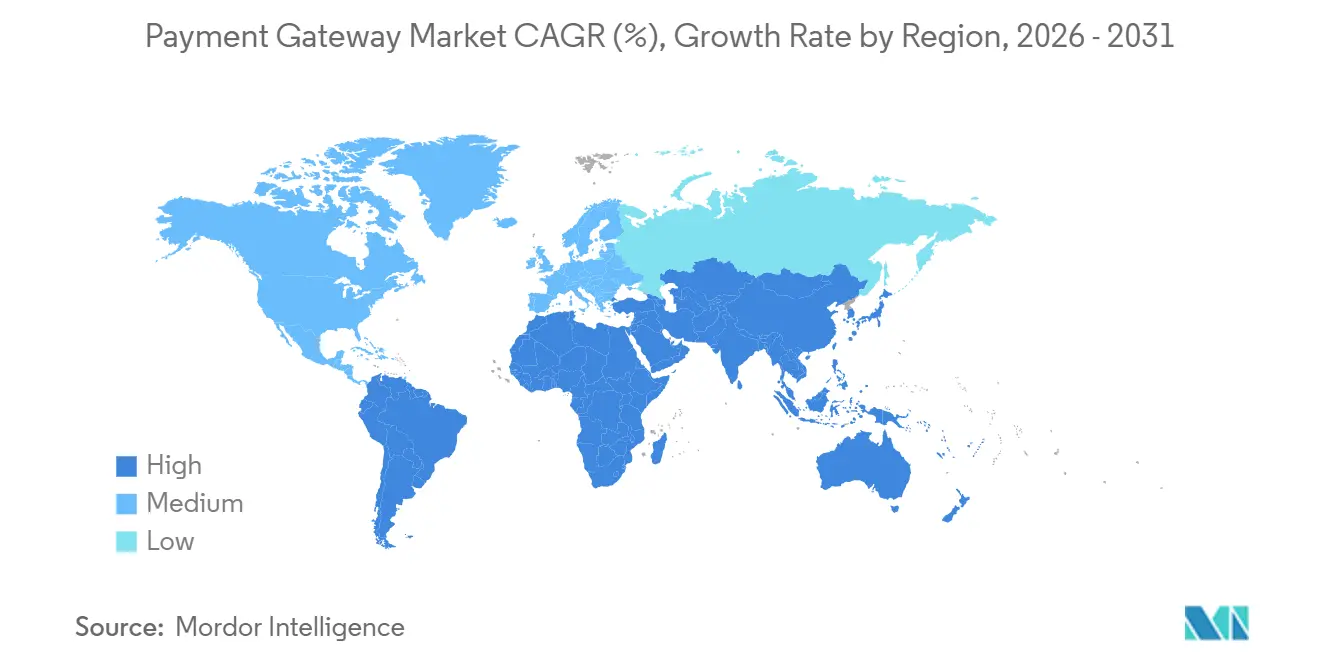
- By geography, Asia Pacific retained 39.74% of global revenue in 2025, while the Middle East is projected to post a 16.79% CAGR through 2031.
Note: Market size and forecast figures in this report are generated using Mordor Intelligence’s proprietary estimation framework, updated with the latest available data and insights as of January 2026.
Market Trends and Insights
Drivers Impact Analysis of Payment Gateway Market*
| Driver | (~) % Impact on CAGR Forecast | Geographic Relevance | Impact Timeline |
|---|---|---|---|
| Explosion of real-time payment rails | +2.8% | Asia Pacific core, spillover to Middle East and Africa | Medium term (2-4 years) |
| Cross-border e-commerce growth | +2.1% | Europe and North America, expanding to South America | Medium term (2-4 years) |
| PSD2-SCA and similar mandates | +1.9% | Europe, with adoption spreading to the United Kingdom | Short term (≤2 years) |
| Surge in BNPL checkout options | +2.3% | Global, led by North America and Europe | Short term (≤2 years) |
| Contactless-wallet boom in grocery chains | +1.7% | Asia Pacific and Middle East, emerging in North America | Medium term (2-4 years) |
| AI-powered dynamic risk scoring | +1.5% | Global, with early uptake in North America and Europe | Long term (≥4 years) |
| Source: Mordor Intelligence | |||
Explosion of Real-Time Payment Rails Accelerating Gateway Adoption in Asia Pacific
India’s Unified Payments Interface processed 131 billion transactions in 2024, up 58% year on year, while Thailand’s PromptPay surpassed 56 million registered users by mid-2025. These instant-settlement networks cut per-transaction costs by 40-60 basis points and deliver real-time settlement, boosting merchant liquidity. Singapore’s PayNow Corporate broadened the scope to business-to-business invoices, encouraging suppliers to forego trade-credit lines.[1]Monetary Authority of Singapore, “PayNow Corporate Launch,” mas.gov.sg Gateways that integrate these rails achieve a pricing edge over card-centric rivals, a trend now spreading to Saudi Arabia’s Mada and Nigeria’s Instant Payment system.
Cross-Border E-Commerce Growth Driving Demand for Multi-Currency Routing Among European SMEs
European SMEs booked EUR 89 billion (USD 95 billion) in cross-border online sales in 2024, a 19% jump from 2023, yet 42% of merchants cited currency-conversion friction as a growth barrier.[2]European Commission, “Cross-Border E-Commerce Report 2024,” ec.europa.eu Gateways offering dynamic currency conversion and intelligent acquirer routing shrink foreign-exchange markups to below 1.5%, saving merchants substantial margin. Stripe’s multi-currency settlement attracted 18,000 European SMEs in 2024, while Adyen’s machine-learning engine lifted authorization by 2.4 percentage points on cross-border flows. The European Union’s Digital Services Act now enforces transparent fee disclosure, intensifying demand for cost-efficient payment rails.
Regulatory Mandates such as PSD2-SCA Forcing Upgrades to Tokenized 3-DS-Ready Gateways
The European Banking Authority’s stronger-authentication rules, fully effective since March 2024, require two-factor verification on most online card payments. Legacy 3-D Secure 1.0 added friction and inflated cart abandonment, pressing gateways to migrate to version 2.2 with biometric support. Worldline upgraded 340,000 terminals across France and Germany, cutting authentication time to four seconds and reducing abandonment by seven points. Tokenization is now a baseline requirement, and the Payment Card Industry Security Standards Council has updated guidelines to include quantum-resistant algorithms.
Surge in BNPL Checkout Options Expanding API Calls Per Transaction
Global BNPL volume hit USD 294 billion in 2024, up 23% over 2023. Each installment purchase generates three to five gateway API calls versus a single call for card payments, inflating traffic and necessitating edge-computing architectures to hold latency below 200 milliseconds on AWS. Stripe’s BNPL aggregator elevates conversion by 9% by routing to the provider with the highest approval likelihood. Regulatory scrutiny is rising in the United Kingdom. Affordability checks for BNPL loans above GBP 100 (USD 127) could lift API volumes by another 15%.
Restraints Impact Analysis of Payment Gateway Market*
| Restraint | (~) % Impact on CAGR Forecast | Geographic Relevance | Impact Timeline |
|---|---|---|---|
| Rising scheme fees squeezing margins | -1.4% | Global, most acute in North America and Europe | Short term (≤2 years) |
| Persistent cross-border chargeback fraud | -1.1% | Global, concentrated in cross-border corridors | Medium term (2-4 years) |
| Data-localization laws complicating vaults | -0.9% | India, Brazil, Russia, potential expansion to Southeast Asia | Medium term (2-4 years) |
| Limited IPv6 adoption affecting low latency | -0.5% | Global, legacy infrastructure in North America and Europe | Long term (≥4 years) |
| Source: Mordor Intelligence | |||
Rising Scheme Fees Squeezing Gateway Margins for Micro-Transactions
Visa and Mastercard lifted interchange fees by an average of eight basis points in April 2024, raising the all-in processing cost of a USD 5 purchase above 4.2%. Digital goods merchants face the steepest squeeze, and gateway providers have absorbed up to half of the fee increase to curb churn. PayPal reported a 140-basis-point contraction in its transaction margin, with scheme-fee inflation accounting for 60 basis points. Real-time account-to-account transfers offer cost relief but remain fragmented in Europe and North America.
Persistent Cross-Border Chargeback Fraud Undermining Merchant Trust
Chargebacks climbed to 1.47% of cross-border volume in 2024, with friendly fraud responsible for nearly two-thirds of disputes. Machine-learning risk models have reduced exposure, yet false positives still block legitimate buyers at an 8% rate, dampening conversion. Mastercard’s 2024 rule change shortened the merchant response window to 30 days, piling administrative burden on SMEs. Harmonized global standards remain elusive, prolonging settlement friction.
*Our forecasts treat driver/restraint impacts as directional, not additive. The impact forecasts reflect baseline growth, mix effects, and variable interactions.
Payment Gateway Market Segment Analysis
By Host Type:
Enterprises Gravitate Toward Control in Self-Hosted DeploymentsSelf-hosted gateways are projected to expand at a 16.46% CAGR from 2026 to 2031, comfortably outpacing the overall payment gateway market growth. Larger merchants tolerate the annual USD 50,000-150,000 PCI DSS Level 1 certification cost because direct access to tokenization logic trims overselling by 14% and supports deeper enterprise resource planning integrations. Hosted solutions, which held 56.66% payment gateway market share in 2025, remain compelling for fast deployment and bundled compliance but their black-box nature restricts bespoke fraud-filter tuning.
Hybrid models are narrowing the divide. Stripe Elements presents a hosted checkout front end but transmits tokens to the merchant’s back end, balancing ease of integration with data ownership. Financial-services firms favor this architecture because Basel III capital rules penalize reliance on external processors. Worldpay’s white-label gateway software development kit lets banks embed acceptance inside their consumer apps, driving a 22% lift in in-app volumes during European pilots.


By Enterprise Size:
SMEs Provide Volume While Large Corporates Accelerate SpendSMEs accounted for 65.62% of 2025 activity in the payment gateway market, buoyed by no-code tools and pay-as-you-grow contracts that remove upfront software fees. Large enterprises, however, are set to grow at a 15.82% CAGR through 2031, expanding the payment gateway market size by layering orchestration and treasury services onto existing flows. Stripe’s enterprise bundle averages USD 420,000 in annual contract value versus USD 8,000 for SMEs, underscoring the revenue potential.
Orchestration tools are top of mind. Checkout.com’s Flow routes traffic across gateways and acquirers to cut processing costs 18% and improve approval ratios. SMEs, constrained by technical bandwidth, lean toward all-in-one dashboards; Square attracted 340,000 new North American merchants in 2024 after merging BNPL and loyalty modules into a single portal. Security certifications such as SOC 2 Type II remain a differentiator in the high-end segment, screening out smaller providers.
By Channel:
Mobile In-App Transactions Race Ahead Inside Super-AppsMobile in-app payments are forecast to rise at a 15.76% CAGR to 2031, the fastest channel within the payment gateway market. Web checkouts dominated with 98.38% volume in 2025, yet their growth is flattening as desktop commerce steadies in advanced economies. The in-app curve is steeper because ride-hailing and food-delivery platforms embed payment software development kits that route directly to the gateway. Stripe’s mobile software development kit slashed integration time from six weeks to eight days, leading to 4.2 million downloads in 2024.
The convergence of channels is accelerating omnichannel strategies. Apple’s Tap to Pay on iPhone enables contactless acceptance without dedicated hardware and has been adopted by 89,000 U.S. retailers. Adyen’s Unified Commerce platform reconciles store, web, and app transactions in a single ledger, lowering back-office overhead by 34% for omnichannel merchants. Tap-to-phone pilots in grocery chains demonstrate that physical and digital rails are fusing into a holistic payment gateway market proposition.

By End-User Industry:
Travel and Hospitality Embrace Dynamic Currency ConversionRetail and e-commerce retained the largest slice of the payment gateway market size at 31.52% in 2025, but travel and hospitality is poised to be the fastest growing vertical with a 14.68% CAGR through 2031. Airlines and hotel groups are ditching legacy processors for application-programming-interface-first gateways that support split settlement and real-time currency conversion. Amadeus integrated Stripe to add installment plans on high-value itineraries and saw an 11% conversion lift on tickets priced above USD 800.
Usage-based billing is reshaping media and entertainment, demanding gateways capable of metering API calls and charging dynamically. Zuora’s collaboration with Adyen automated the flow for 2,300 subscription businesses. Healthcare, education, and government agencies are rolling out digital vouchers such as India’s e-RUPI, which logged 89 million transactions in 2024. The diverse industry roster underscores the expanding addressable base for the payment gateway market.
Geography Analysis
APAC Payment Gateway Market
Asia Pacific commanded 39.74% of global revenue in 2025, anchored by Alipay, WeChat Pay, and India’s UPI clearing more than 120 billion, and 131 billion transactions respectively in 2024. Widespread QR-code adoption coupled with government-backed instant rails cements the region’s leadership position.
Middle East Payment Gateway Market
The Middle East is projected to register a 16.79% CAGR through 2031, the highest regional pace in the payment gateway market. Saudi Arabia’s Vision 2030 calls for 70% cashless transactions by 2025, and the United Arab Emirates is piloting a CBDC with 14 banks to streamline cross-border settlements.[3]Saudi Central Bank, “Financial Technology Strategy 2025,” sama.gov.sa Local mandates have spurred acquirer investment in contactless infrastructure, catalyzing gateway adoption across retail and hospitality.
The Americas, Europe and Africa Payment Gateway Market
North America contributed 28% of 2025 revenue but is slowing as card penetration nears saturation. Europe benefits from PSD2-driven upgrades; 78% of merchants migrated to 3-D Secure 2.2 by mid-2025. South America’s digital sprint continues, with Brazil’s Pix handling 42 billion instant payments in 2024. Africa remains fragmented, yet Nigeria’s Paystack integration with Ghana’s GhIPSS is an early sign of cross-border instant-payment corridors.

Regulatory Landscape
Regulation continues to tighten around authentication, licensing, and consumer protection, shaping gateway product roadmaps for 3-D Secure, tokenization, and recurring-payment mandates. In Europe, the European Banking Authority strong customer authentication requirements have been fully effective since March 2024, which has accelerated migrations to 3-D Secure 2.x and pushed gateways to support low-friction, biometric-ready flows while meeting transparency expectations tied to newer digital-services fee disclosure requirements.
In 2026, regulators broadened formal frameworks for non-bank payment service providers and digital mandates. The European Parliament and Council reached a provisional political agreement in April 2026 on PSD3 and the Payment Services Regulation (PSR), signaling a move toward more uniform Union-wide rules that affect onboarding, security controls, and incident handling. India advanced oversight through the Reserve Bank of India Digital Payments E-mandate Framework (effective April 2026). Other jurisdictions, including Barbados (National Payment System regulations enacted February 2026) and Sri Lanka (registration deadlines for existing providers in March 2026), reinforced licensing and compliance expectations that influence data residency, auditability, and operating model choices for global gateway providers.
Value Chain Analysis
The payment gateway value chain starts with consumers initiating payments through merchant checkout experiences (web, in-app, and increasingly omnichannel), then flows through the gateway for tokenization, authentication, routing, and fraud screening before reaching processors/PSPs, acquirers, card networks or account-to-account rails, and finally issuing banks and settlement systems. Supporting layers include identity verification, risk engines, chargeback and dispute management, FX and multi-currency conversion, and cloud and edge infrastructure that supports low-latency authorization and high API throughput, especially as BNPL and orchestration increase calls per transaction.
Key frictions show up at integration and settlement. Fragmented stacks that separate acquiring, FX, payouts, and fraud tools raise operational overhead and complicate reconciliation, while legacy batch processes still impose T+1 or T+2 dynamics in many corridors. Gateways are addressing this by adding orchestration and deeper ERP connectivity to streamline acceptance and back-office flows, including J.P. Morgan Payments launching an integrated supply chain finance solution with Oracle Fusion Cloud ERP in July 2025.
Competitive Landscape
The payment gateway market features moderate concentration. The top five processors - PayPal, Stripe, Adyen, Worldline, and Checkout.com - handled about 48% of 2024 global transaction value yet face rising competition from regional champions. Stripe’s 2024 acquisition of tax-automation firm TaxJar broadened its compliance suite, while Adyen’s issuer-processing launch lets platforms roll out branded cards without traditional bank partners.
Emerging specialists such as Razorpay, Paytm, and dLocal dominate their domestic arenas by bundling local alternative payment methods into turnkey application-programming-interfaces, enabling cross-border merchants to avoid multiple bilateral contracts. Checkout.com’s USD 1 billion Series D round finances a blockchain-settlement layer that promises to lower foreign-exchange spreads by 60%, and Circle’s USDC stablecoin logged USD 11 trillion in on-chain volume in 2024.
Product differentiation now hinges on risk-scoring accuracy, orchestration flexibility, and tokenization patents. Visa and Mastercard jointly hold 1,200 active security patents, while Stripe reports a 98.5% fraud detection rate with a 0.8% false-positive level.[4]United States Patent and Trademark Office, “Payment Security Patent Filings 2023-2024,” uspto.gov Embedded finance opportunities remain sizeable, as fewer than 22% of vertical software platforms have monetized payments to date, leaving ample runway for gateway expansion.
Payment Gateway Industry Leaders
PayPal Holdings, Inc.
Amazon Pay (Amazon.com, Inc.)
Stripe, Inc.
PayU Group
Skrill Ltd (Paysafe)
- *Disclaimer: Major Players sorted in no particular order
Payment Gateway Market Companies Covered in this Report
- PayPal Holdings Inc.
- Stripe Inc.
- PayU Payments Private Limited (Naspers Limited)
- Amazon Payments Inc.
- Block Inc.
- Adyen N.V.
- Alipay.com Co. Ltd.
- WePay Inc. (JPMorgan Chase Bank N.A.)
- CyberSource Corporation (Visa Inc.)
- Checkout.com Group S.A.
- Razorpay Software Private Limited
- Paytm Payments Services Limited
- Mollie B.V.
- Ingenico Group S.A. (Worldline S.A.)
- Payoneer Inc.
- Worldpay LLC (Fidelity National Information Services Inc.)
- Klarna Bank AB
- BlueSnap Inc.
- Rapyd Financial Network Ltd.
- Nuvei Corporation
- dLocal Ltd.

Market Opportunities and Future Outlook
White space is expanding where gateways can monetize beyond authorization into orchestration, account-to-account (A2A) acceptance, and cross-border routing. Real-time rails and national programs are creating near-term integration demand: India, Thailand, Singapore, Brazil, and the United States have active instant-payment infrastructures (UPI, PromptPay, PayNow, Pix, and FedNow) that push merchants toward lower-cost settlement options and require gateways to build connectors, reconciliation tooling, and treasury-friendly reporting. Cross-border commerce is also sustaining demand for multi-currency settlement and intelligent routing, supported by European SMEs reaching EUR 89 billion in cross-border online sales in 2024 and citing currency-conversion friction as a barrier, which supports interest in dynamic FX, local payment methods, and acquirer routing capabilities.
Regulatory modernization also creates opportunities for compliant platforms to win share through direct market access and standardized recurring-payment handling. The Reserve Bank of India published Payments Vision 2028 in March 2026, including cross-border fund-transfer priorities and regulatory evolution, while the April 2026 RBI Digital Payments E-mandate Framework consolidates recurring-payment requirements that gateways can operationalize via reusable mandate APIs, token vaults, and dispute-ready audit trails. In Europe, the April 2026 provisional agreement on PSD3 and PSR, along with broader moves toward stricter security and transparency, increases the value of gateways with strong SCA support, monitoring, and reporting, and encourages merchants to rationalize vendors toward fewer, more integrated providers.
Recent Industry Developments in Payment Gateway Market
- July 2026: Stripe and Advent International submitted a joint bid to acquire PayPal Holdings Inc, valuing the company at over USD 53 billion. The proposed combination targets scale in global acceptance and could compress competitive differentiation around orchestration, fraud tooling, and enterprise checkout APIs. The deal attempt also underscores how leading gateways are pursuing consolidation rather than incremental feature adds to expand distribution and merchant reach.
- December 2025: Adyen received regulatory approval from the Saudi Arabian Monetary Authority to operate as a licensed payment service provider in the Kingdom. This enables direct acquiring services without relying on local sponsor banks, strengthening control over authorization, settlement, and pricing for Saudi merchants. Adyen is deepening its position in a region where cashless-commerce mandates are accelerating merchant digitization.
- April 2024: Visa and Mastercard lifted interchange fees by an average of eight basis points, raising the all-in processing cost of a USD 5 purchase above 4.2% in some cases. This fee pressure has pushed gateways serving micro-transactions to revisit pricing, routing, and alternative-rail enablement to protect merchant margins. It has also intensified merchant demand for cost visibility and optimization tools within gateway dashboards.


Payment Gateway Market Report Scope and Research Methodology
Market Definition and Coverage
For this study, the payment gateway market covers third party technology that securely authorizes, routes, and helps settle digital payments for online and in-app checkouts, across card, wallet, and account-to-account flows.
Scope exclusions: We exclude pure-play acquiring revenue, offline POS hardware sales, and in-house gateway tools bundled at no charge inside merchant software suites.
Segments Covered in This Report
- By Host Type
- Hosted
- Self-Hosted
- By Enterprise Size
- Small and Medium Enterprises
- Large Enterprises
- By Channel
- Online - Web
- Mobile In-App
- In-Store POS - Omnichannel
- By End-User Industry
- Retail and E-Commerce
- Travel and Hospitality
- Banking Financial Services and Insurance
- Media and Entertainment
- Other End-User Industries
- By Geography
- North America
- United States
- Canada
- Mexico
- Europe
- Germany
- United Kingdom
- France
- Nordics
- Rest of Europe
- Asia Pacific
- China
- India
- Japan
- South Korea
- South-East Asia
- Rest of Asia Pacific
- South America
- Brazil
- Argentina
- Rest of South America
- Middle East
- Saudi Arabia
- United Arab Emirates
- Turkey
- Rest of Middle East
- Africa
- South Africa
- Nigeria
- Rest of Africa
- North America
Data Sources, Market Sizing, and Validation
Desk Research
Desk research starts with mapping the demand context for digital payments and ecommerce. Gateway revenues track online transaction volumes and pricing, so we anchor our view to transaction and macro series by geography. Public source types used include central bank payment statistics, IMF and World Bank macro series, BIS notes on payment systems, and UN Comtrade cross-border trade signals that can shift online purchase activity.
We also pull from company annual reports and investor presentations to confirm product scope and pricing cues. Press releases and business media help capture policy and partnership changes, especially when they affect checkout routing or settlement timelines. When needed, paid subscriptions are used for company financials and intelligence, patent databases, and an import/export shipment-level database to sanity-check narrative shifts that are tied to hardware-linked rollouts. These examples are illustrative only, and the final dataset also reflects other public and internal references used during data collection, validation, and clarification.
Primary Interviews and Surveys
Primary input is used to pressure-test the model with people who see pricing and volume changes directly, including gateway providers, payment facilitators, merchants, and platform integrators. We also verify how checkout mix, wallet usage, and cross-border acceptance differ across regions, so we do not carry assumptions from one geography into another where buying behavior and acceptance rates can change.
Distribution of primary research fieldwork respondents
| Company type | Respondent position | Region |
|---|---|---|
| Top tier: 29% | CXOs: 16% | APAC: 48% |
| Mid tier: 54% | Functional/Unit leaders: 27% | EMEA: 29% |
| Smaller Players: 17% | Managers: 57% | Americas: 23% |
Market-Sizing & Forecasting
Sizing uses a top-down demand pool that reconstructs digital checkout activity by region, then converts it into gateway revenue using practical pricing and take-rate assumptions. The key drivers are ecommerce and in-app purchase growth, the share of payments routed through third party gateways, shifts in cross-border transaction mix, and changes between card and wallet rails, which can alter effective pricing.
To keep the totals grounded, we corroborate results with selective bottom-up checks, such as sampled vendor revenue disclosures, channel checks with merchants and integrators, and ASP multiplied by processed volume sanity checks where reliable ranges are available. When bottom-up reads are constrained (for example, private company disclosure limits), the gaps are bridged using peer-set pricing bands and region-level adoption proxies discussed and agreed during interviews.
For forecasting, we run scenario analysis anchored on macro and payments indicators, then apply exponential smoothing to key series such as online transaction growth and effective revenue yield, to avoid reacting to short-term spikes. Pricing compression, FX movement, and wallet penetration assumptions are reviewed with experts so the forward curve stays consistent with observed mix shifts, even when reported headline digital payments growth looks unusually strong.
Data Validation & Update Cycle
Outputs are cross-checked against independent signals such as digital payments growth rates, ecommerce sales trends, and the direction of reported take rates. Where we see variances, we investigate drivers before sign-off, including conversion rate treatment and currency handling. If a region shows an unexpected jump, we re-check the underlying drivers and, if the change is material, we re-contact sources.
The report is refreshed annually. Interim updates are made when there are meaningful policy changes, pricing moves, or sudden shifts in cross-border activity. Before delivery, we complete a fresh analyst pass so clients get the most current updated view rather than a prior model run.
Mordor Intelligence's Payment Gateway Market Estimate Compared With Other Published Estimates
Published market sizes for payment gateways can vary a lot, even when the topic name sounds similar, because the revenue boundary is easy to stretch. Differences usually come from what is counted as a gateway service, how pricing is translated into revenue yield, and which year and currency timing are used.
A refresh-led gap often shows up when FX conversion dates, take-rate trends, and the treatment of bundled pricing are updated at different times across studies. That timing difference can shift the current-year base and the forecast slope. By re-checking effective ASP logic against current mix shifts and applying consistent currency timing across regions, Mordor Intelligence lands at a smaller 2026 value that avoids pulling in adjacent acquiring and POS hardware revenues.
Benchmark comparison
| Source | Market Size | Gaps in Research Methodology |
|---|---|---|
| Mordor Intelligence | USD 20.96 B (2026) | |
| Global Consultancy A | USD 26.70 B (2024) | Uses an earlier base year and a different time window, and its scope is presented around offering and vertical splits without clear exclusions for adjacent payments services. The estimate can rise if gateway revenues are modeled closer to overall digital payments enablement, rather than only third party routing and authorization. |
| Trade Publisher B | USD 37.72 B (2024) | Includes redirected gateways plus payment security services and also counts sales of card readers and POS terminals tied to gateway services. The broader definition and factory-gate style valuation can inflate the figure versus a gateway-only revenue boundary, especially in regions with fast device rollouts. |
Overall, the spread is mainly explained by timing and scope, not by math mistakes. When the revenue boundary is kept tight to gateway platform services and the pricing yield is updated to match the current mix, the resulting market size stays easier to trace back to real checkout activity and repeatable checks.


Key Questions Answered in the Report
How large is the payment gateway market today?
The payment gateway market size reached USD 20.96 billion in 2026 and is forecast to grow to USD 41.11 billion by 2031.
Which host architecture is expanding fastest?
Self-hosted gateways are projected to grow at a 16.46% CAGR through 2031 as enterprises seek granular control over security and routing.
What region will post the highest growth?
The Middle East is expected to register the fastest 16.79% CAGR through 2031, driven by cashless-commerce mandates and a CBDC pilot.
Why are interchange fees a concern for micro-transactions?
April 2024 fee hikes lifted processing costs on a USD 5 purchase above 4.2%, squeezing gateways that serve low-ticket digital goods.
How are real-time payment rails affecting gateways?
Integration with instant rails like UPI and PromptPay cuts per-transaction costs by up to 60 basis points and improves working-capital cycles.
What differentiates leading gateway providers?
Leaders combine orchestration, tokenization patents, and high-precision fraud models, while pursuing embedded finance to deepen revenue per client.
Page last updated on:


