Payment As A Service Market Size and Share
Market Overview
| Study Period | 2020 - 2031 |
|---|---|
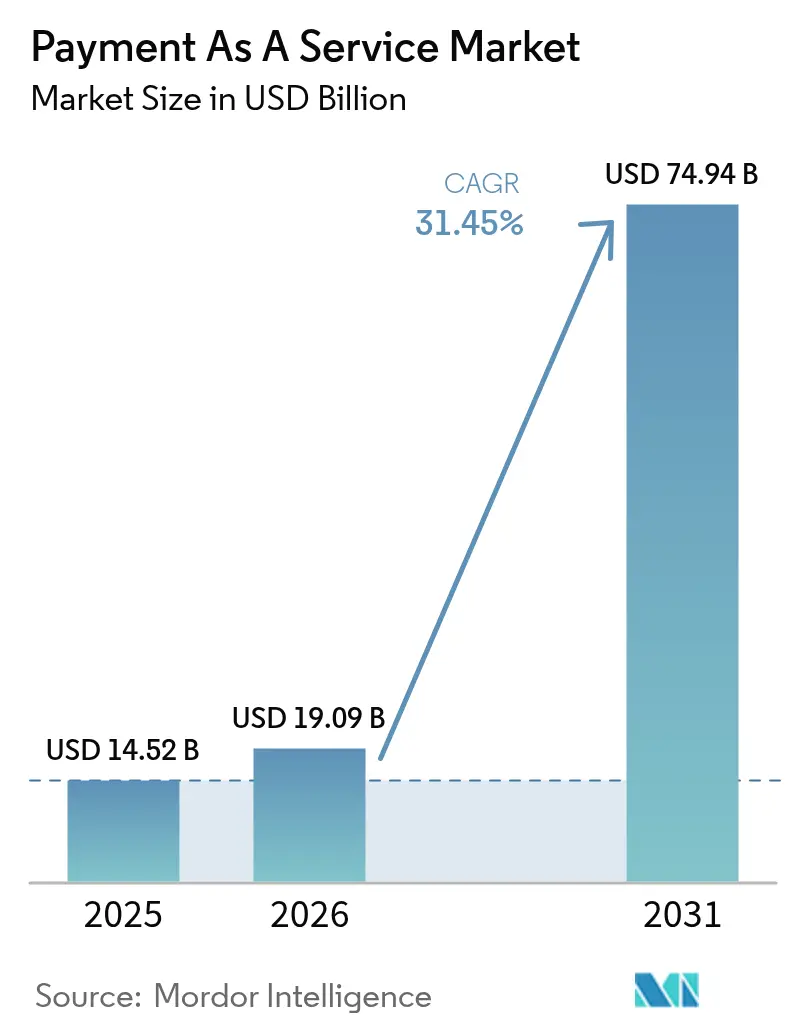
| Market Size (2026) | USD 19.09 Billion |
| Market Size (2031) | USD 74.94 Billion |
| Growth Rate (2026 - 2031) | 31.45% CAGR |
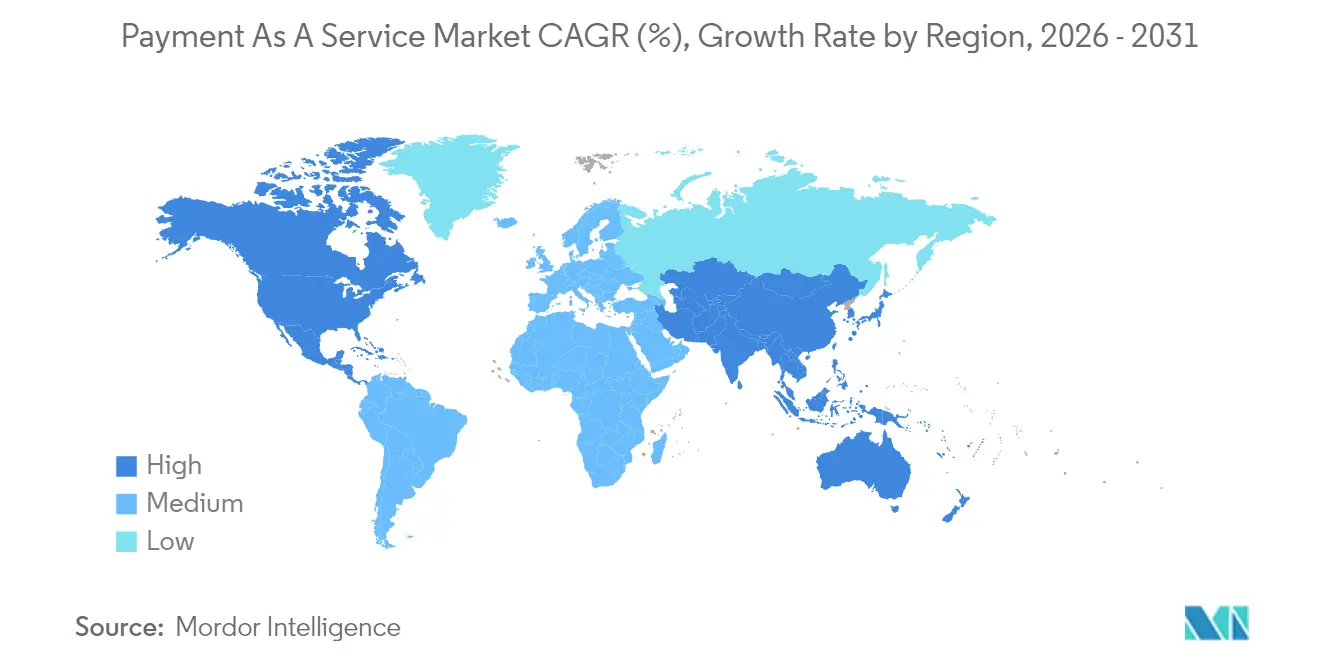
| Fastest Growing Market | Asia Pacific |
| Largest Market | North America |
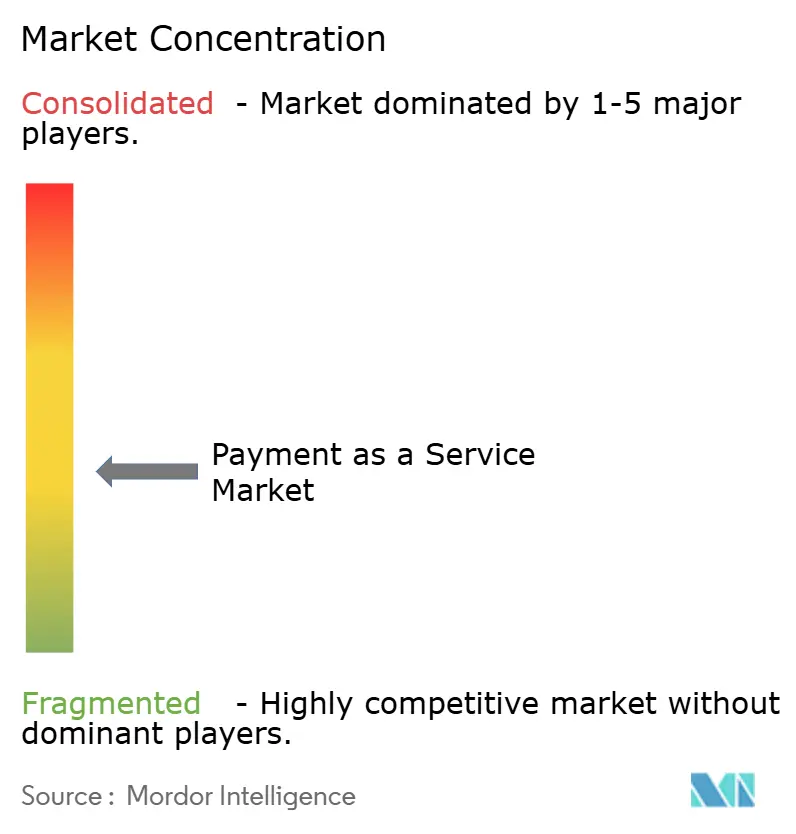
| Market Concentration | Medium |
Major Players *Disclaimer: Major Players sorted in no particular order Image © Mordor Intelligence. Reuse requires attribution under CC BY 4.0. | |
Payment As A Service Market Analysis by Mordor Intelligence
The payment as a service market size was valued at USD 14.52 billion in 2025 and estimated to grow from USD 19.09 billion in 2026 to reach USD 74.94 billion by 2031, at a CAGR of 31.45% during the forecast period (2026-2031). Structural shifts favoring consumption-based procurement, rapid rollout of real-time payment rails, and regulatory pushes toward open banking continue to accelerate adoption. Enterprises view cloud-hosted orchestration as a route to lower total cost of ownership, while non-bank brands embed payments directly into digital journeys to capture incremental revenue. Heightened fraud threats and fragmented compliance regimes temper margins, but they also drive demand for bundled security and regulatory services that command premium pricing. Competitive intensity remains moderate as incumbent processors defend their gateway volumes while fintech challengers target adjacent embedded finance opportunities.
Key Report Takeaways
- By type of services, payment applications and gateways led with 40.65% revenue share in 2025; security and fraud protection is projected to grow at a 33.68% CAGR through 2031.
- By payment method, card-based payments captured 48.10% of the transaction value in 2025; buy-now-pay-later solutions are forecast to expand at a 33.05% CAGR through 2031.
- By deployment model, cloud-based platforms dominated with a 62.25% share in 2025 and also recorded the highest projected CAGR at 34.18% through 2031.
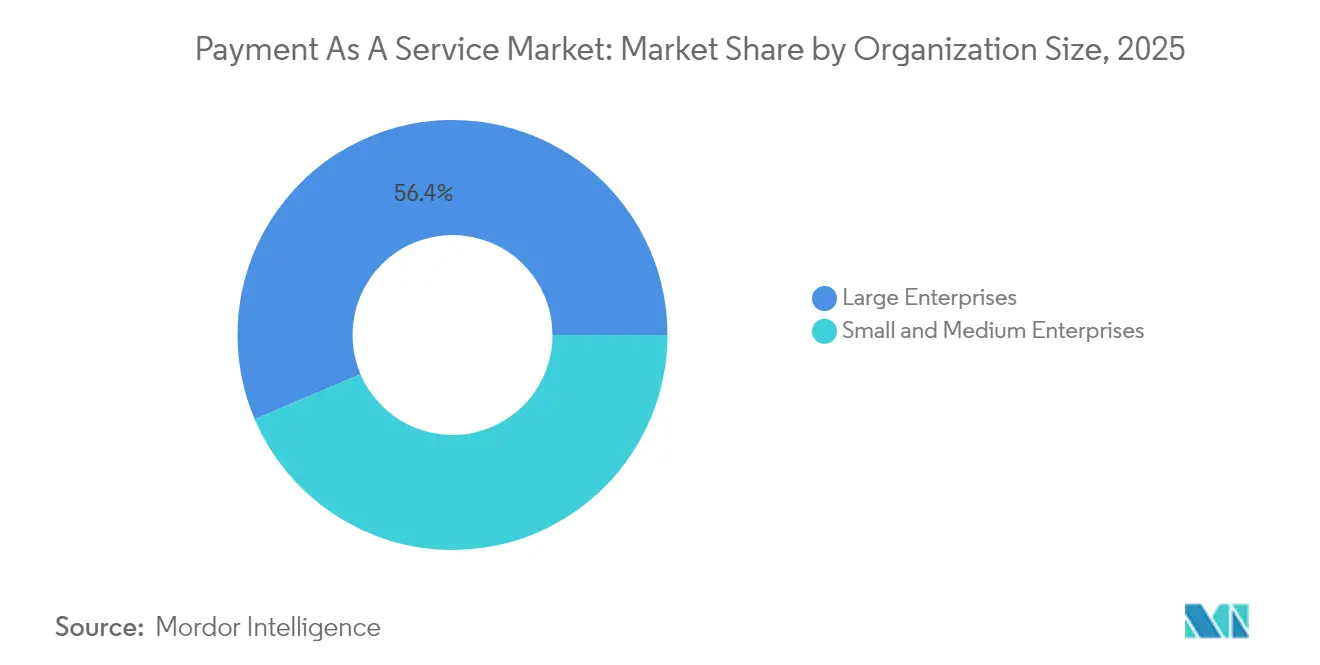
- By organization size, large enterprises accounted for 56.40% spending in 2025; small and medium enterprises are set to grow at a 33.74% CAGR through 2031.
- By end-user industry, retail and e-commerce represented 42.75% of the demand in 2025 and are expected to register the strongest forecast CAGR of 33.26% from 2025 to 2031.
- By geography, North America led with a 36.05% revenue share in 2025, while the Asia-Pacific region is projected to grow at a 34.52% CAGR through 2031.
Note: Market size and forecast figures in this report are generated using Mordor Intelligence’s proprietary estimation framework, updated with the latest available data and insights as of 2026.
Global Payment As A Service Market Trends and Insights
Drivers Impact Analysis*
| Driver | (~) % Impact on CAGR Forecast | Geographic Relevance | Impact Timeline |
|---|---|---|---|
| Rising Smartphone Penetration and Digital Service Adoption | +4.8% | Global with concentration in Asia-Pacific and Sub-Saharan Africa | Medium term (2-4 years) |
| Growth in E-Commerce and Marketplace Transactions | +6.2% | Global led by North America, Europe, and Asia-Pacific | Short term (≤ 2 years) |
| Regulatory Push Toward Open Banking and PSD2 Compliance | +5.5% | Europe and United Kingdom with spillover to Australia and Brazil | Medium term (2-4 years) |
| Rapid Expansion of Real-Time Payment Rails Globally | +7.1% | Global with early gains in United States, India, Brazil, and Singapore | Short term (≤ 2 years) |
| Embedded Finance Opportunities for Non-Bank Brands | +5.9% | North America and Europe, emerging in Asia-Pacific | Medium term (2-4 years) |
| Uptake of PayFac-as-a-Service Models by SMEs | +4.3% | Global strongest in North America and Europe | Long term (≥ 4 years) |
| Source: Mordor Intelligence | |||
Rapid Expansion of Real-Time Payment Rails Globally
Central banks across 70 jurisdictions now operate or pilot instant-payment schemes, creating a parallel infrastructure that bypasses legacy card networks. The United States FedNow Service reached 900 participating institutions by late 2024, clearing payments in under 10 seconds and shortening merchant cash cycles from days to seconds.[1]Federal Reserve, “FedNow Service Celebrates One Year of Providing Instant Payments,” federalreserve.gov India’s Unified Payments Interface (UPI) handled 16.73 billion transactions in December 2024 alone, a 45% year-over-year increase that underscores the momentum behind zero-fee rail. Brazil’s Pix processed 42 billion payments in 2024, surpassing combined credit and debit card volumes and prompting acquirers to shift their focus to value-added services. The mandatory adoption of ISO 20022 for correspondent banking has further encouraged providers to adopt modern architectures. As real-time rails proliferate, gateway margins rooted in card-routing complexity face compression, amplifying the need for unified APIs that abstract multiple networks.
Embedded Finance Opportunities for Non-Bank Brands
Enterprises integrate payment acceptance, lending, and card issuance into native experiences to monetize transaction flows. Shopify extended over USD 5 billion in merchant cash advances during 2024, leveraging sales data for real-time underwriting. Uber introduced a driver debit card that provides instant access to earnings and captures interchange revenue at the daily spend level. PSD3 clarifies licensing routes, letting non-banks rely on Banking-as-a-Service partners for regulatory capital and accelerating embedded launches.[2]European Banking Authority, “EBA Publishes Final Draft Regulatory Technical Standards Under PSD3,” eba.europa.eu Stripe’s USD 1.1 billion purchase of stablecoin platform Bridge signals that programmable money is viewed as the next adjacency. The shift rewards platforms that treat payments as an embedded utility rather than a standalone service.
Growth in E-Commerce and Marketplace Transactions
Global online retail sales reached USD 6.3 trillion in 2024, with cross-border purchases increasing by 18%, fueling demand for multi-currency settlement.[3]United Nations Conference on Trade and Development, “Global E-Commerce Sales,” unctad.org Amazon’s rollout of Buy with Prime to external merchants converts the checkout process into a customer-acquisition tool, raising pressure on traditional gateways. Social commerce surged as TikTok Shop surpassed USD 20 billion GMV in 2024, necessitating in-app payment flows. Mastercard’s Passkey biometric service reduced European cart abandonment by up to 12%, directly linking security innovation to revenue. Marketplaces are increasingly requesting split-payment capabilities that settle funds across multiple sellers, which raises integration hurdles for legacy acquirers.
Regulatory Push Toward Open Banking and PSD2 Compliance
PSD3, effective 2024, extends data-sharing mandates to credit card transactions and heightens liability on payment initiation providers. The UK Financial Conduct Authority green-lit variable recurring payments, allowing merchants to adjust subscription amounts within limits without renewed consent. Australia’s Consumer Data Right now covers read-write APIs, letting fintechs trigger direct account payments. Brazil’s open finance rules mandate bank data portability, thereby accelerating the adoption of account-to-account transactions. Collectively, these policies erode bank data monopolies and encourage providers to differentiate their services at the layer.
Restraints Impact Analysis*
| Restraint | (~) % Impact on CAGR Forecast | Geographic Relevance | Impact Timeline |
|---|---|---|---|
| Lack of Globally Harmonised Payment Standards | -3.2% | Global, acute in cross-border scenarios | Long term (≥ 4 years) |
| Complex Multi-Jurisdiction Compliance Burdens | -4.8% | Global particularly Europe, North America, and Asia-Pacific | Medium term (2-4 years) |
| Data-Privacy and Cyber-Security Concerns | -5.1% | Global heightened in Europe and North America | Short term (≤ 2 years) |
| High Chargeback and Fraud-Related Operating Costs | -3.7% | Global concentrated in card-based segments | Medium term (2-4 years) |
| Source: Mordor Intelligence | |||
Complex Multi-Jurisdiction Compliance Burdens
Fragmented licensing standards require providers to maintain redundant capital buffers, reporting processes, and consumer-protection protocols, thereby inflating compliance costs by 15-20%. PSD3 tilts fraud liability toward payment initiation service providers, necessitating deeper risk reserves. Divergent BNPL affordability rules between the United Kingdom and the United States require parallel underwriting engines. India’s data-localization rule for payment aggregators mandates domestic storage, adding regional cloud instances. PCI DSS 4.0 obliges continuous monitoring, raising the bar for merchants to self-host payments. These burdens favor scaled platforms that can amortize compliance overhead.
Data-Privacy and Cyber-Security Concerns
The PCI SSC logged a 34% surge in breaches among Level 1 merchants in 2024, casting doubt on the current tokenization coverage. GDPR penalties of up to 4% of global revenue raise existential stakes for mishandled data. Synthetic identity fraud resulted in USD 6 billion in U.S. losses in 2024, driving investment in behavioral risk models. Mastercard Passkey reduces phishing vectors yet requires merchants to refactor their checkouts, slowing down uptake. With only 42% of card-on-file transactions tokenized, regulators debate shifting fraud losses onto providers, potentially trimming fee margins by 200-300 basis points.
*Our forecasts treat driver/restraint impacts as directional, not additive. The impact forecasts reflect baseline growth, mix effects, and variable interactions.
Segment Analysis
By Type of Services: Security Investments Outpace Gateway Commoditization
Security and fraud protection contributed significantly to the payment as a service market in 2025 and is forecast to grow at a 33.68% CAGR through 2031, outpacing the overall payment as a service market CAGR. Payment applications and gateways, which account for 40.65% of revenue, yet face a margin squeeze as open banking and real-time rails simplify connectivity.
Merchants now evaluate fraud prevention as a revenue safeguard, evidenced by PCI DSS 4.0 rules that have driven cloud-based security uptake. Platforms also bundle merchant financing, using transaction telemetry to underwrite credit; Shopify disbursed more than USD 5 billion in 2024. Regulation-as-a-Service gains relevance as PSD3 tightens liability, and reconciliation tools round out full-stack offerings. Providers that can integrate these features into consumption-priced APIs are best positioned for the expansion of the payment as a service market.


By Payment Method: BNPL Regulatory Clarity Unlocks Capital
Card networks retained a 48.10% share in 2025, the largest allocation in the payment as a service market share context, although growth trails emerging options. Buy now, pay later is projected to post a 33.05% CAGR through 2031, the fastest among methods, following the FCA's standardization of affordability checks.
Digital wallets continue to scale across the Asia-Pacific region, thanks to UPI’s 16.73 billion transactions in December 2024. Account-to-account alternatives are flourishing in Europe, where PSD3 dismantles data exclusivity. Cryptocurrencies remain niche, yet Stripe’s stablecoin acquisition signals hedging against potential mainstream adoption as a settlement method. Providers capable of multi-rail orchestration capture broader payment as a service market opportunities.
By Deployment Model: Cloud Dominance Reflects Infrastructure-as-Code Shift
Cloud implementations captured 62.25% of 2025 revenue and are forecast to grow at a 34.18% CAGR, underscoring the elastic scaling benefits in the payment as a service market. FedNow’s fully cloud-native architecture validates production-grade real-time settlement at scale.
On-premise remains relevant for data-residency-bound incumbents but is increasingly hybrid, with analytics layers shifting into public clouds. PCI DSS 4.0’s explicit cloud guidance further legitimizes hosted deployments. India’s localization rule is driving multi-region cloud footprints. Providers that master region-aware infrastructure code can compress launch cycles and expand the reach of payment ss s service market.
By Organization Size: SME Adoption Driven by PayFac Simplification
Large enterprises commanded 56.40% of the 2025 spend, holding a leading position in the payment as a service market share, yet SME uptake is stronger, with a 33.74% CAGR forecast through 2031. Stripe Connect’s embedded lending and issuance illustrates high attach rates among long-tail merchants.
Vertical SaaS models, such as Toast, processed USD 100 billion in 2024 by integrating payments into restaurant workflows. Regulatory clarity under PSD3 lowers non-bank entry hurdles, intensifying SME-focused innovation. No-code integration tools further reduce technical friction, narrowing the adoption gap across various enterprise sizes in the payment as a service market.
By End-User Industry: Retail Orchestration Complexity Drives Platform Consolidation
Retail and e-commerce generated 42.75% of 2025 demand and sustained 33.26% growth as omnichannel strategies necessitate unified orchestration. Amazon’s Buy with Prime underlines checkout as a growth lever beyond marketplace walls.
Banking and insurance players modernize for real-time settlement, while hospitality chains deploy contactless solutions at scale. Media platforms optimize subscription retries, cutting churn for streaming leaders. Social commerce in Southeast Asia further diversifies payment contexts. Providers delivering verticalized capabilities, such as split settlements or recurring billing, will outpace generic gateways in the payment as a service market.
Geography Analysis
North America contributed 36.05% of the 2025 revenue, the largest regional allocation in the payment as a service market. FedNow’s 900-bank network demonstrates the viability of real-time settlement. Canada launched its Real-Time Rail in 2024, yet concentrated banking slows merchant onboarding. Mexico’s CoDi QR initiative lifts digital inclusion, but cash remains resilient.
Europe navigates PSD3 transitions that favor account-to-account payments. FCA guidance on variable recurring payments trims subscription friction. Germany’s Girocard tallies 6 billion national-only transactions. France’s wholesale CBDC pilot tests programmable securities settlement. Klarna processed EUR 10 billion (USD 10.8 billion) across Southern Europe in 2024, showing BNPL appeal.
The Asia-Pacific region records the highest forecast CAGR of 34.52% for the payment as a service market. UPI’s December 2024 throughput evidences wallet dominance. China’s e-CNY pilot boasts 260 million wallets. Japan’s Zengin System processed 2.5 billion instant payments. Korea mandated real-time fraud monitoring, resulting in a 30% reduction in unauthorized losses. Southeast Asia remains fragmented, providing opportunities for aggregation platforms to capitalize on arbitrage.
The Middle East shows uneven uptake: Saudi Arabia’s instant rail cleared 500 million payments in 2024, while other markets stay cash-heavy. Israel exports fraud-detection tech globally. Turkey’s capital controls complicate cross-border flows. Africa is led by Kenya’s M-Pesa, which handles 20 billion transactions, and South Africa’s Rapid Payments Programme.
South America pivots from cash as Brazil’s Pix tops card volumes. Argentina’s Transferencias 3.0 rollout helps combat macroeconomic instability. Chile pilots a wholesale CBDC for cross-border settlement with Peru. High smartphone density supports wallet adoption, yet currency volatility and disparate regulation remain headwinds.

Competitive Landscape
The payment as a service market is moderately fragmented. Processors such as Fiserv and Worldline protect gateway volumes but face slowing growth as real-time rails cut interchange rents. Stripe’s USD 1.1 billion acquisition of Bridge adds stablecoin rails, positioning the firm for programmable settlement scenarios.
Adyen differentiates through unified commerce, offering single-platform processing for in-store and online transactions. Vertical SaaS, exemplified by Toast, delivered a USD 100 billion volume with an 80% attach rate in 2024. Open-banking startups leverage PSD3 to bypass cards, while PCI DSS 4.0 validates cloud providers, lowering barriers for challengers.
Compliance fragmentation lifts costs by 15-20%, favoring scaled players. Strategic alliances emerge, such as Stripe embedding APIs within AWS Marketplace to speed enterprise integration. Intelligence-driven authorization optimization and fraud detection now eclipse pure connectivity as core differentiators, framing the next competitive frontier.
Payment As A Service Industry Leaders
Fidelity National Information Services Inc.
Thales Group S.A.
Ingenico Group S.A.
Paysafe Holdings UK Limited
Total System Services LLC
- *Disclaimer: Major Players sorted in no particular order

Recent Industry Developments
- November 2025: Visa expanded its Visa Flexible Credential program globally, allowing a single card to toggle between debit, credit, and buy now pay later functionality based on real-time consumer preference at checkout. The program launched in partnership with Affirm and is designed to reduce wallet clutter while maintaining issuer control over credit decisioning, addressing a key friction point in multi-payment-method environments.
- September 2022: The European Central Bank granted payment institution licenses to three non-bank platforms under the revised Payment Services Directive 3 framework, enabling them to offer cross-border payment initiation services without requiring correspondent banking relationships. This regulatory milestone validates the business model for account-to-account payment platforms and accelerates disintermediation of traditional card networks.
- July 2025: PayPal launched its Fastlane guest checkout solution across 20 markets, reducing checkout completion time by 40% through pre-filled credentials and biometric authentication. Early adoption by enterprise merchants including Salesforce Commerce Cloud and BigCommerce demonstrates demand for conversion optimization tools that operate independently of payment method selection.
- March 2025: Block Inc. (Square) acquired a majority stake in African mobile money aggregator Chipper Cash for USD 800 million, gaining access to payment infrastructure across 7 Sub-Saharan markets and positioning the company to compete with established players in remittance corridors between North America and Africa. The acquisition includes Chipper's cross-border settlement network and merchant acceptance footprint.


Global Payment As A Service Market Report Scope
The payment as a service report is segmented by Type of Services (Merchant Financing, Regulatory Compliance, Security and Fraud Protection, Payment Applications and Gateways, Other Type of Services), Payment Method (Card-Based Payments, Digital Wallets, Buy Now Pay Later, Cryptocurrencies, Other Payment Methods), Deployment Model (Cloud-Based, On-Premise, Hybrid), Organization Size (Large Enterprises, Small and Medium Enterprises), End-User Industry (Retail and E-Commerce, Banking Financial Services and Insurance, Hospitality, Media and Entertainment, Other End-User Industries), and Geography (North America, Europe, Asia-Pacific, Middle East, Africa, South America). The Market Forecasts are Provided in Terms of Value (USD).
| Merchant Financing |
| Regulatory Compliance |
| Security and Fraud Protection |
| Payment Applications and Gateways |
| Other Type of Services |
| Card-Based Payments |
| Digital Wallets |
| Buy Now Pay Later (BNPL) |
| Cryptocurrencies |
| Other Payment Methods |
| Cloud-Based |
| On-Premise |
| Hybrid |
| Large Enterprises |
| Small and Medium Enterprises |
| Retail and E-Commerce |
| Banking Financial Services and Insurance (BFSI) |
| Hospitality |
| Media and Entertainment |
| Other End-User Industries |
| North America | United States | |
| Canada | ||
| Mexico | ||
| Europe | United Kingdom | |
| Germany | ||
| France | ||
| Italy | ||
| Rest of Europe | ||
| Asia-Pacific | China | |
| Japan | ||
| India | ||
| South Korea | ||
| Rest of Asia | ||
| Middle East and Africa | Middle East | Saudi Arabia |
| United Arab Emirates | ||
| Rest of Middle East | ||
| Africa | South Africa | |
| Egypt | ||
| Rest of Africa | ||
| South America | Brazil | |
| Argentina | ||
| Rest of South America | ||
| By Type of Services | Merchant Financing | ||
| Regulatory Compliance | |||
| Security and Fraud Protection | |||
| Payment Applications and Gateways | |||
| Other Type of Services | |||
| By Payment Method | Card-Based Payments | ||
| Digital Wallets | |||
| Buy Now Pay Later (BNPL) | |||
| Cryptocurrencies | |||
| Other Payment Methods | |||
| By Deployment Model | Cloud-Based | ||
| On-Premise | |||
| Hybrid | |||
| By Organization Size | Large Enterprises | ||
| Small and Medium Enterprises | |||
| By End-User Industry | Retail and E-Commerce | ||
| Banking Financial Services and Insurance (BFSI) | |||
| Hospitality | |||
| Media and Entertainment | |||
| Other End-User Industries | |||
| By Geography | North America | United States | |
| Canada | |||
| Mexico | |||
| Europe | United Kingdom | ||
| Germany | |||
| France | |||
| Italy | |||
| Rest of Europe | |||
| Asia-Pacific | China | ||
| Japan | |||
| India | |||
| South Korea | |||
| Rest of Asia | |||
| Middle East and Africa | Middle East | Saudi Arabia | |
| United Arab Emirates | |||
| Rest of Middle East | |||
| Africa | South Africa | ||
| Egypt | |||
| Rest of Africa | |||
| South America | Brazil | ||
| Argentina | |||
| Rest of South America | |||


Key Questions Answered in the Report
What revenue level does the Payment As A Service market reach by 2031?
Forecasts project USD 74.94 billion by 2031, reflecting a 31.45% CAGR from 2026.
Which deployment model grows fastest in this space?
Cloud-based models advance at a 34.18% CAGR as firms prioritize elastic scaling and lower upfront costs.
Why is Asia-Pacific the highest-growth geography?
Expanding real-time rails and high digital wallet penetration drive a 34.52% CAGR, outpacing all other regions.
How do regulatory changes influence embedded finance adoption?
PSD3 and similar frameworks clarify licensing and liability, enabling non-bank brands to embed payments without owning full banking stacks.
What segment of services outperforms in growth?
Security and fraud protection leads with a 33.68% CAGR as merchants equate fraud prevention with revenue protection.
How fragmented is the competitive landscape?
The moderate score of 6 indicates that while large processors hold material share, significant room remains for fintech challengers.
Page last updated on:


