Payment Processor Market Size and Share
Market Overview
| Study Period | 2020 - 2031 |
|---|---|
| Market Size (2026) | USD 71.15 Billion |
| Market Size (2031) | USD 122.08 Billion |
| Growth Rate (2026 - 2031) | 11.40% CAGR |
| Fastest Growing Market | Asia Pacific |
| Largest Market | North America |
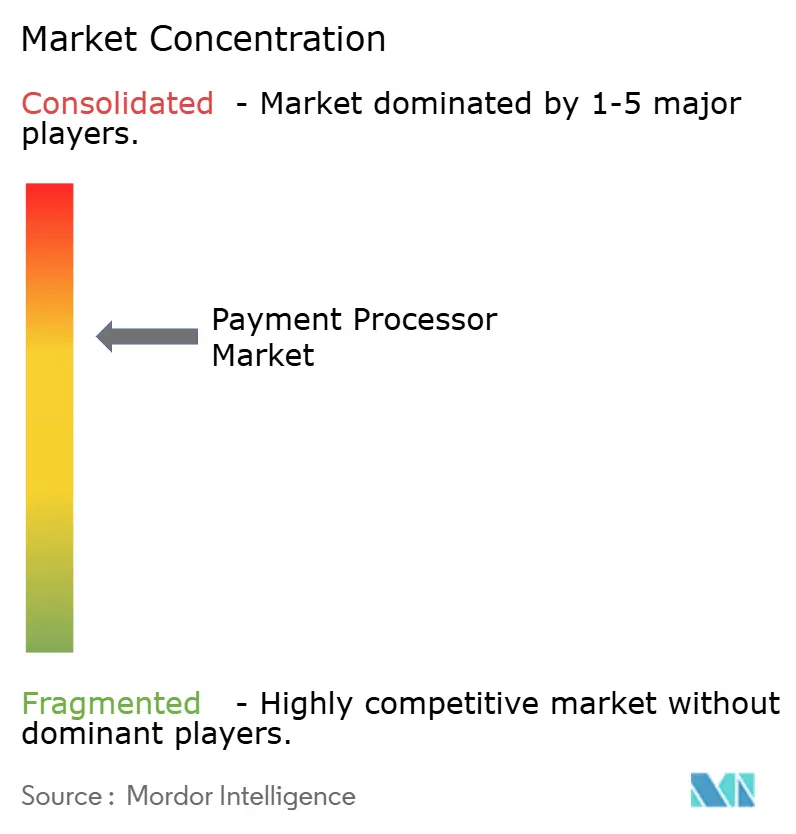
| Market Concentration | Medium |
Major Players*Disclaimer: Major Players sorted in no particular order Image © Mordor Intelligence. Reuse requires attribution under CC BY 4.0. | |
Payment Processor Market Analysis by Mordor Intelligence
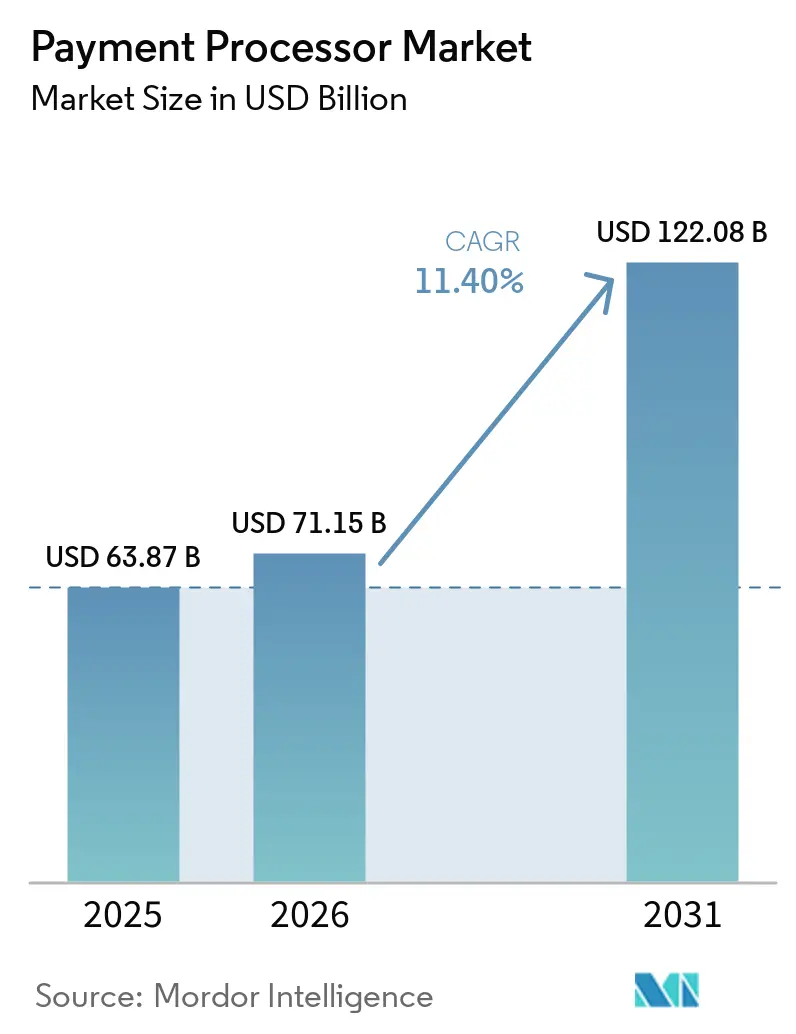
The payment processor market size is expected to grow from USD 63.87 billion in 2025 to USD 71.15 billion in 2026 and is forecast to reach USD 122.08 billion by 2031 at 11.4% CAGR over 2026-2031. Robust growth stems from embedded finance adoption, real-time payment modernization and regulatory frameworks that widen addressable volumes. Software-as-a-Service (SaaS) vendors now earn more than half of their revenue from embedded payments, underpinning a USD 185 billion embedded finance ecosystem that still captures less than one-fifth of its total opportunity.[1]Adyen, “The Adyen and BCG Embedded Finance Report,” adyen.com Accelerated implementation of account-to-account (A2A) schemes across Asia and the Nordics lowers settlement times from days to seconds and reduces cross-border fees by up to 75%. [2]Bank for International Settlements, “Project Nexus completes blueprint,” bis.org Open-banking mandates in the EU and UK generated 27.2 million payments valued at GBP 12.9 billion (USD 16.2 billion) by March 2025, a 67% year-over-year rise that validates regulatory catalysts for processor volumes. Regionally, North America holds a 30% payment processor market share in 2024, while Asia-Pacific delivers the fastest expansion with a 14.48% CAGR. Credit cards remain the leading transaction type at 45%, yet e-wallets advance at a 15.12% CAGR amid a pathway to USD 25 trillion in global wallet value by 2027.[3]Worldpay, “Global Payments Report 2024,” corporate.worldpay.com
Key Report Takeaways
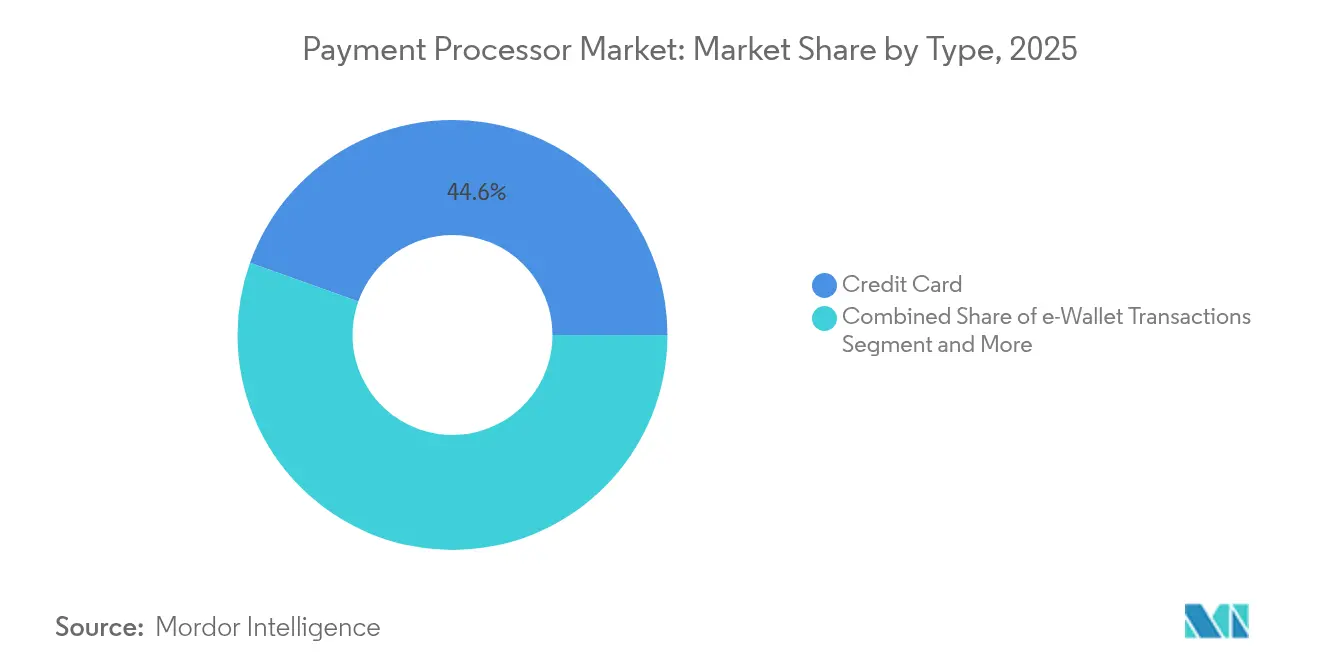
- By transaction type, credit cards led with 44.55% revenue share in 2025, while e-wallets are forecast to post a 14.82% CAGR to 2031.
- By component, solutions accounted for a 66.35% share of the payment processor market size in 2025 and are expected to grow at a 12.1% CAGR through 2031.
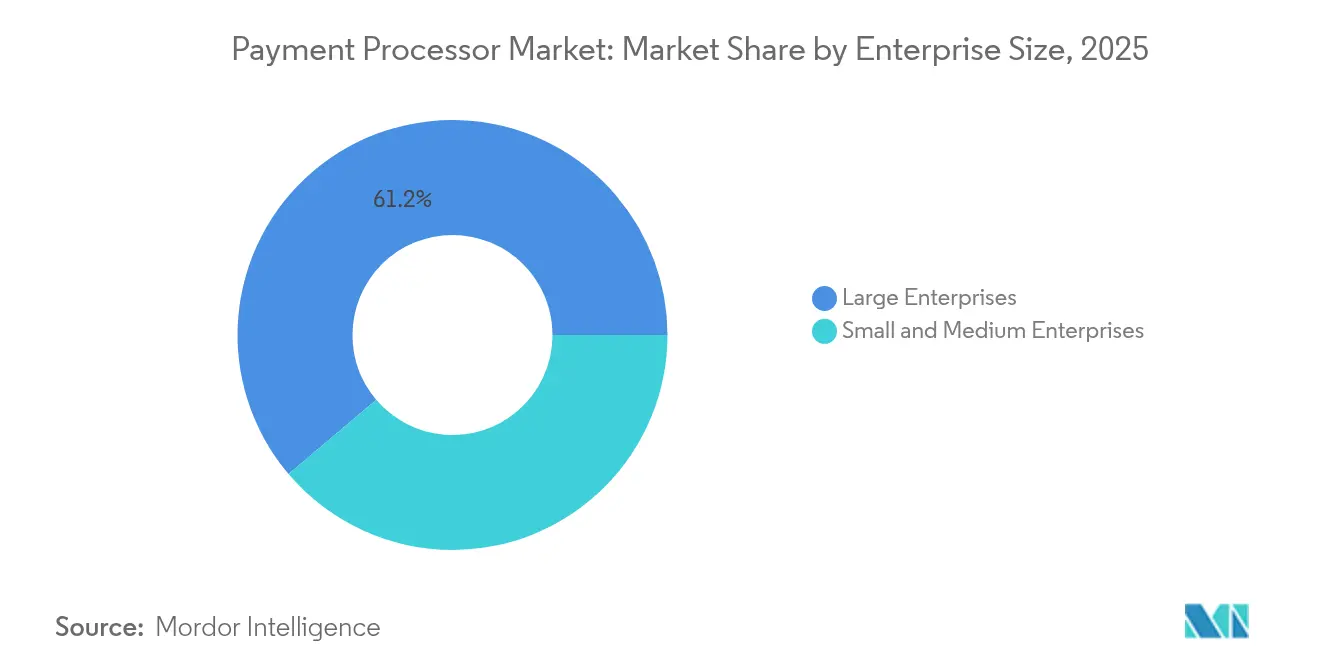
- By enterprise size, large enterprises held 61.20% of the payment processor market size in 2025, whereas small and medium enterprises are advancing at a 12.95% CAGR to 2031.
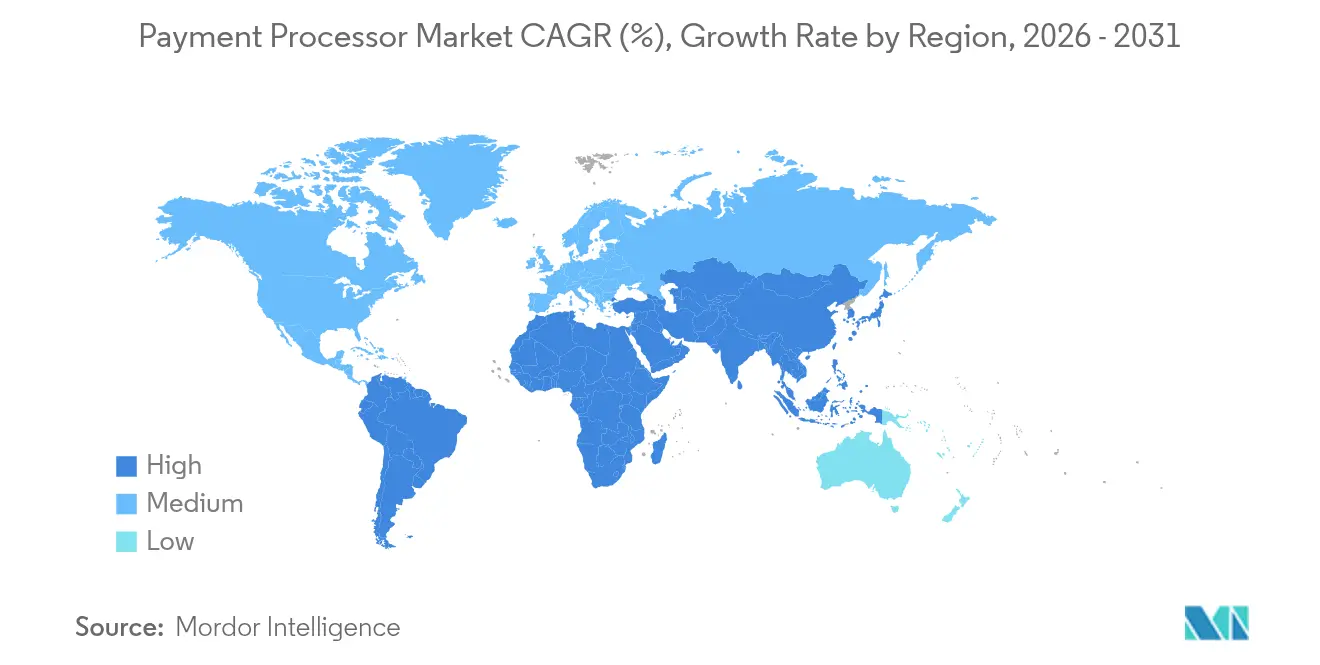
- By geography, North America commanded 29.60% of the payment processor market share in 2025, whereas Asia-Pacific is projected to expand at a 14.25% CAGR through 2031.
Note: Market size and forecast figures in this report are generated using Mordor Intelligence’s proprietary estimation framework, updated with the latest available data and insights as of 2026.
Global Payment Processor Market Trends and Insights
Drivers Impact Analysis*
| Driver | (~) % Impact on CAGR Forecast | Geographic Relevance | Impact Timeline |
|---|---|---|---|
| Rapid Merchant Adoption of Embedded-Finance APIs across North America & Europe | +2.8% | North America & Europe, expanding to APAC | Medium term (2-4 years) |
| Acceleration of Account-to-Account Real-Time Payment Schemes in Asia & Nordics | +2.1% | Asia-Pacific core, Nordic expansion to EU | Long term (≥ 4 years) |
| Open-Banking Mandates Driving Third-Party Processor Volumes in EU & UK | +1.9% | Europe & UK, regulatory spillover to Commonwealth | Medium term (2-4 years) |
| B2B Payment Digitalization among SMBs in Latin America | +1.4% | Latin America, with early adoption in Brazil, Mexico | Short term (≤ 2 years) |
| Cross-Border E-commerce Growth Fueling Multi-Currency Processing Demand | +1.7% | Global, concentrated in trade corridors | Long term (≥ 4 years) |
| Crypto-to-Fiat Gateway Services Enabling New Revenue Streams | +1.2% | North America & Europe, emerging in Asia | Long term (≥ 4 years) |
| Source: Mordor Intelligence | |||
Rapid merchant adoption of embedded-finance APIs transforms revenue models
SaaS platforms integrate issuing, lending and treasury alongside payment acceptance, enabling processors to capture higher-value transactions and earn 40-60% more revenue per merchant versus standalone services. Direct bank relationships and robust compliance frameworks create moat effects as regulators scrutinize fintech-bank partnerships. Mid-market firms gravitate to unified financial stacks that offer operational simplicity, accelerating embedded-finance penetration through the forecast horizon.
Account-to-account real-time schemes reshape cross-border infrastructure
Project Nexus connects India, Malaysia, Philippines, Singapore and Thailand, enabling instant transfers for 1.7 billion inhabitants. Processors integrating ISO 20022 messaging and direct network links gain preferential access to e-commerce marketplaces seeking second-level treasury efficiencies. Real-time rails compress settlement cycles and operational costs, compelling legacy processors to modernize switch architectures or risk disintermediation.
Open-banking mandates generate sustainable third-party processing volumes
EU and UK open-banking payments rose 67% year over year to 27.2 million in March 2025. Variable recurring payments already represent 13% of these transactions, indicating merchants’ shift toward subscription models. Processors benefit from lower interchange costs and richer transaction data supporting cash-flow forecasting and automated reconciliation.
B2B payment digitalization accelerates SMB market penetration
Pix usage in Brazil climbed 74% during 2023 while Mexico’s CoDi adoption broadens. Processors addressing fragmented Latin markets must deliver multi-currency support, localized B2B payment integration and real-time fraud tools that mitigate 20% revenue loss from cross-border fraud.
Restraints Impact Analysis*
| Restraint | (~) % Impact on CAGR Forecast | Geographic Relevance | Impact Timeline |
|---|---|---|---|
| Fragmented Country-Level Licensing in Africa & South-East Asia | -1.8% | Africa & Southeast Asia, regulatory complexity spillover | Long term (≥ 4 years) |
| Rising Network & Interchange Fees Compressing Processor Margins | -2.3% | Global, acute in North America & Europe | Short term (≤ 2 years) |
| Escalating Fraud & Chargeback Liability in Card-Not-Present Channels | -1.5% | Global, concentrated in e-commerce markets | Medium term (2-4 years) |
| Limited Cloud-Infrastructure Redundancy in Emerging Markets | -1.2% | Africa, Southeast Asia, parts of Latin America | Long term (≥ 4 years) |
| Source: Mordor Intelligence | |||
Fragmented licensing creates operational complexity in emerging markets
Tanzania’s 2025 payment-service provider licenses and Cameroon’s broadened service definitions demand separate legal entities and high capital thresholds, raising market-entry costs.
Rising interchange fees compress processor margins despite volume growth
Visa, American Express and Discover plan further fee increases while a proposed USD 30 billion settlement only trims average rates by up to 7 basis points. Processors must absorb higher network charges or risk merchant attrition, especially smaller providers lacking volume leverage.
*Our forecasts treat driver/restraint impacts as directional, not additive. The impact forecasts reflect baseline growth, mix effects, and variable interactions.
Segment Analysis
By Type: Credit cards maintain dominance while e-wallets drive growth innovation
Credit cards delivered 44.55% of payment processor market revenue in 2025 and remain central owing to global acceptance footprints. The payment processor market size for e-wallet transactions is projected to expand at a 14.82% CAGR, targeting USD 25 trillion in wallet volume by 2027. Debit card flows rise through A2A rails, meeting millennial demands for instant fund access. Processors that add stablecoin settlement capture emerging crypto-to-fiat volumes, highlighted by Stripe’s USD 1.1 billion Bridge deal, which positions its platform for compliant stablecoin processing.
Intense competition centers on unified platforms supporting cards, wallets, A2A transfers and regulated digital assets. Legacy networks pursue partnerships over direct blockchain integration, while technology-first processors pursue native crypto rails. Merchants favor orchestration engines that dynamically route traffic toward the lowest-cost or highest-acceptance method, lowering overall tender costs and reducing cart abandonment.


By Component: Solution dominance reflects platform consolidation trends
Solution offerings held 66.35% share in 2025 and will grow 12.1% annually as merchants demand integrated dashboards that combine fraud prevention, reconciliation and compliance workflows. The payment processor market leverages PayFac-as-a-Service models to accelerate merchant onboarding without heavy engineering lifts. Services revenues expand in parallel, yet face pricing pressure due to increasing commoditization.
Global Payments’ 2025 trends report outlines AI-driven service evolution, unified commerce and advanced orchestration as strategic priorities. Vendors that package analytics, lending and payout tools within a single stack capture greater share-of-wallet and lower customer churn, creating stickier revenue streams across the payment processor industry.
By Enterprise Size: SME Growth Outpaces Large Enterprise Adoption
Large enterprises maintain 61.20% market share in 2025, leveraging established procurement processes and complex payment requirements that favor comprehensive processor relationships. However, small and medium enterprises drive market growth at 12.95% CAGR through 2031, reflecting democratized access to sophisticated payment capabilities through embedded finance and self-service onboarding platforms. This growth differential stems from SMEs' ability to adopt new payment technologies without legacy system constraints that slow large enterprise implementation.
The SME segment benefits from processor innovation in areas like earned wage access, automated accounts payable, and integrated lending services that address cash flow challenges beyond basic payment processing. RadNet's implementation of automated invoice processing achieving 100% accuracy rates and reducing payment cycles to under 5 days demonstrates how mid-market businesses leverage payment technology for operational efficiency gains. Payment processors targeting SMEs must balance self-service capabilities with personalized support, as this segment values both technological sophistication and human expertise for complex implementation scenarios
By End-User Industry: Travel Hospitality Leadership Faces Emerging Vertical Disruption
Travel and hospitality commands 9.70% market share in 2025, reflecting the industry's complex payment requirements including multi-currency processing, split payments, and chargeback management for high-value transactions. However, other end-user industries achieve 13.65% CAGR through 2031, indicating diversification beyond traditional payment-intensive sectors toward verticals like healthcare, utilities, and government services that are undergoing digital transformation. This shift creates opportunities for processors developing industry-specific solutions addressing unique compliance, workflow, and integration requirements.
Healthcare payment processing demonstrates vertical-specific complexity through four distinct transaction types: patient refunds, insurance reimbursements, supplier payments, and employee wages, each requiring different processing capabilities and compliance frameworks CommerceHealthcare. Government payment digitalization accelerates with nearly 43% of payments in the U.S. and Canada expected to be cashless by 2025, driven by citizen convenience demands and operational efficiency requirements
Geography Analysis
North America’s 29.60% payment processor market share in 2025 reflects highly penetrated card networks, entrenched processor relationships and a transparent regulatory environment. Growth centers on modernization rather than expansion, with AI-driven fraud tools and FedNow participation adding marginal volume. Ongoing litigation around interchange and evolving stablecoin frameworks introduces near-term strategic uncertainty for incumbents.
Asia-Pacific leads future growth with a 14.25% CAGR through 2031, driven by real-time payment links, mobile-first consumption and cross-border e-commerce. Japan mandates 3-D Secure from April 2025 to curb fraud that reached JPY 54.09 billion (USD 360 million) in 2023. Cashless ratios reached 39.3% in 2023, pushing toward an 80% target. Regional processors that integrate local wallets, QR-code rails and multi-currency settlement benefit from merchant demand for seamless cross-border capability.
Europe shows mixed trends as PSD3 and the Payment Services Regulation strengthen consumer protection while broadening third-party access to banking infrastructure. Latin America remains a patchwork: cash and credit cards each hold 29% at the point of sale, yet instant A2A schemes such as Pix logged 74% usage growth.
Africa and the Middle East present long-run upside yet face licensing fragmentation that inflates setup costs and prolongs time to revenue.

Competitive Landscape
The payment processor market balances moderate concentration with rising fragmentation. Four legacy platforms—Fiserv, Global Payments, J.P. Morgan and Worldpay—still process the majority of U.S. merchant volume, yet technology-led competitors such as Adyen and Stripe each now surpass USD 1 trillion in annual throughput. Strategic acquisitions shape scale economics: Global Payments agreed to buy Worldpay for USD 22.7 billion, creating a combined entity that will handle USD 3.7 trillion in annual volume after divesting issuer assets for USD 13.5 billion. Stripe broadened stablecoin capability through its USD 1.1 billion Bridge purchase and expanded Web3 wallets by acquiring Privy.
Network initiatives also drive differentiation. Mastercard partnered with Thought Machine to accelerate banking-core deployments, while Payrails joined Mastercard to co-create enterprise payment orchestration products. Worldpay added AI-native fraud prevention by acquiring Ravelin, and Corpay expanded cross-border reach through GPS. The competitive edge now lies in unified platforms combining acceptance, fraud, reconciliation and embedded finance rather than point solutions, pushing smaller providers toward niche vertical specializations.
Payment Processor Industry Leaders
PayPal Holdings, Inc.
Due Inc.
Square Inc.
Adyen N.V.
Stripe Inc.
- *Disclaimer: Major Players sorted in no particular order

Recent Industry Developments
- June 2025: Stripe acquired crypto wallet start-up Privy to add embedded wallet functionality that removes external wallet requirements and supports 75 million existing accounts
- June 2025: Shopify partnered with Coinbase to roll out USD Coin (USDC) payments on Base network, offering 1% cash-back incentives and local currency settlement to merchants.
- June 2025: OnePay and Synchrony announced a dual credit card program with Walmart inside the OnePay app, targeting fall 2025 launch.
- April 2025: Global Payments agreed to acquire Worldpay for USD 22.7 billion while divesting issuer solutions for USD 13.5 billion to streamline focus on merchant acquiring.


Global Payment Processor Market Report Scope
The scope of the study analyzes the payments landscape globally to analyze the growth of payment processors across all geographies. A payment processing company acts as a bridge connecting the seller, buyer, and the banks and financial service providers to assist the sellers in accepting the gains made by the buyers and processing the amount to the seller's account while coordinating with the banks and the financial service providers. It accepts payments via different payment methods, such as credit/debit cards, mobile wallets/e-wallets, and many others.
The market covers the emerging trends in payment processing segmented by payment type adopted across different regions studied. The scope of the study is currently focused on key countries in regions such as North America, Europe, Asia-Pacific, Latin America, and Middle East & Africa.
The study also incorporates the impact of the COVID-19 pandemic on the future growth prospect of the market.
The Payment Processor Market is Segmented by Type (Credit Cards, Debit Cards, e-Wallet Transactions) and Geography (North America (United States, Canada), Europe (United Kingdom, Germany, France, Rest of Europe), Asia Pacific (China, India, Japan, South Korea, Rest of Asia Pacific), Rest of the World).
The market sizes and forecasts are provided in terms of value in USD million for all the above segments.
| Credit Card |
| Debit Card |
| e-Wallet Transactions |
| Solution |
| Services |
| Large Enterprises |
| Small and Medium Enterprises |
| Retail and E-commerce |
| Travel and Hospitality |
| Food and Beverage |
| Healthcare |
| Utilities and Government |
| Other End-user Industries |
| North America | United States |
| Canada | |
| Mexico | |
| Europe | United Kingdom |
| Germany | |
| France | |
| Nordics | |
| Rest of Europe | |
| Asia-Pacific | China |
| India | |
| Japan | |
| South Korea | |
| Rest of Asia-Pacific | |
| South America | Brazil |
| Argentina | |
| Rest of South America | |
| Middle East | Saudi Arabia |
| United Arab Emiartes | |
| Qatar | |
| Turkey | |
| Rest of Middle East | |
| Africa | South Africa |
| Nigeria | |
| Rest of Africa |
| By Type | Credit Card | |
| Debit Card | ||
| e-Wallet Transactions | ||
| By Component | Solution | |
| Services | ||
| By Enterprise Size | Large Enterprises | |
| Small and Medium Enterprises | ||
| By End-user Industry | Retail and E-commerce | |
| Travel and Hospitality | ||
| Food and Beverage | ||
| Healthcare | ||
| Utilities and Government | ||
| Other End-user Industries | ||
| By Geography | North America | United States |
| Canada | ||
| Mexico | ||
| Europe | United Kingdom | |
| Germany | ||
| France | ||
| Nordics | ||
| Rest of Europe | ||
| Asia-Pacific | China | |
| India | ||
| Japan | ||
| South Korea | ||
| Rest of Asia-Pacific | ||
| South America | Brazil | |
| Argentina | ||
| Rest of South America | ||
| Middle East | Saudi Arabia | |
| United Arab Emiartes | ||
| Qatar | ||
| Turkey | ||
| Rest of Middle East | ||
| Africa | South Africa | |
| Nigeria | ||
| Rest of Africa | ||


Key Questions Answered in the Report
What is the current size of the payment processor market?
The payment processor market size reached USD 71.15 billion in 2026 and is forecast to grow to USD 122.08 billion by 2031.
Which region is growing fastest in the payment processor market?
Asia-Pacific leads with a 14.25% CAGR through 2031, driven by real-time rail adoption and cross-border e-commerce expansion.
How are embedded-finance APIs influencing payment processors?
SaaS platforms now derive more than 50% of revenue from embedded payments, allowing processors that integrate issuing and lending tools to earn up to 60% higher revenue per merchant.
Why are interchange fees considered a restraint for processors?
Card network fee increases outpace negotiated processor margins, and a proposed settlement only slightly lowers rates, compressing profitability.
What strategic moves define competition among leading processors?
Acquisitions such as Global Payments–Worldpay and Stripe–Bridge, plus AI-driven fraud and stablecoin capabilities, signal a pivot toward unified platforms and embedded finance features.
How big is the opportunity in e-wallet transactions?
E-wallets are growing at a 14.82% CAGR and are expected to facilitate USD 25 trillion in transaction value by 2027, creating a rapid-growth lane for innovative processors.
Page last updated on:


