Market Overview
| Study Period | 2020 - 2031 |
|---|---|
| Forecast Data Period | 2026 - 2031 |
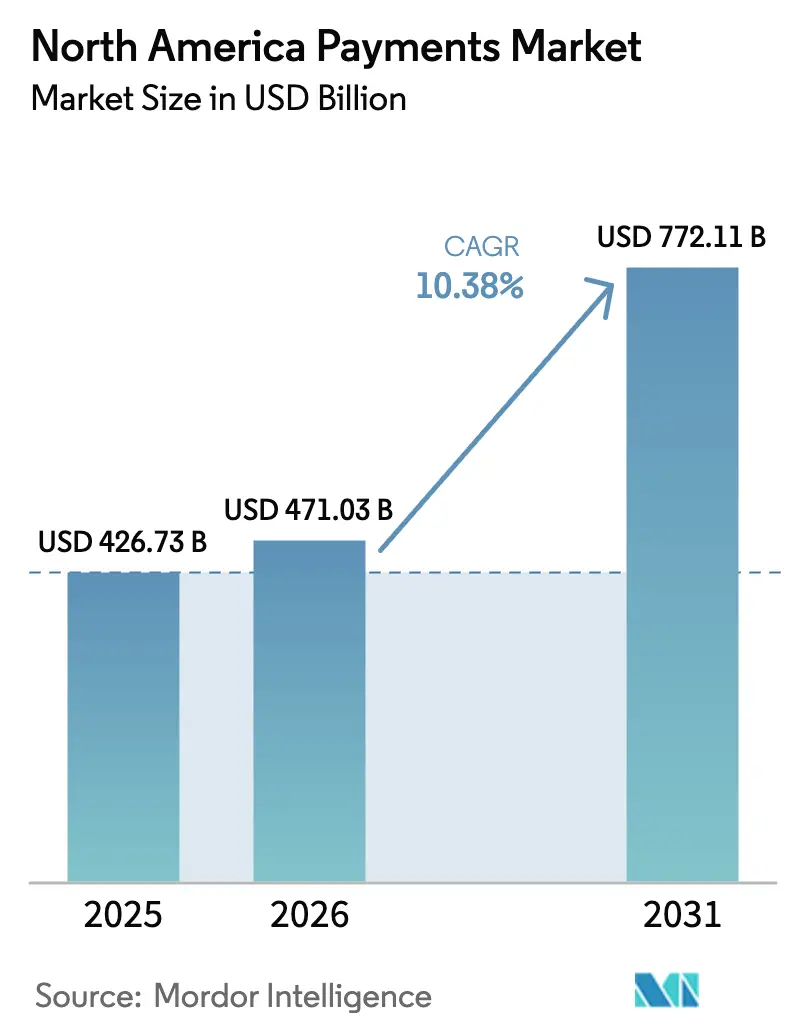
| Base Year Market Size (2025) | USD 426.73 Billion |
| Market Size (2026) | USD 471.03 Billion |
| Market Size (2031) | USD 772.11 Billion |
| Growth Rate (2026 - 2031) | 10.38% CAGR |
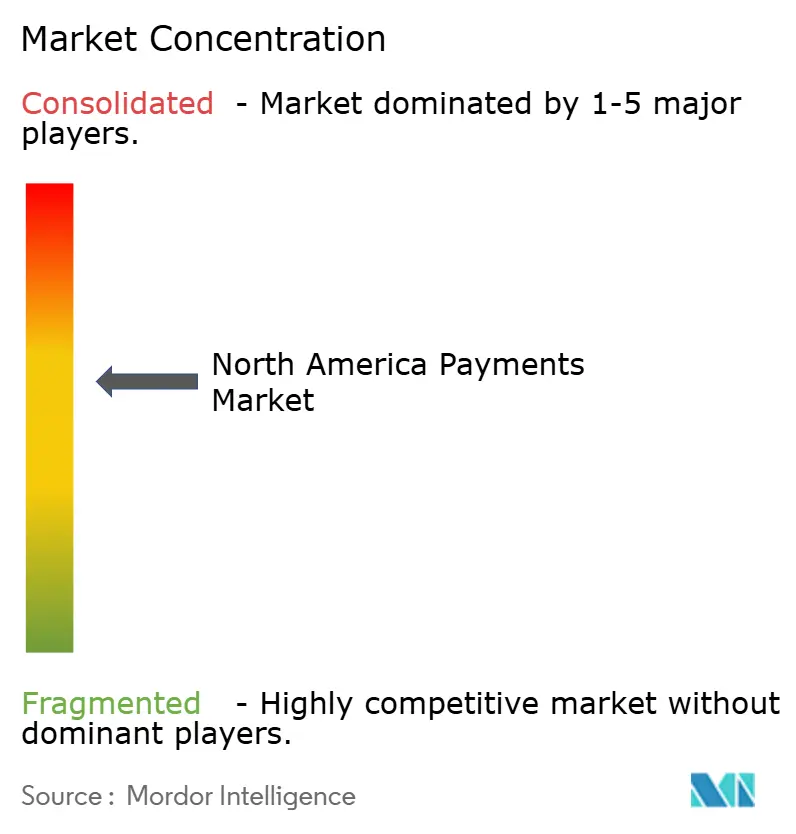
| Market Concentration | Medium |
Major Players *Disclaimer: Major Players sorted in no particular order Image © Mordor Intelligence. Reuse requires attribution under CC BY 4.0. | |
North America Payments Market Analysis by Mordor Intelligence
The North America payments market size was valued at USD 426.73 billion in 2025 and estimated to grow from USD 471.03 billion in 2026 to reach USD 772.11 billion by 2031, at a CAGR of 10.38% during the forecast period (2026-2031). Growth stems from the accelerated roll-out of real-time rails, particularly the FedNow Service, which processed 1.31 million transactions worth USD 48.6 billion in Q1 2025.[1]Federal Reserve Board, “Quarterly FedNow Service Report,” federalreserve.gov Regulatory actions such as the Truth in Lending Act’s extension to Buy Now, Pay Later (BNPL) providers from July 2024 reshape the region’s USD 100 billion BNPL segment.[2]Consumer Financial Protection Bureau, “Truth in Lending Act BNPL Interpretive Rule,” consumerfinance.gov Merchant demand for immediate settlement is steering volume toward online digital wallets and account-to-account transfers, while network tokenization has issued 11.5 billion tokens to reduce card-not-present fraud. Canada’s faster payment modernization, including 86% digital transaction share, supports regional scale-up. Ongoing interchange-fee litigation against Visa and Mastercard and a Department of Justice antitrust suit add uncertainty yet incentivize innovation in lower-cost rails.
Key Report Takeaways
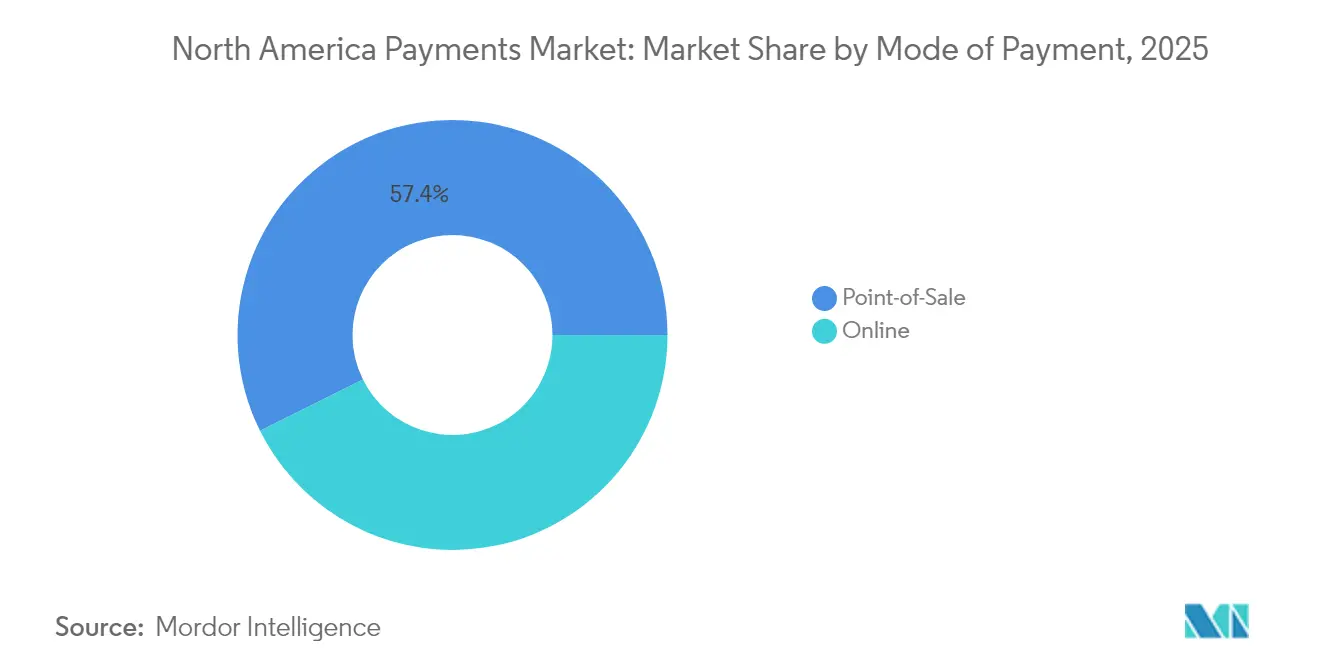
- By mode of payment, point-of-sale card transactions held 40.72% of the North America payments market share in 2025; online digital wallet and A2A transfers show the highest growth at 15.36% CAGR through 2031. Overall Point-of-Sale led with 57.35% revenue share.
- By interaction channel, point-of-sale retained 54.62% revenue share in 2025, whereas e-commerce and m-commerce are projected to register 13.01% CAGR to 2031.
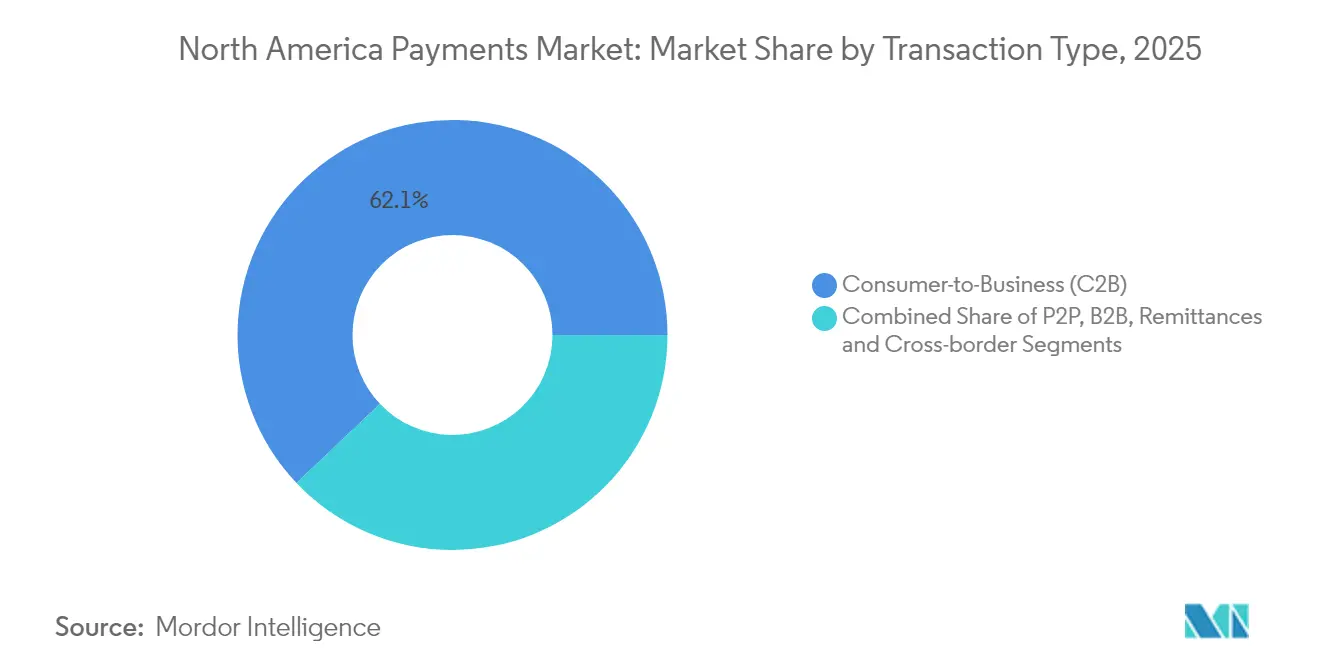
- By transaction type, consumer-to-business dominated with 62.08% share in 2025, while cross-border remittances expand at a 15.02% CAGR through 2031.
- By end-user industry, retail led with 38.15% revenue share in 2025; healthcare is the fastest-growing segment at 12.84% CAGR to 2031.
- By country, the United States accounted for 70.55% revenue share in 2025, whereas Canada is forecast to post the highest 11.62% CAGR through 2031.
Note: Market size and forecast figures in this report are generated using Mordor Intelligence’s proprietary estimation framework, updated with the latest available data and insights as of 2026.
North America Payments Market Trends and Insights
Drivers Impact Analysis*
| Driver | (~) % Impact on CAGR Forecast | Geographic Relevance | Impact Timeline |
|---|---|---|---|
| Real-Time Rail Roll-out (FedNow, RTR) Accelerating Instant Payments Adoption | +2.1% | United States core, spillover to Canada & Mexico | Medium term (2-4 years) |
| BNPL Penetration Driving High-Ticket Online Transactions | +1.8% | North America, concentrated in urban centers | Short term (≤ 2 years) |
| Cross-Border Ecommerce Growth into Canada via US Platforms | +1.3% | US-Canada corridor, expanding to Mexico | Medium term (2-4 years) |
| Network Tokenization Reducing CNP Fraud & Boosting Card-on-File Volumes | +1.7% | Global, with North America leading adoption | Long term (≥ 4 years) |
| Tap-to-Pay on Mobile Unlocking SME Acceptance in U.S. & Canada | +1.5% | North America, rural and urban SME segments | Short term (≤ 2 years) |
| Corporate AP Automation Shifting B2B Spend to Virtual Cards | +1.9% | North America, enterprise and mid-market focus | Medium term (2-4 years) |
| Source: Mordor Intelligence | |||
Real-time rail roll-out accelerating instant payments adoption
FedNow expanded from 35 launch banks to more than 900 institutions by August 2024, with community banks representing 78% of participants. Businesses and consumers alike increased faster-payment use in 2023, setting the foundation for a regional shift away from legacy ACH in favor of irrevocable, immediate settlement. Early adopters such as MSU Federal Credit Union logged a 643% rise in volume year-over-year, underscoring strong demand among gig-economy workers. The resulting ubiquity of instant rails positions the market to compete internationally with systems such as PIX and UPI, improving liquidity management and supporting new treasury products.
BNPL penetration driving high-ticket online transactions
About 21% of Americans used BNPL by end-2022, and the product is projected to reach 12% of United States e-commerce sales by 2025.[3]Harvard Kennedy School, “The Future of BNPL,” hks.harvard.edu Regulation Z now imposes credit card-style statements and dispute rights, raising compliance costs. Providers with adequate scale can internalize these costs, consolidating market share while smaller players likely seek partnerships. Mexico’s 32% projected BNPL CAGR through 2028 points to cross-border expansion potential, but capital-light entrants face heightened scrutiny on consumer debt transparency.
Cross-border e-commerce growth into Canada via US platforms
Canada processed USD 11.9 trillion in payments across 21.7 billion transactions in 2023, with e-commerce totaling USD 71.6 billion, or 5.7% of retail sales. Contactless now constitutes 53% of Canadian transactions, evidencing consumer readiness for faster online checkout. Harmonized real-time rails could strip out currency conversion lags that burden small merchants, creating share opportunities in corridors historically served by wire transfers.
Network tokenization reducing CNP fraud
Visa’s 11.5 billion tokens replaced primary account numbers for card-not-present use cases by end-2024. EMV tokenization enhances approval rates, fortifies merchant data storage, and mitigates breach fallout. Research by the Kansas City Federal Reserve confirms a continued decline in card-present fraud after EMV chip migration, with tokenization extending comparable safeguards to digital commerce. Token life-cycle management requires scale investments, thereby reinforcing incumbent network advantages.
Restraints Impact Analysis*
| Restraint | (~) % Impact on CAGR Forecast | Geographic Relevance | Impact Timeline |
|---|---|---|---|
| Increasing Interchange-Fee Litigation Risk | -1.4% | United States core, regulatory spillover effects | Long term (≥ 4 years) |
| Real-Time Fraud & Authorized Push-Payment (APP) Scams | -0.9% | North America, concentrated in instant payment corridors | Short term (≤ 2 years) |
| Processor & Core Modernization Cost Overruns for Mid-Tier Banks | -1.2% | United States and Canada, mid-tier financial institutions | Medium term (2-4 years) |
| Source: Mordor Intelligence | |||
Increasing interchange-fee litigation risk
A federal judge rejected Visa and Mastercard’s proposed USD 30 billion interchange settlement in June 2024, prolonging two decades of merchant litigation. The separate USD 5.54 billion class action covering 2004-2019 fees remains open to claims until February 2025. Annual interchange exceeded USD 100.8 billion in 2023, amplifying calls for fee caps and routing choice under the Credit Card Competition Act. Prolonged legal exposure diverts capital from innovation and could incentivize merchants to steer volume toward lower-cost real-time rails.
Real-time fraud and authorized push-payment scams
Irrevocable settlement elevates the risk of socially engineered transfers. FedNow’s rapid uptake enlarges the threat surface, forcing banks to deploy 24/7 behavioral analytics. Visa has invested USD 3 billion in artificial intelligence to counter emerging fraud vectors. Education campaigns and device-based risk scoring add friction for first-time payees, balancing convenience with security.
*Our forecasts treat driver/restraint impacts as directional, not additive. The impact forecasts reflect baseline growth, mix effects, and variable interactions.
Segment Analysis
By Mode of Payment: Digital Wallets Challenge Card Dominance
Point-of-sale card payments accounted for 40.72% of the North America payments market share in 2025. Overall Point-of-Sale led with 57.35% revenue share. Online digital wallets and account-to-account alternatives are expanding at 15.36% CAGR through 2031 as merchants pursue faster funding cycles and lower fees. Federal Reserve data shows a 31% rise in business digital-wallet use during 2023. Contactless capability reached 69% of issued debit cards in 2024 and will reach near universality by 2027.
The convergence of wallet tokens with network security reduces the acceptance gap between cards and A2A rails. Cash volumes in Canada rose 15% in 2023 despite digital gains, illustrating consumer preference for optionality. Tokenization allows recurring subscription providers to store credentials securely, blending card utility with wallet convenience.


By Interaction Channel: E-commerce Momentum Accelerates
Point-of-sale transactions still generate 54.62% of revenue yet e-commerce and m-commerce are projected to grow at 13.01% CAGR to 2031. Canada’s USD 71.6 billion online spend in 2023 underlines cross-border scale as United States merchants deploy localized checkout flows. Contactless adoption (53% of Canadian transactions) reflects user comfort with proximity tech, smoothing the offline–online divide.
Consumers show clear appetite for omnichannel journeys. Seventy-four percent favor faster payments from their primary bank, yet large shares remain open to fintech alternatives. Tap-to-pay on mobile reduces hardware costs for small merchants and extends acceptance in rural geographies, bringing new users into the North America payments market.
By Transaction Type: Cross-Border Remittances Outpace Domestic Commerce
Consumer-to-business flows held 62.08% share in 2025, but cross-border remittances are growing at a 15.02% CAGR. Visa Direct processed nearly 10 billion payouts in 2024, linking 11 billion endpoints, and cross-border volume advanced 16% year-on-year. Real-time rails cut settlement windows, enabling payroll, gig-economy payouts, and diaspora remittances.
Corporate procurement is also digitizing. Citizens Bank finds 94% of midsize executives plan to adopt exclusively digital payments within five years. Virtual cards are forecast to reach USD 452 billion in US commercial spend by 2027, shifting business-to-business routines toward card-based automation.
By End-user Industry: Healthcare Digitization Drives Cost Reduction
Retail retained 38.15% of revenue in 2025 owing to scale, yet healthcare shows the fastest 12.84% CAGR. Electronic claim payments rose 8% in 2023 and could save USD 803 million annually if fully adopted. Integrated payer-provider models covering 75% of insured lives accelerate adoption of automated remittance and patient billing portals.
Other verticals such as entertainment and utilities maintain steady gains as subscription and invoice platforms normalize card-on-file and A2A options. Government agencies are modernizing legacy payment platforms under open-banking mandates, opening further use cases for instant settlement and identity-verified disbursements.
Geography Analysis
The United States leads with 70.55% share due to economic scale and dense issuer-acquirer connectivity. FedNow’s reach across more than 900 institutions elevates liquidity for businesses and households, driving wider adoption of instant payroll, bill-pay, and treasury products. Visa generated USD 35.9 billion in net revenue for fiscal 2024, consistently reinvesting in AI-led fraud tools to sustain approval rates and mitigate regulatory headwinds.
Canada delivers the region’s highest growth trajectory as Real-Time Rail comes online and interlinks with global schemes. The nation cleared USD 11.9 trillion in payments in 2023, and contactless represents more than half of all consumer transactions. Banks and payment service providers position themselves to monetize cross-border flows through low-cost FX, reducing reliance on wire transfers.
Mexico remains a high-potential frontier characterized by cash dominance and fast fintech innovation. Projected digital-payments value of USD 167.85 billion by 2028 illustrates accelerating wallet adoption. Regulatory licensing under the 2018 fintech law channels competition toward well-capitalized firms, prompting global players to ally with local banks for distribution and compliance.
Competitive Landscape
The North America payments market is moderately concentrated, anchored by global card networks yet challenged by bank consortiums, big-tech entrants, and vertically focused fintechs. Visa captured USD 19.7 billion in net income on USD 35.9 billion revenue for fiscal 2024, funding the acquisition of Featurespace to embed real-time AI fraud prevention. Litigation risk combines with DOJ scrutiny to pressure interchange models, motivating network investment in secure tokens and value-added services that justify fees.
Fintech disruptors exploit niche use cases. BNPL providers seek to differentiate via omnichannel acceptance and credit bureau reporting enhancements to comply with Regulation Z. B2B platforms automate payables and integrate virtual cards to earn interchange while lowering client processing costs. Real-time payment orchestrators deliver application programming interfaces that abstract complexity across FedNow, ACH, and card rails, enabling software firms to embed payouts without direct bank integrations.
Incumbent banks respond through consortia such as Early Warning’s Zelle and by integrating FedNow gateways directly into core processors. Processor acquirers invest in point-of-interaction software that converts smartphones into tap-to-pay terminals, extending acceptance to micro-merchants and reinforcing network volume.
North America Payments Industry Leaders
PayPal Holdings Inc.
Visa Inc.
Mastercard Incorporated
Dwolla, Inc.
Amazon.com, Inc.
- *Disclaimer: Major Players sorted in no particular order

Recent Industry Developments
- April 2025: Visa finalized its acquisition of Featurespace, adding adaptive behavioral analytics to combat real-time fraud.
- January 2025: The Federal Reserve confirmed FedNow processed 1.31 million transactions worth USD 48.6 billion in Q1 2025.
- December 2024: CFPB updated BNPL FAQs under Regulation Z. Strategy. It will clarify operational requirements to mitigate compliance risk and support sustainable BNPL scaling.
- August 2024: FedNow surpassed 900 participating institutions. It highlight community-bank uptake to counter perceptions that real-time payments favor large incumbents.


North America Payments Market Report Scope
Payment instruments are mechanisms that allow monies in accounts at credit, payment, or similar organizations to be transferred to a payee in response to a payment order. Credit transfer, check payment, direct debit, and a cash deposit are the most common payment methods. Credit transfer is the payment technique of transferring credit from one bank to another. The North American payments market is segmented by mode of payment (point of sale (card payments, digital wallet, cash, others), online sale (card payments, digital wallet, others)), and end-user industries (retail, entertainment, healthcare, hospitality, others) and geography (U.S. and Canada).
The market scope excludes online purchases of motor vehicles, real estate, utility bill payments (such as water, heating, and electricity), mortgage payments, loans, credit card bills, or purchases of shares and bonds. As for Point-of-Sale, all transactions that occur at the physical point of sale are included in the market scope. It includes traditional in-store transactions and all face-to-face transactions regardless of the location of the transaction. Cash is also considered for both cases (cash-on-delivery for e-commerce sales).
The market sizes and forecasts are provided in terms of value (USD) for all the above segments.
Segmentation by Mode of Payment
| Point-of-Sale | Card (Debit, Credit, Pre-paid) |
| Digital Wallets (Apple Pay, Google Pay, Interac Flash) | |
| Cash | |
| Other POS (Gift-cards, QR, Wearables) | |
| Online | Card (Card-Not-Present) |
| Digital Wallet and Account-to-Account (Interac e-Transfer, PayPal) | |
| Other Online (COD, BNPL, Bank Transfer) |
Segmentation by Interaction Channel
| Point-of-Sale |
| E-commerce/M-commerce |
Segmentation by Transaction Type
| Person-to-Person (P2P) |
| Consumer-to-Business (C2B) |
| Business-to-Business (B2B) |
| Remittances and Cross-border |
Segmentation by End-user Industry
| Retail |
| Entertainment and Digital Content |
| Healthcare |
| Hospitality and Travel |
| Government and Utilities |
| Other End-user Industries |
By Country
| United States |
| Canada |
| Mexico |
| Segmentation by Mode of Payment | Point-of-Sale | Card (Debit, Credit, Pre-paid) |
| Digital Wallets (Apple Pay, Google Pay, Interac Flash) | ||
| Cash | ||
| Other POS (Gift-cards, QR, Wearables) | ||
| Online | Card (Card-Not-Present) | |
| Digital Wallet and Account-to-Account (Interac e-Transfer, PayPal) | ||
| Other Online (COD, BNPL, Bank Transfer) | ||
| Segmentation by Interaction Channel | Point-of-Sale | |
| E-commerce/M-commerce | ||
| Segmentation by Transaction Type | Person-to-Person (P2P) | |
| Consumer-to-Business (C2B) | ||
| Business-to-Business (B2B) | ||
| Remittances and Cross-border | ||
| Segmentation by End-user Industry | Retail | |
| Entertainment and Digital Content | ||
| Healthcare | ||
| Hospitality and Travel | ||
| Government and Utilities | ||
| Other End-user Industries | ||
| By Country | United States | |
| Canada | ||
| Mexico | ||


Key Questions Answered in the Report
What is the current size of the North America payments market?
The market stood at USD 471.03 billion in 2026 and is forecast to reach USD 772.11 billion by 2031.
Which payment mode is growing the fastest?
Online digital wallets and account-to-account transfers are expanding at a 15.36% CAGR through 2031, outpacing card growth.
Why is healthcare the fastest-growing end-user segment?
Healthcare payments benefit from electronic funds transfer mandates that can save USD 803 million annually, driving a 12.84% CAGR.
How will interchange-fee litigation influence market dynamics?
Ongoing lawsuits could compress card margins and accelerate merchant migration to real-time or wallet-based alternatives with lower fees.
What role does FedNow play in competitive strategy?
FedNow’s instant-settlement capability gives banks and fintechs a low-latency rail to develop new treasury, payroll, and disbursement products.
Which country is projected to grow the fastest in North America?
Canada is expected to register an 11.62% CAGR through 2031 thanks to digital-payment adoption and forthcoming Real-Time Rail integration.
Page last updated on:


