
Market Overview
| Study Period | 2020 - 2031 |
|---|---|
| Forecast Data Period | 2026 - 2031 |
| Base Year Market Size (2025) | USD 7.84 Billion |
| Market Size (2026) | USD 9.46 Billion |
| Market Size (2031) | USD 24.14 Billion |
| Growth Rate (2026 - 2031) | 20.62 % |
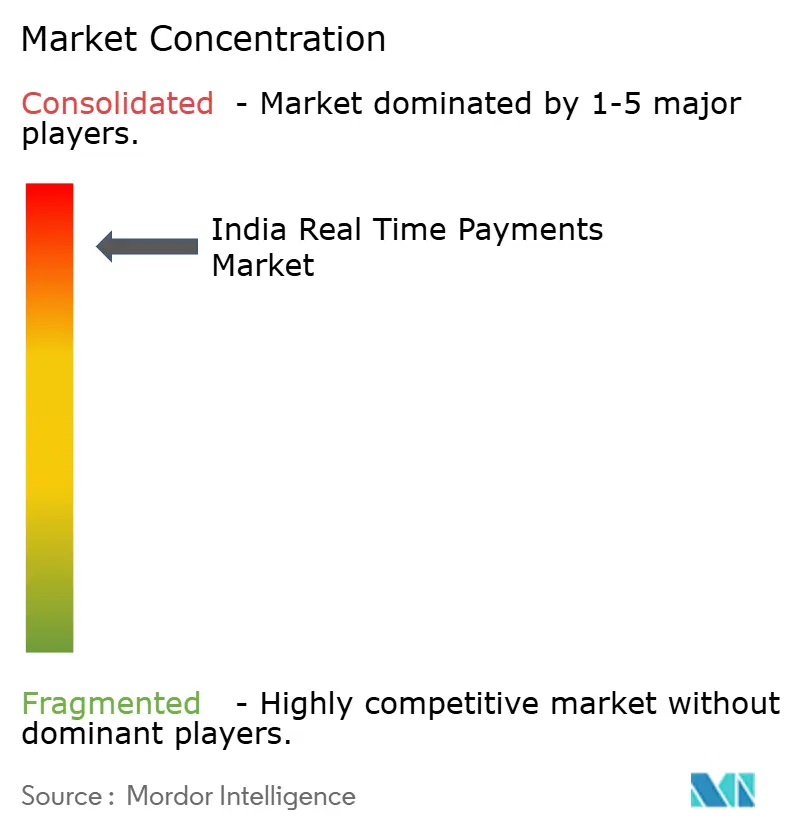
| Market Concentration | High |
Major Players *Disclaimer: Major Players sorted in no particular order Image © Mordor Intelligence. Reuse requires attribution under CC BY 4.0. | |
India Real Time Payments Market Analysis by Mordor Intelligence
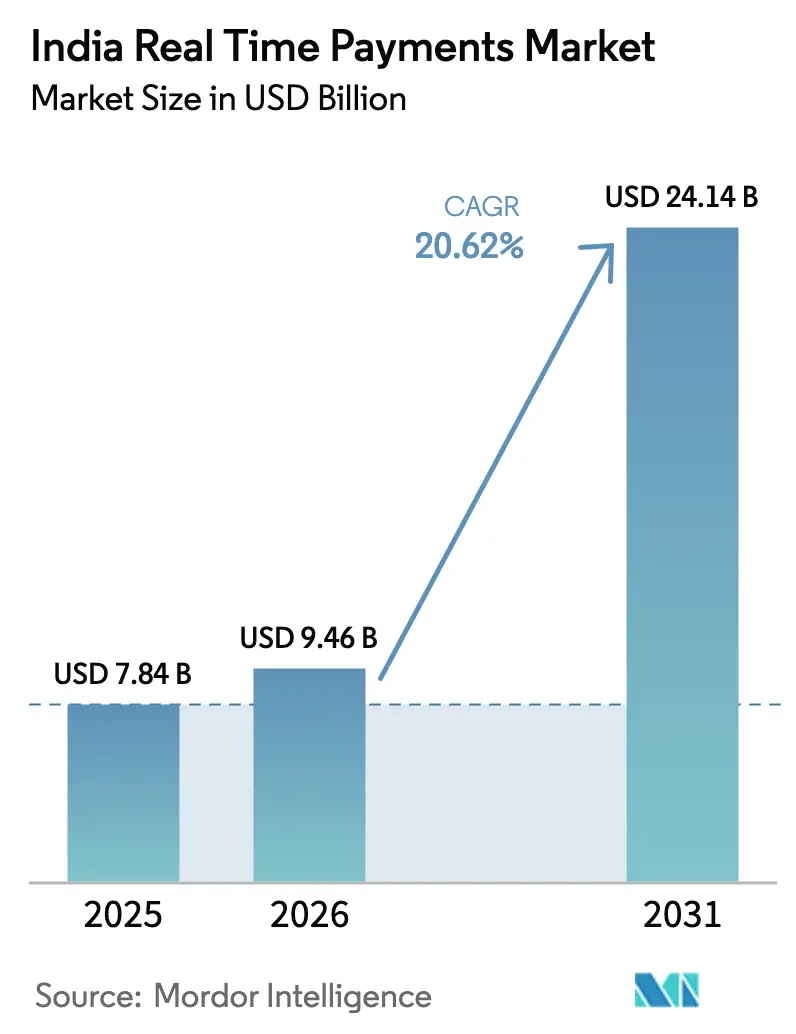
The India real-time payments market size was valued at USD 7.84 billion in 2025 and estimated to grow from USD 9.46 billion in 2026 to reach USD 24.14 billion by 2031, at a CAGR of 20.62% during the forecast period (2026-2031). Exceptional transaction velocity on the Unified Payments Interface (UPI) platform, supportive government incentives, and rapid merchant onboarding continue to reshape the competitive order. Interoperable innovations such as UPI-123PAY and the recent linkage of RuPay credit cards to UPI have expanded addressable demand across device categories and income segments. The National Payments Corporation of India’s (NPCI) target of 1 billion daily UPI transactions, already eclipsing Visa’s global volumes, underscores the structural shift away from card rails toward instant account-to-account payments.[1]Press Information Bureau, “Government Extends Incentive Scheme for Low-Value UPI Transactions,” pib.gov.in Intensifying rivalry among payment service providers (PSPs) is evident in aggressive cash-back programs, ubiquitous QR-code roll-outs, and an escalating race to embed lending, insurance, and wealth products within day-to-day payment flows, further broadening revenue opportunities for ecosystem participants.
Key Report Takeaways
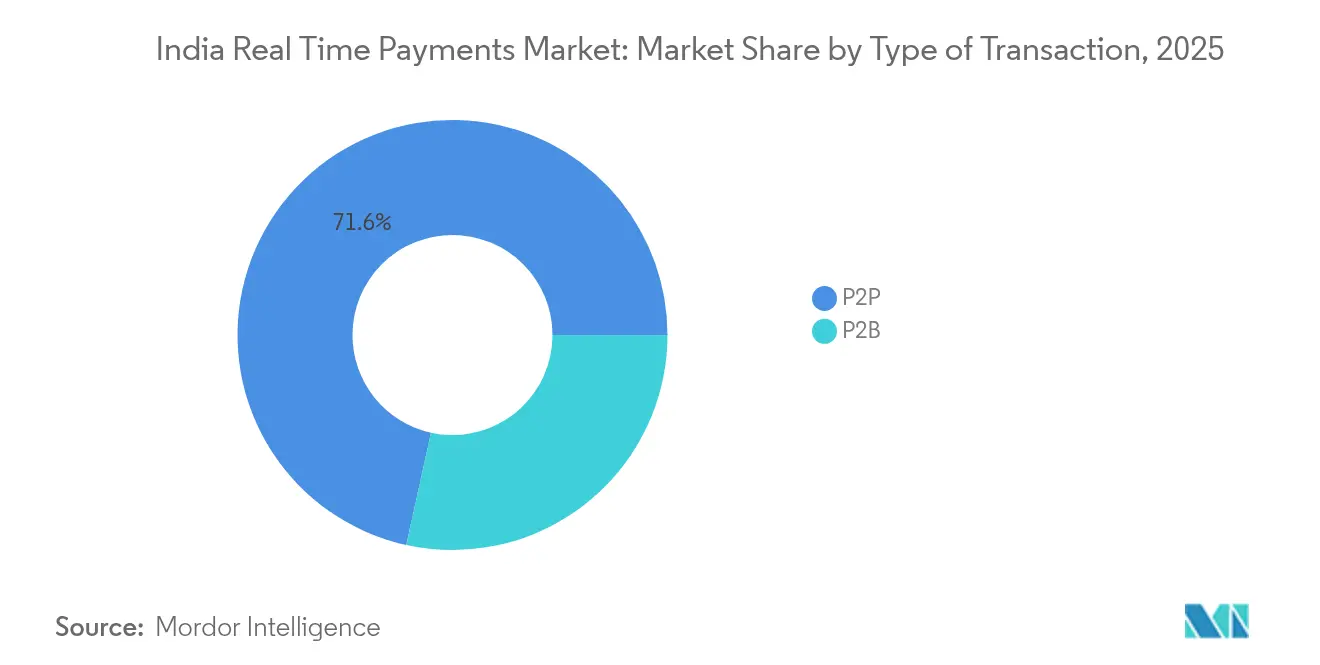
- By transaction type, peer-to-peer (P2P) transfers led with 71.55% of India real-time payments market share in 2025, whereas peer-to-business (P2B) transactions are poised for the fastest 23.85% CAGR through 2031.
- By component, platform/solution offerings captured 63.20% of the 2025 India real-time payments market size, while value-added services are forecast to expand at a 28.05% CAGR.
- By deployment mode, cloud implementations commanded 77.90% share of the India real-time payments market size in 2025 and remain central to scaling spikes in daily volumes; on-premise solutions record the highest projected 21.7% CAGR to 2031.
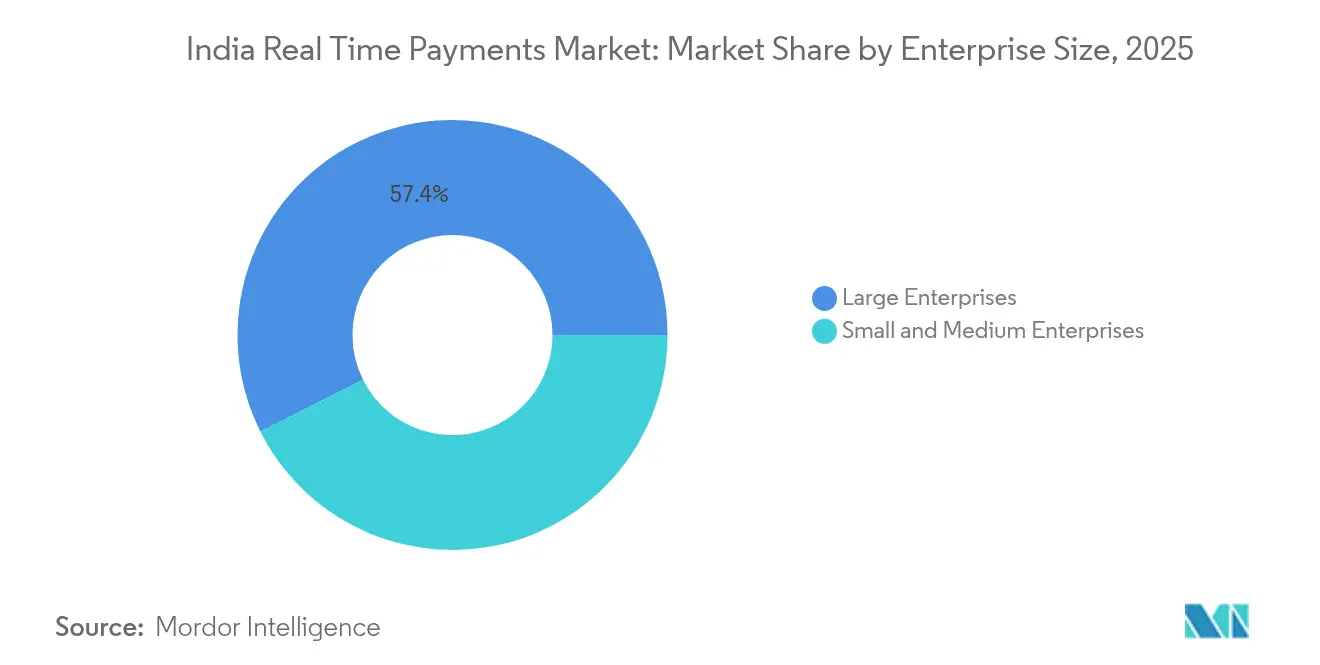
- By enterprise size, large organizations retained 57.40% revenue share in 2025, yet small and medium enterprises (SMEs) are accelerating at 25.5% CAGR on the back of zero merchant discount-rate policies.
- By end-user industry, retail & e-commerce accounted for 32.10% revenue in 2025, while the government and public-sector vertical is expected to advance at 27.75% CAGR through 2031.
Note: Market size and forecast figures in this report are generated using Mordor Intelligence’s proprietary estimation framework, updated with the latest available data and insights as of 2026.
India Real Time Payments Market Trends and Insights
Drivers Impact Analysis*
| Driver | (~) % Impact on CAGR Forecast | Geographic Relevance | Impact Timeline |
|---|---|---|---|
| Surge in UPI adoption driven by NPCI incentives and merchant cash-backs | +4.2% | National, with higher impact in tier-2/3 cities | Medium term (2-4 years) |
| Government-mandated interoperability via UPI-123PAY | +3.8% | National, focused on rural and semi-urban areas | Long term (≥ 4 years) |
| Instant settlement demand from gig-economy platforms drives the market | +2.9% | Urban centers, expanding to tier-2 cities | Short term (≤ 2 years) |
| QR-based offline payments growth in Tier-3/4 towns drives the market | +3.5% | Tier-3/4 cities and rural areas | Medium term (2-4 years) |
| RuPay credit-card linkage on UPI boosts ticket size | +2.1% | Urban and semi-urban areas | Medium term (2-4 years) |
| Source: Mordor Intelligence | |||
Surge in UPI adoption driven by NPCI incentives and merchant cash-backs
Cash-back programs funded by the government’s INR 1,500 crore incentive pool for FY 2024-25 have pushed transaction counts in smaller cities to new highs, with 80% of new UPI users emerging outside metros. The subsidy on sub-INR 2,000 tickets sustains a zero merchant discount rate, motivating kirana stores and street vendors to display QR codes prominently and creating a network-effect flywheel as consumer convenience rises. P2B volumes have consequently grown faster than P2P volumes, and PSPs have lowered customer-acquisition costs by leveraging expanded merchant footprints. NPCI reports a 126% surge in active QR codes during 2H 2024, supplying the physical infrastructure for omnipresent quick-response payments.
Government-mandated interoperability via UPI-123PAY
UPI-123PAY allows India’s 400 million feature-phone users to initiate real-time payments through dual-tone multi-frequency (DTMF) prompts, closing the device-gap that had restricted digital participation in rural districts. Monthly volumes have already exceeded 10 million transactions in early 2025, concentrated in states with sub-40% smartphone penetration. Telecom alliances with BSNL and Airtel ensure unbroken USSD messaging, while NPCI’s common library enables cross-network routing, preventing vendor lock-in and guaranteeing a consistent user experience regardless of PSP brand.
Instant settlement demand from gig-economy platforms drives the market
Food-delivery and ride-hailing platforms have migrated to UPI pay-outs to shrink settlement cycles from weekly batches to real time, cutting working-capital needs by up to 20% and improving driver retention metrics. More than 85% of gig-workers on leading apps now request earnings via instant transfer rails, and embedded micro-credit products layered on these flows are opening fresh revenue lines for PSPs.[2]Reserve Bank of India, “Payment and Settlement Systems in India: Vision 2025,” rbi.org.in
QR-based offline payments growth in tier-3/4 towns
QR adoption in small towns is expanding 175% faster than in metros, as the absence of point-of-sale hardware costs eliminates the final barrier for merchants unwilling to rent traditional terminals.[3]National Payments Corporation of India, “UPI Product Statistics,” npci.org.in RBI-backed pilots using sound-wave tokens and batch upload capabilities allow transactions to clear even when data networks are patchy, broadening the utility of QR for agri-mandi traders and rural provision stores.
Restraints Impact Analysis*
| Restraint | (~) % Impact on CAGR Forecast | Geographic Relevance | Impact Timeline |
|---|---|---|---|
| Rural network latency hitting transaction success rates | -2.8% | Rural and remote areas | Medium term (2-4 years) |
| Fraud via UPI collect requests & screen-scraping apps hinders the market | -1.9% | National, higher impact in urban areas | Short term (≤ 2 years) |
| Interchange disputes curbing PSP monetisation | -1.4% | National, affecting all payment service providers | Long term (≥ 4 years) |
| Source: Mordor Intelligence | |||
Rural network latency hitting transaction success rates
Peak-season failure rates exceed 15% in villages where 4G coverage remains inconsistent, compared to 2-3% in metros. BharatNet’s optical-fiber roll-out, currently 60% complete, promises eventual relief, yet delay-sensitive sectors including agriculture payments continue to experience timeout errors. PSPs are testing edge-computing caches that queue transactions for later synchronization, though the upfront capital is substantial for low-ticket rural traffic.
Fraud via UPI collect requests & screen-scraping apps hinders the market
UPI fraud losses grew 85% year-on-year in FY 25, reaching INR 485 crore, undermining trust among first-time users. From June 2025 NPCI mandates that payer apps display the bank-registered beneficiary name before transfer confirmation. Simultaneously, RBI’s Central Payments Fraud Information Registry offers real-time incident feeds to PSPs, enabling rules-based interdiction of suspected mule accounts within seconds of an alert.
*Our forecasts treat driver/restraint impacts as directional, not additive. The impact forecasts reflect baseline growth, mix effects, and variable interactions.
Segment Analysis
By Transaction Type: P2B Segment Drives Commercial Transformation
P2B accounted for 28.45% of total UPI volume in January 2025 and is sprinting ahead at a 23.85% CAGR. The India real-time payments market size for P2B payments is on track to expand faster than remittance-oriented P2P flows, reflecting new consumer habits such as paying for public transport, street food, and utilities with a single scan. Average P2B ticket value stands at INR 1,471, confirming deeper penetration into micro-transactions. RuPay credit-card integration will add revolving-credit elasticity to P2B spend while maintaining instant confirmation.
P2P nevertheless preserves a dominant 71.55% share of 2025 transactions, illustrating entrenched use cases like salary advances, rent, and family support. Transcontinental remittances facilitated by UPI ties with Nepal and Singapore are set to sustain core P2P relevance, even as the segment’s growth rate normalizes. Rural off-grid households rely on P2P to move harvest proceeds rapidly, underlining the social-inclusion mandate built into the India real-time payments market.



By Component: Services Segment Capitalizes on Platform Maturity
The services layer, forecast to rise at 28.05% CAGR, now comprises fraud analytics, unified reconciliation, and lending APIs. PSPs such as Razorpay launched 40 new service lines in FY 24, showcasing how the zero merchant discount-rate environment is pushing providers up the value pyramid. The India real-time payments market benefits from AI-driven risk models that can score transactions within milliseconds and throttle suspicious flows before they hit settlement.
Platform/solution revenues still contribute 63.20% of the 2025 base and remain the gateway for onboarding newly digital merchants. Modular SDKs and low-code integration kits reduce time-to-market for retailers, creating a funnel from basic acceptance tools to premium SaaS subscriptions. This stacking effect is central to long-term monetization within the India real-time payments industry.
By Deployment Mode: Cloud Infrastructure Dominates Scalability Requirements
With 77.90% share in 2025, cloud environments support daily peaks that often cross 600 million transactions. Public-cloud providers have opened India-specific regions to comply with RBI data-localization norms, encouraging banks to lift-and-shift middleware workloads. During festival periods the elasticity of autoscaling clusters prevents brownouts that would otherwise occur on fixed on-premise servers, safeguarding the reputation of the India real-time payments market.
On-premise deployments grow at 21.7% CAGR, powered by public-sector banks and electricity boards that must retain citizen data within government-owned facilities. Hybrid architectures use cloud bursting for compute-intensive fraud detection while holding personally identifiable information on private racks, combining compliance with cost efficiency.
By Enterprise Size: SMEs Drive Democratization of Digital Payments
SMEs process more than 200 monthly digital transactions today versus fewer than 50 in 2020. Their 25.5% CAGR mirrors a behavioural reset as customers switch from cash to scan-and-pay for groceries and services. Government training camps and zero-fee QR kits lower onboarding friction, making the India real-time payments market central to micro-enterprise formalization.
Large enterprises still hold 57.40% of 2025 value due to high-ticket electric-utility, telecom, and e-commerce payments. They lean on advanced dashboards that reconcile thousands of sub-merchant accounts in real time, optimising treasury operations and cash forecasting. The widening availability of those dashboards to midsize firms will further equalise competitive capabilities across tiers within the India real-time payments market.
By End-User Industry: Government Sector Emerges as Growth Leader
Digital public-finance reforms are propelling a 27.75% CAGR in government usage. Real-time settlement of taxes, fines, and welfare remittances reduces leakage and enhances audit trails, positioning India as a frontrunner in public-sector fintech adoption. Smart metering schemes in electricity distribution companies now default to instant UPI payment links, cementing public-sector volumes in the India real-time payments market.
Retail & e-commerce maintains the largest 32.10% slice of 2025 spend. Seamless checkout flows and contextual embedded credit at the moment of purchase maintain momentum, while BFSI continues integrating programmable payment messaging into core banking stacks. Healthcare, education, and transport corridors such as metro rail are next in line to embed real-time payment triggers, expanding the industry’s surface area.
Geography Analysis
Metropolitan hubs, Mumbai, Delhi, Bengaluru, and Chennai, generated 44.20% of aggregate transaction value in 2025, yet their dominance is tapering as tier-2 and tier-3 cities produce the bulk of new customer sign-ups. The India real-time payments market is therefore pivoting from value concentration in metros toward volume leadership in smaller cities where QR density has crossed 1,000 per square kilometre in dense commercial pockets. State-level initiatives have accelerated rollout; Karnataka and Tamil Nadu sponsor municipal-tax rebates for merchants adopting digital collections, further lifting penetration.
Rural districts registered a leap to 65% digital-payment penetration from less than 20% in 2020. RBI pilots enabling offline UPI through sound-wave tokens and near-field communication have unlocked commerce in network-dark zones. Northern states, Uttar Pradesh, Bihar, Rajasthan, demonstrate the highest latent potential, with agricultural procurement moving toward same-day wallet credit. The India real-time payments market size attributed to these regions is expected to expand rapidly once fibre backhaul under BharatNet approaches full reach.
Cross-border extensions now permit Indian tourists to scan UPI codes in Nepal, Bhutan, and Singapore, broadening foreign-currency inflows for domestic PSPs. Such linkages introduce new settlement complexities but solidify India’s ambition to export its home-grown protocol. Divergent regional preferences persist; southern consumers lean on wallet overlays, whereas northern users prefer direct bank payments. PSPs therefore adapt interface vernacular, settlement windows, and promotional structures to local expectations, a hallmark of geographic granularity within the India real-time payments market.
Regulatory Landscape
The Reserve Bank of India (RBI) and the National Payments Corporation of India (NPCI) anchor governance for domestic real-time rails such as UPI and IMPS, with compliance expectations covering authentication, recurring payments, and operational resilience. In April 2026, RBI issued the Digital Payments, E-mandate Framework, 2026, consolidating recurring-payment requirements across cards, PPIs, and UPI into a single framework that affects how merchants, aggregators, and PSPs design subscription billing and standing instructions.
RBI also formalized authentication controls through the Authentication mechanisms for digital payment transactions Directions, 2025, with mandatory compliance cited for April 2026, tightening baseline expectations for domestic digital transaction security beyond legacy OTP patterns. On the scheme-operator side, NPCI continued to refine UPI operating controls in FY 2025-26, including segregation of settlement cycles for authorization and dispute transactions, alongside circular-led enhancements such as higher limits for specific categories and support for alternative authentication methods. Complementing payments rules, the Bureau of Indian Standards published IS 19598:2026 on voluntary e-commerce self-governance principles, aligning consumer protection practices (pre-transaction disclosures to post-transaction grievance handling) with digital commerce flows that increasingly monetize via real-time payments.
Value Chain Analysis
In India real-time payments, RBI regulates payment and settlement systems, while NPCI operates UPI as the technical switch and settlement layer. Participant banks sit at the core: issuer banks hold accounts and authenticate users, and PSP/acquirer banks route requests and manage merchant settlement. Third-party application providers (TPAPs) such as PhonePe and Google Pay provide the consumer interface and merchant acceptance workflows.
Around this core, payment gateways and orchestration layers (for example, Razorpay, Cashfree, Juspay, BillDesk) connect merchants to UPI rails, provide tokenization-like abstractions (QR and intent flows), and add reconciliation, dispute management, and risk tooling. Upstream enablers include identity and authentication infrastructure (UPI PIN, on-device biometric authentication) and telecom connectivity for feature-phone and low-data use cases (UPI-123PAY/USSD), alongside cloud and data infrastructure used by banks and intermediaries under RBI localization requirements. Downstream, merchants, marketplaces, utilities, and government departments drive acceptance and recurring collection use cases, while value-added services monetize on top of high-volume, low-fee transactions through fraud analytics, credit overlays, and treasury dashboards. Operational bottlenecks remain concentrated in network reliability and fraud vectors (for example, collect-request scams), prompting investments in real-time risk scoring and tighter authentication; cross-border extensions and partnerships (such as NPCI and HSBC India for real-time FX settlement APIs announced in July 2026) add new nodes to the chain, including FX/settlement partners and international merchant acceptance networks.
Competitive Landscape
PhonePe’s 48% grip derives from a two-sided merchant-and-consumer acquisition blitz deploying more than 15 million QR stickers nationwide and embedding insurance as well as investment options inside its super-app. Google Pay’s 37% share benefits from Android pre-installation, voice search integration, and a gamified rewards engine. The NPCI has postponed its 30% share-cap enforcement until December 2026, enabling both incumbents to consolidate scale economics before ceding ground to challengers.
Strategic differentiation has shifted toward AI risk-scoring, conversational interfaces, and contextual credit. Amazon Pay streams order-level data from its marketplace into a proprietary decision engine that offers micro-loans at checkout, tightening its surface area across commerce and finance. Meanwhile, Razorpay and Juspay position themselves as infrastructure specialists, white-labelling APIs for banks and emerging fintechs. These partnerships accelerate embedded-finance proliferation without requiring each PSP to build a full stack.
Zero merchant discount‐rate economics compress traditional fee revenue, so players monetise through subscription-based reconciliation dashboards, premium APIs, and cross-sell of investment products. Barriers to entry remain formidable given the liquidity support, cyber-risk defences, and compliance budgets required to operate at 600 million-plus daily transactions. Nonetheless niche upstarts exploit white spaces in healthcare, education, and public utilities where domain depth can offset scale deficits. Overall, the India real-time payments industry demonstrates a classic duopolistic core with a ring of specialised adjacencies.
India Real Time Payments Industry Leaders
PhonePe Private Limited
Google LLC (Alphabet Inc.)
NPCI (National Payments Corporation of India)
Paytm Payments Bank Ltd
PayPal Payments Private Limited
- *Disclaimer: Major Players sorted in no particular order

Market Opportunities and Future Outlook
The most visible whitespace is in monetization and sustainability of the ecosystem under zero-MDR economics, particularly for high-value merchant payments and for banks that bear infrastructure and fraud-loss costs. A government proposal reported in July 2026 to reintroduce MDR of up to 0.5% on UPI transactions above INR 2,000 for large merchants (while protecting smaller merchants below a turnover threshold) provides a concrete pathway for PSPs, gateways, and banks to fund resilience upgrades and expand paid services such as dispute automation, reconciliation, and fraud analytics.
Another opportunity sits in scaling safer, lower-friction authentication and expanding addressable acceptance contexts. NPCI reported biometric UPI transactions exceeding 611 million in June 2026, supporting PIN-free flows that can improve conversion in high-frequency, low-attention payment moments and reduce dependency on compromised credentials. Cross-border usage also opens new volume and fee pools tied to international merchant acceptance and settlement tooling, with UPI operating across multiple countries and the July 2026 NPCI-HSBC India real-time FX settlement initiative highlighting demand for transparent FX pricing, faster settlement, and compliance-ready reporting for travel and cross-border commerce. Finally, cash-to-digital on-ramps such as the UPI Interoperable Cash Deposit (UPI-ICD) feature launched by RBI and NPCI in August 2024 broaden bank-led cash management and branchless deposit scenarios, enabling banks and ATM/cash-recycler networks to attach additional services to real-time payment identities.
Recent Industry Developments
- July 2026: NPCI and HSBC India announced a partnership to enable real-time foreign exchange settlement for cross-border UPI payments via direct API integration. The move supports the cross-border value chain by improving price transparency and settlement certainty for international UPI use cases.
- April 2025: Juspay raised USD 60 million in Series D funding led by Kedaara Capital to expand its rule-based fraud mitigation engines. The capital supports scaled deployments of risk and compliance layers that banks and fintechs use to protect high-volume UPI flows.
- August 2024: RBI and NPCI launched the UPI Interoperable Cash Deposit (UPI-ICD) feature at Global Fintech Fest 2024, enabling cardless cash deposits at cash recycler machines using UPI. This expands cash-to-digital on-ramps and creates new integration opportunities for banks and ATM network operators around UPI identities.


Research Methodology Framework and Report Scope
Market Definition and Coverage
For this study, the market covers the value of India real-time payment transactions that move funds from one account to another with near-instant confirmation on 24x7 rails, for example UPI and IMPS. We treat the market as the monetized ecosystem linked to these flows.
Scope exclusions: We do not count wallet top-ups, card-led instant programs, crypto rails, deferred net settlement batches, or cross-border real-time corridors.
Segmentation Overview
- By Transaction Type
- Peer-to-Peer (P2P)
- Peer-to-Business (P2B)
- By Component
- Platform / Solution
- Services
- By Deployment Mode
- Cloud
- On-Premise
- By Enterprise Size
- Large Enterprises
- Small and Medium Enterprises
- By End-User Industry
- Retail and E-Commerce
- BFSI
- Utilities and Telecom
- Healthcare
- Government and Public Sector
- Other End-user Industries
Data Sources, Market Sizing, and Validation
Desk Research
Desk work starts with building the rails and usage context, and we rely on public data that can be checked and refreshed easily. Sources used include payments and settlement statistics published by the Reserve Bank of India, NPCI operating and product updates, the Ministry of Finance and related Digital India releases, and telecom and internet adoption indicators from government datasets such as MeitY and TRAI.
After that, we map how value moves through the system by reviewing bank annual reports and investor decks, regulated entity disclosures, and reputed business press coverage on pricing, incentives, and rule changes. In parallel, we use paid subscriptions only for company financial intelligence, news and financials, and patent scanning, which helps cross-check timelines and investment patterns. The desk sources cited here are illustrative, and many other public and paid references were also used to collect data, validate assumptions, and clarify open questions.
Primary Interviews and Surveys
Primary discussions were used to turn raw usage signals into a practical market value model. We spoke with people who manage payment products, operations, risk, and technology in banks and payment ecosystem participants. We also tested our assumptions with domain experts who track UPI and IMPS rule changes, MDR like pricing behavior, and merchant acceptance patterns across major Indian regions, so gaps from desk findings could be closed using operating inputs.
Distribution of primary research fieldwork respondents
| Company type | Respondent position |
|---|---|
| Top tier: 36% | CXOs: 13% |
| Mid tier: 45% | Functional/Unit leaders: 31% |
| Smaller Players: 19% | Managers: 56% |
Market-Sizing & Forecasting
We sized the market using a top-down and bottom-up approach, starting from India payment rail activity and then narrowing it to real-time, account-to-account flows that meet the confirmation and availability rules. In practice, the top-down build uses published payment system statistics and rail level indicators to reconstruct the eligible value pool, which is then adjusted for known structural breaks such as policy changes, incentive shifts, and onboarding cycles.
To keep the model grounded, we track a few inputs closely and update them often, including UPI and IMPS transaction value and volume trends, the mix shift between P2P and merchant payments, average ticket size movement, the share of transactions routed through banks versus other participants, and pricing and incentive mechanics that affect monetization. Where a variable is not consistently disclosed, we fill the gap using interview based ranges and public proxies, then stress test the result so it stays within realistic bounds.
Forecasts were built using scenario analysis supported by short time series trend smoothing on the key drivers, followed by an expert check on adoption speed and pricing direction. We also use selective bottom-up approximations as a reasonableness test, such as sampled value per transaction multiplied by transaction counts for major rails and channel checks on monetization methods. Totals are adjusted only when multiple signals point to the same correction.
Data Validation & Update Cycle
Before finalizing numbers, we compare the model output against independent signals, such as payment system dashboards, bank disclosures on digital transaction intensity, and visible inflection points tied to rule or fee changes. Outliers are reviewed in a second pass, and if a swing cannot be explained by a documented event, we revisit the assumptions and recheck the input series.
A multi-step internal review is followed, and targeted re-contacts are triggered when a key driver moves beyond the expected range, such as abrupt ticket-size shifts or a sharp change in merchant share. Reports are refreshed annually, with interim updates for material events, and a final data pass is completed close to delivery so clients receive the most current view we can support.
Mordor Intelligence's India Real Time Payments Market Size Compared Against Other Published Estimates
Published market values for India real-time payments often do not match because the counting boundary is not consistent across studies. The same rail can be framed as a value flow, a revenue pool, or a broader blended payments bucket. Differences also come from the year used for currency conversion, how incentives and fees are treated, and how frequently the model is refreshed after major rule changes.
RBI and NPCI transaction statistics, along with rail-level mix signals such as UPI versus IMPS and P2P versus merchant shares, are the evidence checks that keep Mordor Intelligence tied to a defined domestic, account-to-account real-time payments scope instead of broader digital payments totals.
Benchmark comparison
| Source | Market Size | Gaps in Research Methodology |
|---|---|---|
| Mordor Intelligence | USD 7.84 B (2025) | |
| Trade Data Publisher A | USD 9.61 B (2025) | Uses a wider definition that can bundle adjacent instant digital payment value, and the inclusion rules for card-led and wallet-mediated flows are not clearly separated from account-to-account rails. |
| Industry Report B | USD 7.84 B (2024) | States a fiscal-year style baseline and reports a different base year, and the method appears to project aggressively without showing how ticket-size and monetization assumptions are validated against rail statistics. |
The spread in the table mainly comes from how tightly the scope is kept to domestic account-to-account real-time rails and from the base-year choice. This shifts the starting value even before forecasting begins. By tying each step back to rail activity signals and then sanity-checking monetization logic through interviews, we keep the estimate explainable and repeatable for users who need a practical planning number.


Key Questions Answered in the Report
What is the current value of the India real-time payments market?
The market stands at USD 9.46 billion in 2026 and is projected to reach USD 24.14 billion by 2031.
Which transaction type is expanding fastest?
Peer-to-business (P2B) payments are advancing at a 23.85% CAGR as QR-code acceptance among small merchants rises.
Why are SMEs adopting real-time payments so quickly?
Zero merchant discount-rate policies and free QR kits have removed entry barriers, leading to a 25.5% CAGR in SME payment volumes.
How do cloud deployments support transaction spikes?
Elastic cloud clusters scale automatically to handle festival surges when volumes climb 300-400%, maintaining system uptime.
What are the main threats to sustained growth?
Fraud via spoof apps and rural network latency can erode user trust and raise failure rates, marginally dampening the market’s CAGR.
Page last updated on:


 Your data is secure and never sold or shared.


