
Market Overview
| Study Period | 2020 - 2031 |
|---|---|
| Forecast Data Period | 2026 - 2031 |
| Base Year Market Size (2025) | USD 43.65 Trillion |
| Market Size (2026) | USD 47.26 Trillion |
| Market Size (2031) | USD 70.36 Trillion |
| Growth Rate (2026 - 2031) | 8.28 % |
| Market Concentration | High |
Major Players *Disclaimer: Major Players sorted in no particular order Image © Mordor Intelligence. Reuse requires attribution under CC BY 4.0. | |
China Payments Market Analysis by Mordor Intelligence
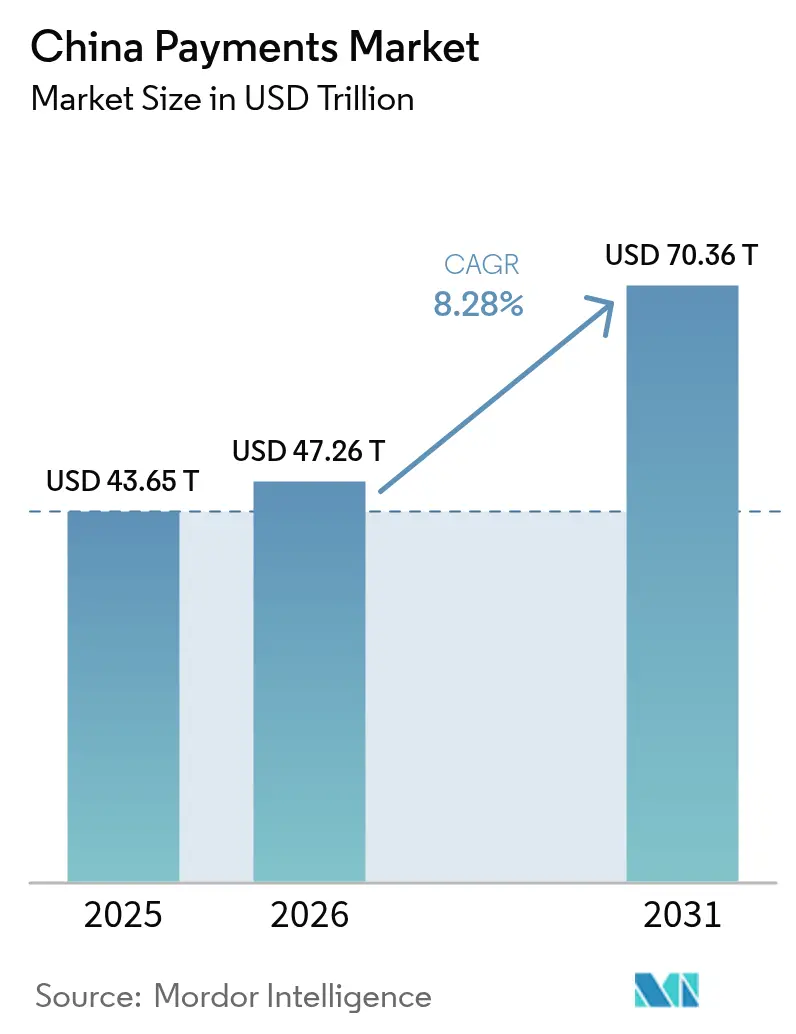
The China payments market size was valued at USD 43.65 trillion in 2025 and estimated to grow from USD 47.26 trillion in 2026 to reach USD 70.36 trillion by 2031, at a CAGR of 8.28% during the forecast period (2026-2031). The China payments market is propelled by the near-universal reach of mobile wallets, rapid build-out of real-time account-to-account rails, and strong policy backing for a cash-light society. The digital yuan pilot adds a programmable, central-bank rail that coexists with private super-apps, while biometric authentication and IoT use cases widen the addressable transaction universe. Competitive intensity revolves around platform ecosystem lock-in rather than fee compression, and regulatory oversight has become the principal brake on growth momentum. Merchant enablement tools, rural digitization programs, and cross-border commerce corridors continue to broaden the user base and diversify revenue streams, reinforcing the upward trajectory of the China payments market.
Key Report Takeaways
- By mode of payment, digital wallets led with 72.05% of the China payments market share in 2025; account-to-account payments are advancing at a 9.09% CAGR through 2031.
- By end-user industry, retail accounted for 45.18% of the China payments market size in 2025, while healthcare is growing at an 8.52% CAGR to 2031.
Note: Market size and forecast figures in this report are generated using Mordor Intelligence’s proprietary estimation framework, updated with the latest available data and insights as of 2026.
China Payments Market Trends and Insights
Drivers Impact Analysis*
| Driver | (~) % Impact on CAGR Forecast | Geographic Relevance | Impact Timeline |
|---|---|---|---|
| Proliferation of Mobile Wallets and Super-apps | +2.2% | National, with highest penetration in Tier 1-2 cities | Medium term (2-4 years) |
| Expansion of E-commerce and M-commerce Ecosystems | +1.8% | National, with rural acceleration via livestreaming | Long term (≥ 4 years) |
| Government Push for Digital Yuan and Cashless Society | +1.5% | National pilot cities expanding to full coverage | Long term (≥ 4 years) |
| Rise of Mini-Program In-App Payments | +1.2% | Urban centers with super-app ecosystem maturity | Medium term (2-4 years) |
| Adoption of Biometric POS Authentication | +0.8% | Tier 1-3 cities with infrastructure readiness | Short term (≤ 2 years) |
| Integration of Payments into Industrial IoT | +0.6% | Manufacturing hubs and smart city pilots | Long term (≥ 4 years) |
| Source: Mordor Intelligence | |||
Proliferation of Mobile Wallets and Super-apps
Super-app architecture pioneered by Alipay and WeChat Pay keeps users inside closed-loop ecosystems that blend payments, commerce, and public services. More than 1.3 billion monthly active users tap mini-programs that remove checkout friction and give merchants built-in marketing and credit tools. These network effects depress customer-acquisition costs and raise switching barriers, which in turn deepen user engagement and lift transaction frequency within the China payments market. Platform compliance with central-bank cybersecurity and resilience requirements underpins public trust, while continuous feature releases such as wealth management modules add further stickiness. The result is a virtuous cycle that sustains double-digit volume growth even in saturated urban pockets.
Expansion of E-commerce and M-commerce Ecosystems
Domestic online retail sales exceeded CNY 43.8 trillion in 2024, with the vast majority routed through mobile checkout. Livestream shopping, group buying, and social-commerce formats use instant settlement to shorten working-capital cycles for merchants and creators. Rural shoppers gain equal footing via 5G coverage and low-cost smartphones, bringing fresh cohorts into the China payments market. Cross-border shopping grows on simplified currency conversion modules and compliance screening tools embedded in super-apps, expanding reach for both Chinese exporters and overseas brands. Taken together, these forces support sustained high-single-digit expansion in payment volume even as overall consumer spending growth moderates.
Government Push for Digital Yuan and Cashless Society
The People’s Bank of China has distributed over 260 million digital-yuan wallets across 26 pilot cities.[1]People’s Bank of China, “Progress of E-CNY Pilot Work,” PBOC.gov.cn Programmable features allow targeted subsidies, automated tax collection, and transaction-level data visibility, giving policymakers new levers for macro-stability. Private platforms already plug the CBDC rail into existing checkout flows, ensuring continuity for consumers while widening settlement choices. The initiative accelerates financial inclusion in underbanked regions and reduces dependence on commercial intermediaries, adding structural momentum to the China payments market.
Rise of Mini-Program In-App Payments
Mini-programs processed transactions in the high hundreds of billions of yuan during 2024. Merchants deploy these lightweight apps inside super-apps instead of funding separate mobile builds, cutting integration time and boosting conversion through single-click payment. Small businesses gain enterprise-grade tooling, inventory, CRM, and credit scoring, delivered as plug-ins, flattening the digital-divide barrier. In parallel, municipal agencies use mini-program interfaces for bill payments and benefit disbursements, turning super-apps into citizen gateways and further entrenching their role in the China payments market.
Restraints Impact Analysis*
| Restraint | (~) % Impact on CAGR Forecast | Geographic Relevance | Impact Timeline |
|---|---|---|---|
| Tightening FinTech Regulatory Oversight | -1.1% | National, with stricter enforcement in major financial centers | Short term (≤ 2 years) |
| Fraud and Cybersecurity Risks in Cross-Border Transactions | -0.7% | Cross-border corridors and international tourist destinations | Medium term (2-4 years) |
| Ageing Population Hindering Rural Digital Adoption | -0.5% | Rural areas and smaller cities with higher elderly demographics | Long term (≥ 4 years) |
| Interoperability Gaps – CBDC Wallets vs. Legacy Rails | -0.4% | Digital yuan pilot cities and areas with mixed payment infrastructure | Medium term (2-4 years) |
| Source: Mordor Intelligence | |||
Tightening FinTech Regulatory Oversight
Post-2024 enforcement has intensified under the National Financial Regulatory Administration, with fines on banking partners topping CNY 738 million in the first half of 2024.[2]China National Financial Regulatory Administration, “Administrative Penalties Disclosed in H1 2024,” nra.gov.cn Revised Anti-Money Laundering rules effective 2025 significantly raise penalty ceilings and require external compliance monitors for high-risk entities. Payment-service-provider licences remain capped at 184, forcing aspirants to enter the China payments market via costly acquisitions rather than new grants. Continuous reporting and stress-testing obligations elevate fixed costs, squeezing smaller players and nudging market power further toward scale incumbents. Innovation budgets face pressure as firms divert capital to regulatory tooling.
Fraud and Cybersecurity Risks in Cross-Border Transactions
Emergent toolkits such as Z-NFC exploit contactless protocols, targeting travelers and merchants in duty-free zones. UnionPay International’s 2024 advisories underscore rising phishing sophistication in overseas checkout flows. New court precedents expand liability for providers that cannot prove “best-effort” fraud controls, amplifying compliance spend. Cross-border data-sharing constraints slow down risk-model calibration, eroding the friction-less edge that Chinese wallets enjoyed abroad. These headwinds temper the cross-border growth node of the China payments market even as domestic security metrics improve.
*Our forecasts treat driver/restraint impacts as directional, not additive. The impact forecasts reflect baseline growth, mix effects, and variable interactions.
Segment Analysis
By Mode of Payment: Digital Wallets Dominate While A2A Payments Accelerate
Digital wallets captured 72.05% of the China payments market share in 2025 on the back of ubiquitous QR infrastructure and seamless super-app checkout. The China payments market size linked to wallets is projected to grow at high single digits through 2030 as consumer preference solidifies in both urban and rural settings. Account-to-account options are climbing at a 9.09% CAGR, driven by new instant-payment rails that bypass card networks and undercut interchange fees. Real-time transfers are gaining traction for payroll disbursement, peer-to-peer gifting, and merchant settlement, indicating wallet and A2A convergence ahead. Cash continues to shrink, estimated at just 5% of transaction value in megacities, while card traffic remains relevant mainly for large-ticket, rewards-driven travel purchases. Niche instruments such as prepaid cards find survival niches in corporate expense management but face stagnant volume prospects.
Second-order effects reinforce A2A momentum. E-commerce sellers reduce working-capital cycles because funds settle within seconds, enabling just-in-time inventory strategies. Cross-border remittances leverage the same rails to avoid correspondent-bank charges, bringing fee relief to students and migrant workers. Wallet providers embed A2A modules, giving users a single interface to shuttle money between bank accounts and in-app balances, further blurring category lines in the China payments market. Over time, analysts expect the value share gap between wallets and A2A to narrow, though the volume hierarchy is likely to persist.




By End-User Industry: Retail Leadership Challenged by Healthcare Acceleration
Retail transactions accounted for 45.18% of the China payments market size in 2025 as QR codes reached every checkout, from luxury malls to street stalls. Strong loyalty integration, BNPL add-ons, and gamified coupons keep consumer stickiness high. In contrast, healthcare payments are advancing at an 8.52% CAGR, the fastest among tracked sectors. Hospital information-system upgrades enable integrated registration, diagnosis, and payment in one app encounter, curbing queuing times and administrative costs. Telemedicine visits finalize billing within the consultation window, exemplifying embedded finance in public services.
Transportation, entertainment, and hospitality also post swift cashless adoption. Ride-hailing and food-delivery operators impose wallet or A2A default options, normalizing digital settlement for daily micro-transactions. Government service portals channel bill payments and fee receipts directly through super-apps, extending the routine use case set. While average ticket sizes vary widely, the unified experience advances the goal of a cash-light China payments market. Sector divergences will continue to narrow as policy pushes healthcare, education, and utilities toward full digital acceptance.

Geography Analysis
Tier-1 cities such as Beijing, Shanghai, and Shenzhen exhibit near-total digital penetration, with cash’s share of consumer spend in low single digits. Merchant acceptance infrastructure supports biometric checkout, IoT vending, and CBDC wallet top-ups, creating an innovation flywheel that keeps the China payments market at the frontier of global best practice. In these hubs, competition now pivots to value-added services including micro-investing and loyalty-marketing engines rather than raw payment processing.
Tier-2 and Tier-3 urban clusters show similar wallet adoption curves, albeit with heavier reliance on QR rather than biometric authentication. Government smart-city programs subsidize POS upgrades, and regional banks partner with super-apps to extend consumer credit at point of sale. Digital-yuan trials are rolled out selectively, providing households with an alternative settlement rail while maintaining the familiar super-app interface. As infrastructure deepens, usage patterns in these cities increasingly mirror those of the megacities, reinforcing nationwide cohesion in the China payments market.
Rural counties lag in device penetration and merchant readiness, yet mobile-network coverage and smartphone affordability are closing the gap. Agricultural e-commerce platforms funnel subsidies and seed financing through instant transfers, nudging farmers into digital rails. Younger cohorts introduce peer-influence dynamics, teaching older relatives to scan QR codes for grocery runs and utility bills. Policy initiatives bundle consumer-protection education with fintech-literacy drives, ensuring responsible onboarding. Over time, analysts expect growth rates in rural regions to outpace urban centers on a low-base effect, driving the next leg of the China payments market expansion.
Regulatory Landscape
China payments are regulated primarily by the People’s Bank of China (PBOC), with the National Financial Regulatory Administration (NFRA) reinforcing conduct, risk, and consumer-protection supervision across banks and payment-linked activities. The Regulations on the Supervision and Administration of Non-bank Payment Institutions (effective May 2024) modernized licensing, governance, and ongoing supervisory expectations for non-bank payment institutions in a market where licences remain capped, reinforcing high barriers to entry.
Rules affecting clearing, safety, and instrument choice continued to tighten through 2025-2026. The Measures for the Administration of Bank Card Clearing Institutions took effect in November 2025, strengthening oversight and coordination between PBOC and NFRA for systemic risk management in card clearing. In April 2026, PBOC Announcement No. 8 revised Electronic Payment Guidelines (No. 1), with provisions taking effect May 15, 2026 to raise security requirements, including use of digital certificates for higher-risk payment scenarios. A separate 2026 regulation on RMB cash payment and services also reinforced cash acceptance obligations as digital payments expanded.
Value Chain Analysis
The China payments value chain runs from consumers and merchants at the front end to acceptance and orchestration layers (QR codes, NFC tokenization, mini-program in-app checkouts), and then through processors, wallets, acquirers, and clearing infrastructure. Alipay and WeChat Pay anchor the dominant wallet layer, while back-end clearing and routing relies on NetsUnion Clearing Corporation (for online payments) and China UnionPay rails for bankcard and related network services. Commercial banks support the chain by providing settlement accounts, liquidity, and KYC/AML controls.
Regulation and central infrastructure increasingly shape how value is captured across the chain. The PBOC’s early-2026 shift in how it classifies the digital yuan (e-CNY) toward a deposit-like framework deepens the role of operating banks in wallet funding, balance management, and reserve treatment, tightening the linkage between retail payment flows and bank balance-sheet plumbing. Upstream, compliance tooling, including AML screening, cybersecurity controls, and strong authentication, has become a larger cost and differentiation lever after tighter supervisory rules for non-bank payment institutions and higher safety standards for electronic payments. As a result, leading platforms have operationalized risk and customer-service automation, while smaller players face higher fixed compliance burdens.
Competitive Landscape
Alipay and WeChat Pay command over 90% of digital-transaction volume, giving the China payments market one of the highest concentration ratios globally. Their super-app ecosystems host everything from micro-loans to municipal-service fees, weaving payments invisibly into daily life. UnionPay remains dominant in plastic-card issuance, but its mobile front-end, Cloud QuickPass, competes head-on with QR wallets by enabling tokenized NFC checkout and digital-yuan compatibility. The strategic battleground has moved from per-transaction economics to ecosystem depth, data-analytics prowess, and cross-border reach.
Licensing caps since 2015 mean new entrants must acquire existing permit holders, as seen when Ant Group bought MultiSafePay in 2024 and Payoneer took over Easylink in 2025. These deals expand technical capabilities and region-specific risk controls but face stringent regulatory vetting. Niche players carve space in healthcare payments, industrial IoT, and global B2B settlements where incumbents’ scale may be offset by specialized compliance or vertical expertise. Feature innovation centers on biometric hardware, AI-based fraud detection, and instant-remittance corridors, each aimed at tightening user lock-in.
Regulation is the wild card. The digital-yuan rail introduces a central-bank alternative that could reset bargaining power between private wallets and the state. Mandatory data localization and stepped-up cybersecurity audits raise compliance thresholds, raising fixed costs but also creating higher entry barriers. Given these dynamics, the China payments market is likely to remain a duopoly flanked by a long tail of specialist providers.
China Payments Industry Leaders
WeChat Pay (Tencent Holdings Ltd.)
JDPay.com (JD.com))
Alipay.com Co., Ltd.
China UnionPay Co., Ltd.
Apple Inc. (Apple Pay)
- *Disclaimer: Major Players sorted in no particular order


Market Opportunities and Future Outlook
Cross-border acceptance and inbound traveler enablement is a visible whitespace area where platforms are investing in interoperability rather than domestic QR reach. Weixin Pay expanded international wallet support, and in 2026 Tencent announced initiatives with local regulators to make inbound payments easier for international visitors. UnionPay International has also been extending acceptance and payout connectivity through partnerships. These moves favor payment orchestration, wallet-to-wallet bridges, merchant onboarding, and risk controls that can operate across multiple overseas wallets, cards, and local compliance regimes.
Institutionalization of security and bank-led infrastructure creates opportunities for vendors and payment institutions that can help incumbents comply while keeping checkout friction low. PBOC Announcement No. 8 (issued April 2, 2026; effective May 15, 2026) raised safety requirements in the Electronic Payment Guidelines framework, creating demand for certificate-based authentication, device binding, and stronger transaction-risk controls in higher-risk payment flows. At the same time, e-CNY management and infrastructure actions that integrate e-CNY more tightly with commercial banks broaden opportunities around e-CNY acceptance integration, reconciliation, treasury operations, and programmable disbursement use cases, such as subsidies and public-service payments, that can run alongside existing super-app checkout experiences.
Recent Industry Developments
- February 2026: Visa Direct and UnionPay International announced plans to extend cross-border money movement into mainland China by linking Visa Direct with UnionPay International's MoneyExpress platform. The collaboration aims to connect consumer-to-consumer and business-to-consumer flows across networks and expand payout reach. The effort emphasizes network-to-network interoperability as a differentiator in cross-border payments.
- February 2025: American Express and Alipay announced cooperation to enable payments for international travelers in China. The tie-up aimed to simplify acceptance for overseas cardholders using Alipay-enabled experiences at merchants, improving inbound travel payments at the checkout layer. It highlights how global card networks and Chinese wallets are collaborating to reduce friction in cross-border spending while maintaining local risk and compliance controls.
- April 2024: Regulations on the Supervision and Administration of Non-bank Payment Institutions became effective in May 2024, tightening licensing, governance, and consumer protections for non-bank payment providers. The move supported a broader push toward standardized compliance and risk controls across the sector.


Research Methodology Framework and Report Scope
Market Definition and Coverage
This market measures the value of payments completed in China across point-of-sale and online commerce, counted by payment method and the industries where the payments occur.
Scope exclusions: We exclude online transactions tied to motor vehicles, real estate, utility bills, mortgages, loans, credit card bill payments, and purchases of shares or bonds.
Segmentation Overview
- By Mode of Payment
- Point of Sale
- Debit Card Payments
- Credit Card Payments
- A2A Payments
- Digital Wallet
- Cash
- Other Point of Sale Payment Mode
- Online Sale
- Debit Card Payments
- Credit Card Payments
- A2A Payments
- Digital Wallet
- Cash-on-Delivery
- Other Online Sales Payment Mode
- Point of Sale
- By End-User Industry
- Retail
- Entertainment
- Hospitality
- Healthcare
- Transportation and Logistics
- Other End-User Industries
Data Sources, Market Sizing, and Validation
Desk Research
Desk research helped us set clear boundaries and build the first set of demand drivers for the China payments model. We referenced public releases such as the People's Bank of China statistical updates, National Bureau of Statistics indicators, and Ministry of Commerce retail and services data to anchor macro spending and transaction direction. Where cross-border context was needed, we also reviewed customs trade statistics and ISO-style industry standards that shape card and payment messaging.
To translate these signals into market sizing inputs, we reviewed annual reports and investor decks of listed ecosystem participants, along with reputable financial press coverage on regulation, fee policies, and payment behavior shifts. We also used paid databases for company financials and news screening, plus patent databases to sanity-check the timing of new payment capabilities moving into rollout. These are illustrative sources only, and many other public documents and datasets were used for data collection, validation, and clarification.
Primary Interviews and Surveys
Primary work was used to confirm what is actually counted as a payment transaction in practice across POS and online checkout, and how cash-on-delivery is treated in commerce reporting. We spoke with a mix of payment ecosystem participants and end-user merchants across major provinces, then used follow-up calls to pressure test assumptions on channel split, usage frequency, and how rule changes can affect reported payment value.
Distribution of primary research fieldwork respondents
| Company type | Respondent position |
|---|---|
| Top tier: 37% | CXOs: 12% |
| Mid tier: 43% | Functional/Unit leaders: 33% |
| Smaller Players: 20% | Managers: 55% |
Market-Sizing & Forecasting
We started with a top-down build that reconstructs the total value of commerce payments by linking retail and services activity with payment method adoption across POS and online checkout. Once the initial totals were formed, they were checked using selective bottom-up approximations, such as sampled average transaction value multiplied by estimated transaction counts for key channels, plus merchant-side channel checks to correct any unrealistic jumps.
Key inputs used in the model include the split between POS and online sale payments, the mix of card versus digital wallet versus cash at POS, and the pace of e-commerce transaction value growth in consumer categories. We also tracked the share of cash-on-delivery within online commerce, shifts in spending across retail and service industries covered, and known regulatory changes that can alter how payment value is routed or recorded. Where direct datapoints were not available for a sub-slice, we filled gaps using proxy indicators from closely linked sectors, and then normalized results so the totals stayed consistent with macro demand.
For forecasting, scenario analysis was applied around a base case view agreed in interviews, followed by ARIMA-based time series smoothing to avoid overreacting to short-term volatility. Final growth paths were adjusted when expert feedback suggested a structural change, such as a sustained shift between online and in-store payments rather than a one-off event.
Data Validation & Update Cycle
Outputs were validated through multiple checks so the market value stays tied to observable commerce activity. We compared implied payment value per capita and per active merchant against independent signals, then flagged any variance that could not be explained by channel mix or category seasonality. When an outlier appeared, the assumptions were revisited, desk sources were re-checked, and targeted re-contacts were triggered to confirm what changed.
Before sign-off, the model and written insights go through a multi-step review by another analyst to catch consistency gaps across time periods and definitions. The report is refreshed annually, and interim updates are done when material events occur, for example major rule changes that affect payment recording or consumer usage. Right before delivery, we run a final pass on key inputs so clients receive the latest updated view.
Mordor Intelligence's China Payments Market Size Compared With Other Published Estimates
It is common to see different market sizes for China payments because publishers do not always count the same transaction pool, and they may also mix payment volume with payment revenue. Estimates also move based on what gets treated as commerce payments versus adjacent financial flows, along with how online and in-store activity is reconciled over time.
By tracking definitional boundaries and refresh timing, Mordor Intelligence ties the model to China POS and online sale payments while excluding items like utilities, loans, and securities purchases, which can otherwise inflate the reported total. Other studies may also apply aggressive assumptions on digital wallet substitution or use a different currency conversion timing for large RMB-denominated flows, which creates visible gaps even when the direction of growth is similar.
Benchmark comparison
| Source | Market Size | Gaps in Research Methodology |
|---|---|---|
| Mordor Intelligence | USD 43.65 T (2025) | |
| Industry Research House A | USD 40.00 T (2024) | Uses a different base year and appears to treat the market as a broad payments landscape, which can blend commerce payments with a wider set of financial transactions and lead to a lower or differently bounded total. |
| Market Research Publisher B | USD 3.36 T (2026) | Looks closer to payments revenue rather than transaction value, and it also extends the forecast horizon, which makes the figure not directly comparable to a transaction-value market measured in trillions. |
The spread in the table is mainly explained by what is being measured (payment transaction value versus payment industry revenue) and the exact transaction categories included. When the scope is kept consistent around commerce POS and online payments, and the same year and currency timing are applied, the resulting market size becomes easier to reconcile and repeat from one update to the next.


Key Questions Answered in the Report
What is the current value of the China payments market?
The China payments market size stood at USD 47.26 trillion in 2026 and is projected to keep rising through the decade.
How fast is the sector expected to grow?
Aggregate transaction value is forecast to expand at an 8.28% CAGR between 2026 and 2031.
Which payment mode leads in China?
Digital wallets hold 72.05% of transaction value, far ahead of cards or cash.
Which industry vertical is growing the fastest in payments?
Healthcare payments are projected to rise at an 8.52% CAGR as hospitals and telemedicine platforms digitize billing.
How concentrated is competition among wallet providers?
The top two players, Alipay and WeChat Pay, capture more than 90% of digital volumes, resulting in a highly concentrated landscape.
Page last updated on:


 Your data is secure and never sold or shared.


