Netherlands Payments Market Size and Share
Market Overview
| Study Period | 2020 - 2031 |
|---|---|
| Forecast Data Period | 2026 - 2031 |
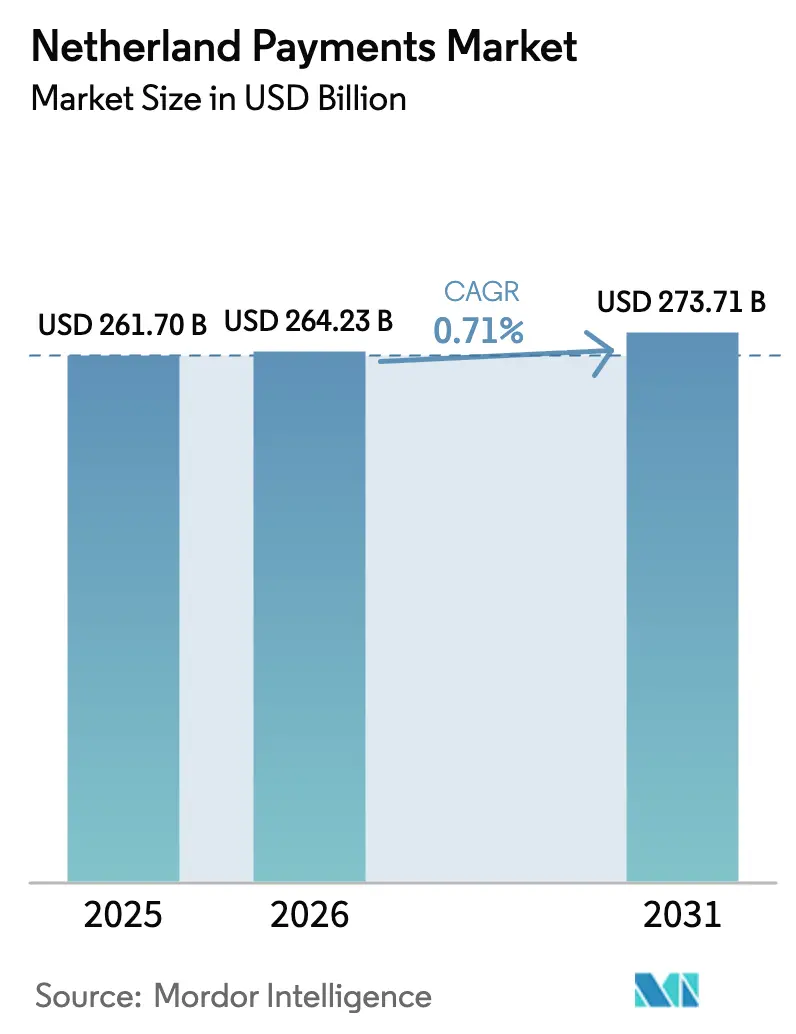
| Base Year Market Size (2025) | USD 261.70 Billion |
| Market Size (2026) | USD 264.23 Billion |
| Market Size (2031) | USD 273.71 Billion |
| Growth Rate (2026 - 2031) | 0.71% CAGR |
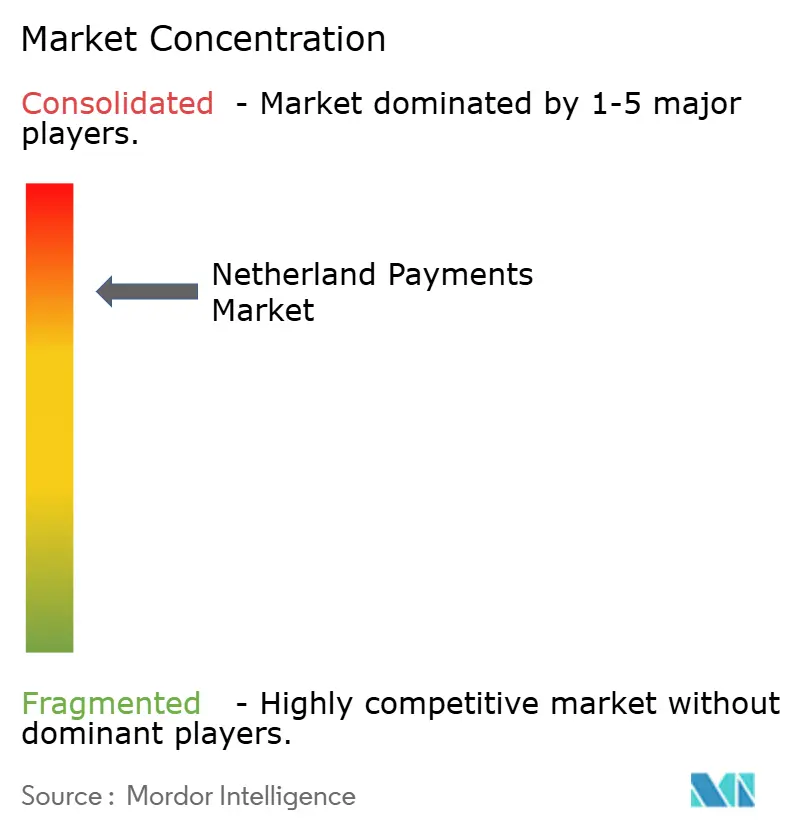
| Market Concentration | High |
Major Players *Disclaimer: Major Players sorted in no particular order Image © Mordor Intelligence. Reuse requires attribution under CC BY 4.0. | |
Netherlands Payments Market Analysis by Mordor Intelligence
The Netherlands payments market size is projected to expand from USD 261.70 billion in 2025 and USD 264.23 billion in 2026 to USD 273.71 billion by 2031, registering a CAGR of 0.71% between 2026 and 2031. Steady but muted topline growth hides an economy that has already digitized most day-to-day spending, so incremental volume now concentrates in mobile commerce, recurring billing, and cross-border transactions. The Netherlands payments market is being reshaped by instant settlement requirements, the mandated migration of iDEAL to the pan-European Wero wallet, and the broad roll-out of 5G that smooths biometric authentication at checkout. Processors are responding by bundling fraud scoring, automated reconciliation, and embedded lending to offset shrinking interchange. Competitive intensity is rising as merchants expect one API that spans cards, account-to-account, and Buy Now, Pay Later while demanding ever-higher authorization rates.
Key Report Takeaways
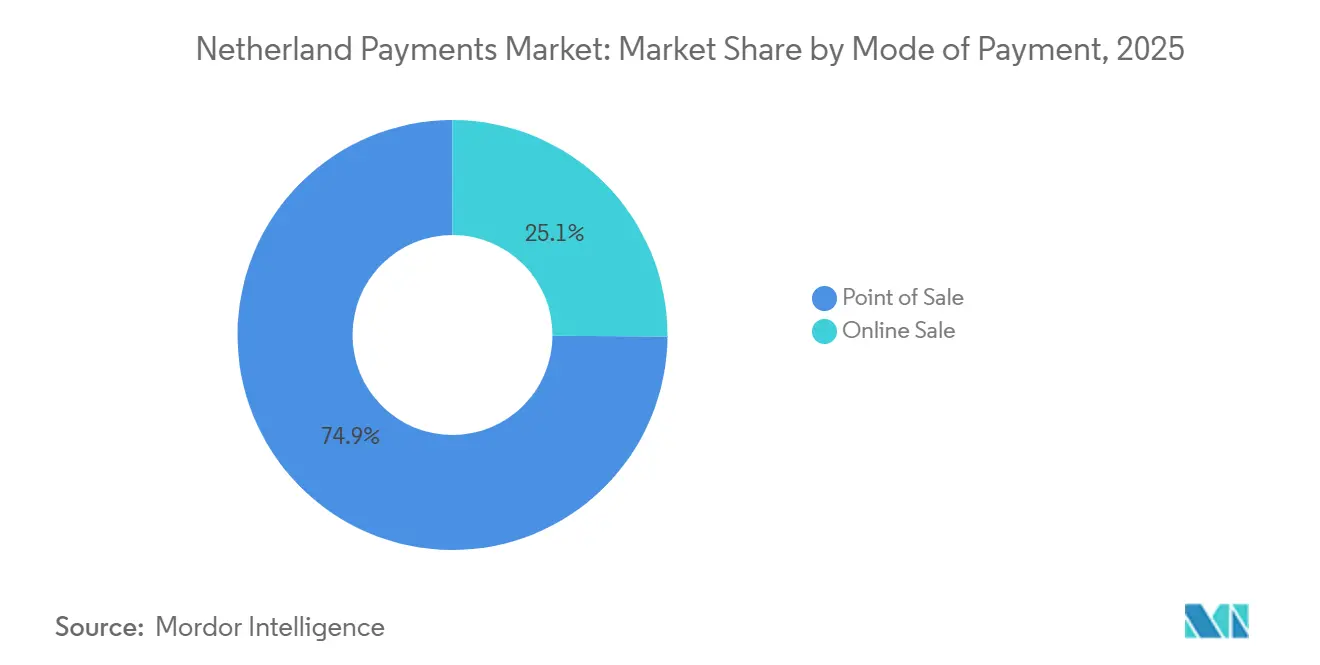
- By mode of payment, Point of Sale channels led with 74.89% of the Netherlands payments market share in 2025, whereas Online Sale channels are forecast to record the fastest expansion at a 1.03% CAGR through 2031.
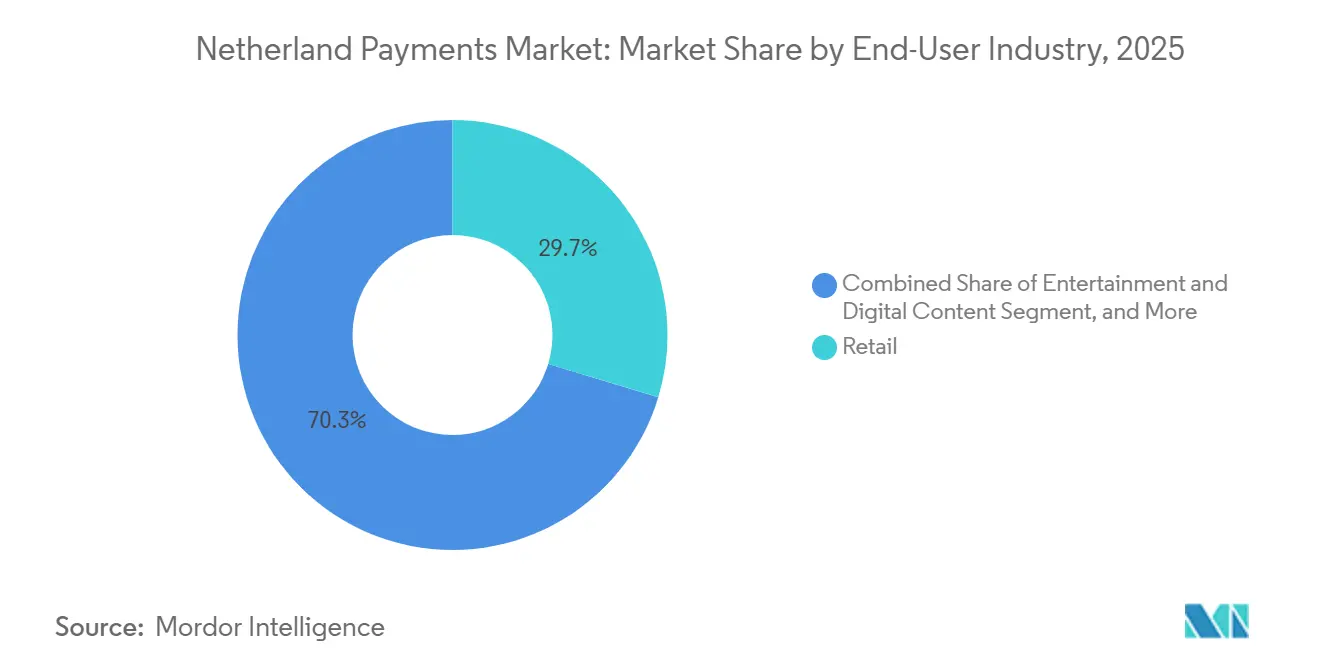
- By end-user industry, Retail commanded 29.67% of Netherlands payments market size in 2025 and Healthcare is projected to progress at a 1.37% CAGR to 2031.
Note: Market size and forecast figures in this report are generated using Mordor Intelligence’s proprietary estimation framework, updated with the latest available data and insights as of January 2026.
Netherlands Payments Market Trends and Insights
Drivers Impact Analysis*
| Driver | (~) % Impact on CAGR Forecast | Geographic Relevance | Impact Timeline |
|---|---|---|---|
| Ubiquitous Broadband and 5G Roll-out Fueling Mobile Pay Readiness | +0.2% | National | Medium term (2-4 years) |
| Government-Mandated Instant Payments Infrastructure (TARGET Instant Payment Settlement) | +0.3% | National, aligned with EU regulation | Long term (≥ 4 years) |
| Rise in Account-to-Account Pay-by-Link Solutions | +0.1% | National, early adoption in urban centers | Medium term (2-4 years) |
| Surging Contactless Card Adoption Post-COVID-19 | +0.2% | National | Short term (≤ 2 years) |
| Open-Banking APIs Accelerating Embedded Payments | +0.1% | National, spillover to Benelux | Long term (≥ 4 years) |
| Fintech-Retail Partnerships Driving Buy Now, Pay Later Uptake | +0.2% | National, concentrated in e-commerce hubs | Short term (≤ 2 years) |
| Source: Mordor Intelligence | |||
Ubiquitous Broadband and 5G Roll-Out Fueling Mobile Pay Readiness
Household 5G coverage reached 100% by mid-2023, supported by 16,072 active base stations and a 3.6 GHz spectrum auction that unlocked additional capacity. Mobile data traffic climbed to 719 million GB in Q2 2025, a 16% quarter-on-quarter lift that enables frictionless biometric authorization for mobile wallets. Apple Pay and Google Pay together captured 18.6% of in-store and 23.3% of online transactions during 2024, and their share continues to rise as merchants adopt tap-to-phone acceptance. Ride-hailing, food delivery, and micromobility operators now bypass traditional terminals, lowering barriers for new acquirers and widening the addressable base of the Netherlands payments market. Processors able to embed SDKs into merchant apps are winning share because they remove checkout redirects and deliver one-click repeat purchases.[1]Authority for Consumers and Markets, “Mobile Data Market Monitor,” acm.nl
Government-Mandated Instant Payments Infrastructure (TARGET Instant Payment Settlement)
All euro-area payment service providers have been required to support instant credit transfers since October 2025, making sub-10-second settlement the de-facto standard for Dutch consumers. iDEAL processed more than 1.3 billion transactions in 2024 and will migrate to the pan-European Wero wallet by 2028, creating a harmonized rail for 16 banks and payment service providers. The compression of float income pressures acquirers to monetize fraud screening, dynamic FX, and working-capital advances rather than interchange. Adyen’s AI-driven Uplift tool boosted merchant conversion by six percentage points, demonstrating how value-added services offset revenue lost to faster settlement. Firms that leverage real-time data for risk scoring and treasury management are set to expand their slice of the Netherlands payments market.[2]European Central Bank, “Regulation (EU) 2024/886 on Instant Payments,” ecb.europa.eu
Surging Contactless Card Adoption Post-COVID-19
Contactless exceeded 70% of point-of-sale activity in 2024, up from roughly 50% in 2019. OVpay’s national transit rollout normalized tap-and-go behavior for low-value rides, processing 500,000 daily journeys by mid-2025 and accounting for 25% of all trips. Consumers now expect contactless acceptance at vending machines, parking meters, and municipal kiosks, creating investment pressure on independent merchants who still rely on cash. The Netherlands payments market therefore sees hardware vendors upgrading legacy terminals while fintechs offer software-only tap-to-mobile options that cut cost for small sellers. The immediate beneficiary is debit volume, aligning with Dutch cultural aversion to revolving credit.[3]De Nederlandsche Bank, “Payments Monitor 2025,” dnb.nl
Fintech-Retail Partnerships Driving Buy Now, Pay Later Uptake
Buy Now, Pay Later (BNPL) volume reached EUR 5.1 billion (USD 5.6 billion) across 53 million transactions in 2024, expanding 17% year-on-year. Klarna, Riverty, in3, and Billink dominate but face new rules as the Dutch government moves to license providers by November 2026. Forward-thinking retailers white-label BNPL inside loyalty programs, earning the financing spread and keeping the customer relationship. Processors that combine BNPL with traditional acquiring in one contract reduce integration complexity and improve authorization rates through single token vaults. These partnerships widen merchant acceptance and embed BNPL deeper into the Netherlands payments market.[4]Dutch Authority for Financial Markets, “BNPL Market Update,” afm.nl
Restraints Impact Analysis*
| Restraint | (~) % Impact on CAGR Forecast | Geographic Relevance | Impact Timeline |
|---|---|---|---|
| Heightened Fraud via Authorised Push Payment Scams | -0.3% | National, highest in EEA | Short term (≤ 2 years) |
| High Interchange and Scheme Fees for SMEs | -0.2% | National, acute in low-ticket sectors | Medium term (2-4 years) |
| Legacy POS Hardware in Long-Tail Merchants | -0.1% | National, concentrated in rural areas | Medium term (2-4 years) |
| Consumer Privacy Concerns Over Data-Rich Wallets | -0.1% | National, spillover to EU | Long term (≥ 4 years) |
| Source: Mordor Intelligence | |||
Heightened Fraud via Authorized Push Payment Scams
Credit-transfer fraud hit EUR 142 million (USD 155 million) in 2024, while card fraud added EUR 37.8 million (USD 41.3 million), giving the Netherlands the highest digital-payment fraud rate in the European Economic Area. Authorised Push Payment scams are hard to detect because customers willingly authenticate the transfer. Only 1% of victims recovered funds, prompting the Dutch Banking Association to require Confirmation of Payee checks and real-time monitoring. A KPMG survey showed that pausing suspicious transfers cut fraud by 91%, outperforming name-matching at 41%, underscoring the need for behavioral analytics. Rising compliance cost weighs on smaller processors, narrowing margins and slowing expansion in the Netherlands payments market.
High Interchange and Scheme Fees for SMEs
Blended fees of 1.0%-1.5% on debit and 1.5%-2.5% on credit transactions, plus additional gateway and rental charges, swallow up to 5% of revenue for bakeries, florists, and cafés where the average basket is below EUR 10 (USD 11). Merchants respond with minimum-spend rules or surcharges, but these tactics clash with customer expectations as cash usage falls to 20% of point-of-sale turnover. Instant account-to-account rails offer fee relief, yet adoption stalls until parity with card networks in dispute resolution and refunds is achieved. The cost burden makes rural SMEs reluctant to join the Netherlands payments market’s newest rails, keeping cash relevant in isolated pockets.
*Our forecasts treat driver/restraint impacts as directional, not additive. The impact forecasts reflect baseline growth, mix effects, and variable interactions.
Segment Analysis
By Mode of Payment: Online Channels Capture Residual Digitization
Point of Sale channels controlled 74.89% of Netherlands payments market share in 2025, reflecting decades of card habituation and the country’s universal contactless infrastructure. The sub-segment’s growth is limited, but its absolute scale safeguards its role as the cash flow engine of the Netherlands payments market size. Debit cards dominate as consumers favor pay-now behavior, while credit cards cater mainly to travel and high-ticket retail. Digital wallets jumped from single-digit presence in 2020 to 18.6% of in-store transactions in 2024, accelerated by near-field-communication smartphones and pandemic hygiene concerns. Bank financing and prepaid cards remain niche, used predominantly for furniture instalments and corporate gifting.
Online Sale channels, although smaller, are projected to grow at a 1.03% CAGR through 2031, outpacing physical retail. Card-on-file dominates remote commerce, yet digital wallets already command 23.3% share because they streamline one-click checkout. The fastest-moving pocket is “other online sales” where BNPL and pay-by-link solutions live, stimulated by younger demographics and subscription business models. Mollie’s acquisition of GoCardless aligns with this shift, merging card, direct debit, and account-to-account within one API. Merchants that support multiple rails see lower cart abandonment, pushing processors to offer orchestration engines that route every transaction to the cheapest successful path, thereby enriching the Netherlands payments market.


By End-User Industry: Healthcare Digitization Outpaces Retail Maturity
Retail retained 29.67% of Netherlands payments market size in 2025, anchored by national grocery and fashion chains whose unified loyalty and payment apps set consumer expectations for seamless checkouts. Growth now comes from click-and-collect flows, subscription-based memberships, and embedded financing that turn payments into revenue generators rather than pure cost. Unified commerce platforms that reconcile in-store and online sales in real time have become standard among tier-one retailers, reinforcing their share of the Netherlands payments market.
Healthcare, although smaller today, is forecast to deliver the fastest expansion at a 1.37% CAGR to 2031, owing to electronic health-record integration, telemedicine billing, and e-pharmacy adoption. Hospitals embed gateways to enable real-time insurer adjudication, while pharmacies roll out point-of-care terminals for co-pays. OECD funding for a national data platform unlocks secure patient identifiers that double as payment tokens, lowering reconciliation overhead. The opportunity spills into revenue-cycle management software, where processors earn additional basis points for automating claim status and patient reminders, deepening their exposure to the Netherlands payments market share. Entertainment, hospitality, travel, government, and utilities segments are converging on recurring billing, tip-at-table, and pay-by-link experiments that widen the total addressable market for full-stack acquirers.

Geography Analysis
The Randstad corridor, comprising Amsterdam, Rotterdam, The Hague, and Utrecht, accounts for roughly 45% of the population and an outsized 55% of the Netherlands payments market volume. Higher smartphone penetration and a dense fintech ecosystem explain mobile wallet usage exceeding 30% in Amsterdam and Rotterdam. Tourism further accelerates contactless adoption as visitors expect card acceptance everywhere, including museums and street vendors. Peripheral provinces such as Friesland, Drenthe, and Zeeland trail, with many micro-merchants reluctant to upgrade legacy hardware, keeping cash presence above the national average. Government grants targeting rural broadband and mobile network operators’ 5G spectrum obligations are expected to shrink this gap over the medium term.
Cross-border commerce adds another layer. Rotterdam’s port handled 467 million metric tons of cargo in 2024, driving euro-denominated but multi-currency settlements for importers and exporters. Adyen, headquartered in Amsterdam, processed EUR 1,285.9 billion (USD 1,403.4 billion) in global volume during 2024, much of it from e-commerce merchants using Dutch entities to serve the European Single Market. The upcoming 2026 local launch of Wero, already live in Belgium, France, and Germany, promises unified person-to-merchant instant payments across borders, indirectly expanding the Netherlands payments market by simplifying acceptance for regional online sellers.
Provincial pilots underscore the phased nature of digital transformation. Noord-Holland, Zuid-Holland, and Utrecht channel larger budgets into municipal payment digitization, introducing tap-to-pay parking meters and pay-by-link for fines. Rural administrations follow once cost curves decline and citizen readiness improves. University medical centers in Amsterdam and Rotterdam spearhead healthcare payment innovation, whereas clinics in Gelderland and Overijssel integrate more slowly due to legacy IT backbones. This uneven diffusion confirms that geography now shapes service depth rather than basic access inside the Netherlands payments market.
Competitive Landscape
The Netherlands payments market balances a concentrated acquiring core with a long tail of niche providers. Adyen, Worldline, and Mollie hold the lion’s share of merchant volume, while Visa, Mastercard, and American Express operate the fundamental rails. Adyen reported EUR 598.4 million (USD 653.2 million) in Q3 2025 net revenue, up 20% year-on-year, driven by omnichannel merchants that value its single integration. Worldline’s EUR 1,161 million (USD 1,267.5 million) in Q3 2024 revenue reflects organic growth of 2.7% as it absorbs Atos assets and extends its terminal footprint. Mollie positions itself as the SME champion with 350,000 merchants, and its GoCardless deal strengthens recurring and account-to-account capabilities.
Strategic themes converge on vertical integration. Processors are adding issuing, treasury, and working-capital advances to capture more economics per transaction, differentiating on value rather than headline pricing. Artificial intelligence sits at the center, with tools like Adyen’s Uplift raising authorization rates and optimizing Strong Customer Authentication flows. New entrants such as Stripe and Block exploit API-first go-to-market models that resonate with developers and micro-merchants, respectively, expanding the accessible pool of the Netherlands payments market. At the same time, rising fraud and compliance obligations raise barriers to entry, paradoxically reinforcing the advantage of scaled incumbents able to amortize monitoring costs across billions of transactions.
White-space opportunities materialize in three pockets. First, account-to-account adoption lags expectations, so providers delivering card-like chargeback and dispute management could accelerate merchant uptake. Second, BNPL is fragmenting between balance sheet lenders and white-label merchant solutions, with the latter likely to win under stricter licensing. Third, cross-border instant settlement paired with real-time foreign exchange remains unsolved; processors that crack this workflow will soak up volume from correspondent banks. Collectively, these vectors indicate that innovation layers are moving higher up the stack, making orchestration, data, and credit the new battleground for share of the Netherlands payments market.
Netherlands Payments Industry Leaders
PayPal Holdings, Inc.
Visa Inc.
American Express Company
Mastercard Incorporated
Stichting Currence iDEAL B.V.
- *Disclaimer: Major Players sorted in no particular order

Recent Industry Developments
- December 2025: Mollie completed its acquisition of GoCardless for EUR 1.05 billion (USD 1.15 billion), combining 350,000-plus merchants with direct-debit infrastructure.
- November 2025: Adyen reaffirmed a 20% net revenue growth target beyond 2026 and projected an EBITDA margin above 55% by 2028.
- October 2025: The European Payments Council launched its Verification of Payee scheme across the European Economic Area.
- January 2025: The Dutch government announced plans to restrict in-store BNPL offerings ahead of licensing rules due in Nov 2026.


Netherlands Payments Market Report Scope
Payments are increasingly becoming cashless, and the industry's role in fostering inclusion has become a top priority. Payments contribute to developing digital economies and drive innovation while serving as a stable backbone worldwide. The Netherlands' payment services market widely deals with various payment modes, end-user industries, and offline & online institutions. Interpay, an automatic clearing house with almost all banks participating, processes many of the wholesale payments centrally. There is no other system of substance payment at interbank low values.
The Netherlands Payments Market Report is Segmented by Mode of Payment (Point of Sale, Online Sale), End-User Industry (Retail, Entertainment and Digital Content, Healthcare, Hospitality and Travel, Government and Utilities, Other End-User Industries). The Market Forecasts are Provided in Terms of Value (USD).
| Point of Sale | Card Payments | Debit Cards |
| Credit Cards | ||
| Bank Financing Prepaid Cards | ||
| Digital Wallets (includes Mobile Wallet) | ||
| Other Point of Sale | ||
| Online Sale | Card Payments | Debit Cards |
| Credit Cards | ||
| Bank Financing Prepaid Cards | ||
| Digital Wallets | ||
| Other Online Sales (includes Cash on Delivery, Bank Transfer, Buy Now Pay Later) |
| Retail |
| Entertainment and Digital Content |
| Healthcare |
| Hospitality and Travel |
| Government and Utilities |
| Other End-User Industries |
| By Mode of Payment | Point of Sale | Card Payments | Debit Cards |
| Credit Cards | |||
| Bank Financing Prepaid Cards | |||
| Digital Wallets (includes Mobile Wallet) | |||
| Other Point of Sale | |||
| Online Sale | Card Payments | Debit Cards | |
| Credit Cards | |||
| Bank Financing Prepaid Cards | |||
| Digital Wallets | |||
| Other Online Sales (includes Cash on Delivery, Bank Transfer, Buy Now Pay Later) | |||
| By End-User Industry | Retail | ||
| Entertainment and Digital Content | |||
| Healthcare | |||
| Hospitality and Travel | |||
| Government and Utilities | |||
| Other End-User Industries | |||


Key Questions Answered in the Report
How large will non-cash spending in the Netherlands be by 2031?
Transaction value is forecast to hit USD 273.71 billion by 2031, reflecting slow but steady growth in the Netherlands payments market.
Which segment grows fastest between 2026 and 2031?
Online Sale channels expand at a 1.03% CAGR, making them the quickest component of the Netherlands payments market.
Why is Healthcare important for future payment revenues?
Hospitals and clinics are embedding real-time co-pay and insurer adjudication, driving a 1.37% CAGR that outpaces Retail within the Netherlands payments market.
What role will Wero play after its 2026 Dutch launch?
It will unify instant account-to-account payments across multiple EU countries, offering merchants a low-cost rail that could capture share from cards.
How are processors offsetting lost interchange revenue?
They monetize fraud analytics, working-capital loans, and embedded treasury services to protect margins in the Netherlands payments industry.
Are small merchants embracing instant payments?
Adoption is slower among SMEs due to fee sensitivity and hardware cost, but regulatory push and cheaper tap-to-mobile options are expected to close the gap.
Page last updated on:


