Market Overview
| Study Period | 2020 - 2031 |
|---|---|
| Forecast Data Period | 2026 - 2031 |
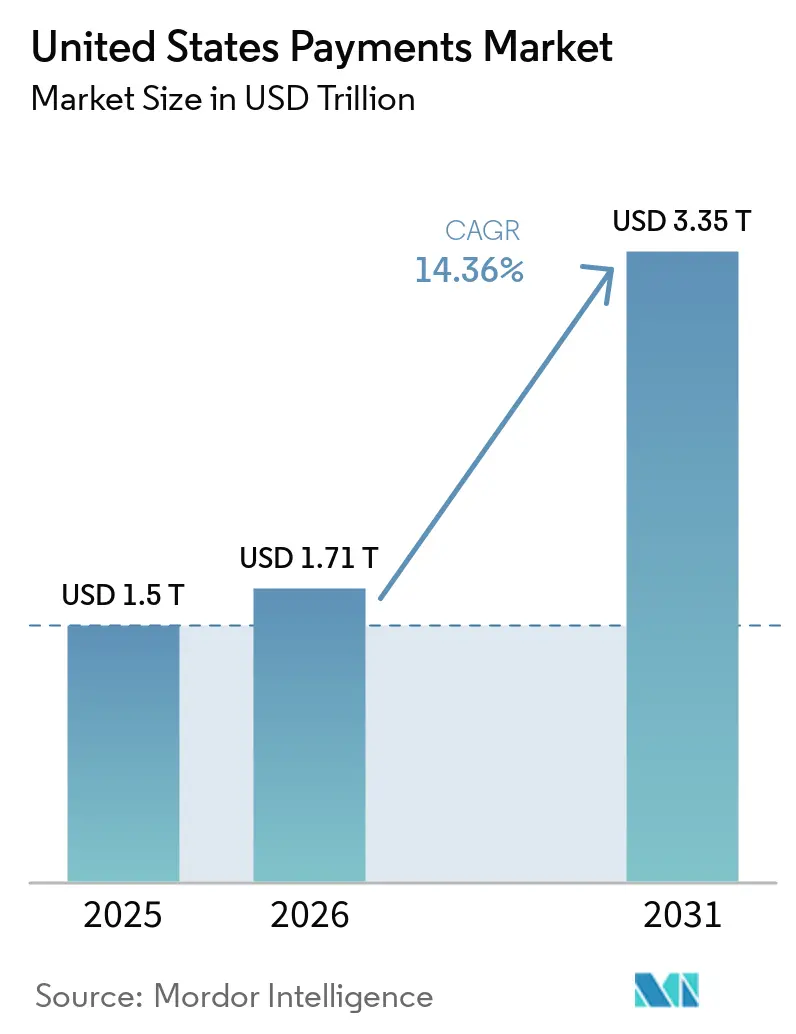
| Base Year Market Size (2025) | USD 1.5 Trillion |
| Market Size (2026) | USD 1.71 Trillion |
| Market Size (2031) | USD 3.35 Trillion |
| Growth Rate (2026 - 2031) | 14.36% CAGR |
| Market Concentration | High |
Major Players
*Disclaimer: Major Players sorted in no particular order Image © Mordor Intelligence. Reuse requires attribution under CC BY 4.0. |
|
United States Payments Market Analysis by Mordor Intelligence
The United States Payments Market size is projected to expand from USD 1.5 trillion in 2025 and USD 1.71 trillion in 2026 to USD 3.35 trillion by 2031, registering a CAGR of 14.36% between 2026 to 2031.
This expansion is anchored in the rapid shift from legacy card rails to instant-settlement networks, the widespread embrace of contactless hardware, and a legislative environment that actively rewards stablecoin experimentation. Instant rails such as FedNow have shortened settlement windows from days to seconds, letting mid-market enterprises unlock working-capital trapped in accounts receivable. Meanwhile, mobile wallets and tokenized credentials are curbing card-not-present fraud, lowering dispute reserves, and lifting authorization rates. Competitive strategies are diverging as incumbents defend interchange economics through tokenization, while fintech challengers monetize orchestration layers that blend payments, lending, and data analytics. These cross-currents create headroom for embedded finance, cross-border stablecoin corridors, and artificial-intelligence-driven reconciliation engines, sustaining double-digit expansion for the United States payments market through the end of the decade.
Key Report Takeaways
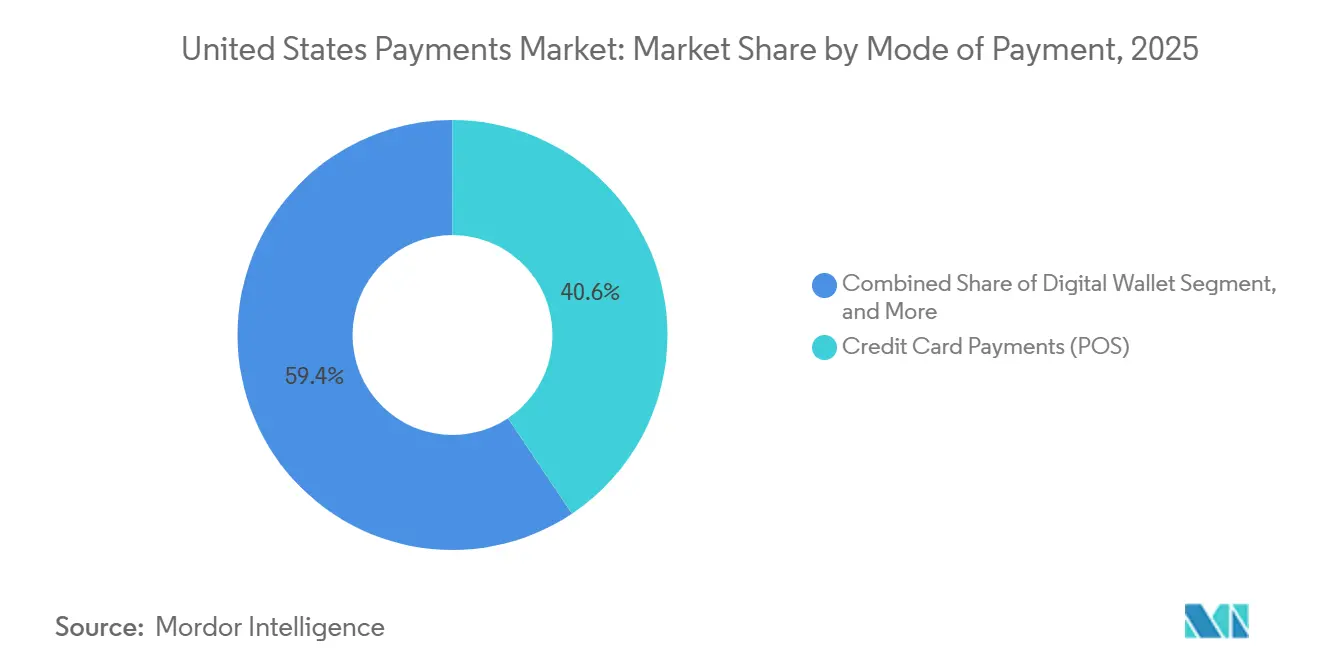
- By mode of payment, credit cards led with 40.62% of the United States payments market share in 2025. Account-to-account transactions in online channels are forecast to register a 15.63% CAGR through 2031, the fastest among payment modes.
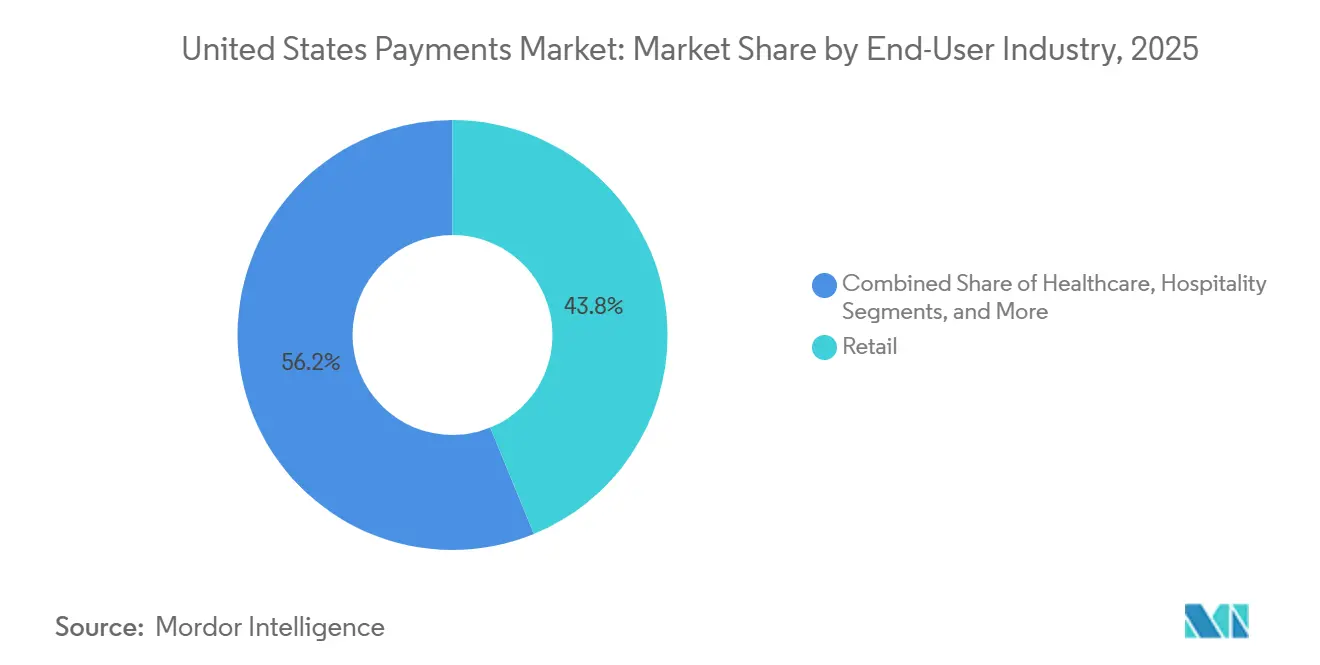
- By end-user industry, retail accounted for 43.82% of 2025 transaction value within the United States payments market. Healthcare payment volumes are projected to rise at a 15.82% CAGR to 2031, the highest among end-user verticals.
Note: Market size and forecast figures in this report are generated using Mordor Intelligence’s proprietary estimation framework, updated with the latest available data and insights as of January 2026.
United States Payments Market Trends and Insights
Drivers Impact Analysis*
| Driver | (~) % Impact on CAGR Forecast | Geographic Relevance | Impact Timeline |
|---|---|---|---|
| Surge in Contactless Card Issuance | +2.1% | National, higher penetration in urban centers and coastal regions | Medium term (2-4 years) |
| E-Commerce Volume Expansion | +3.2% | National, concentrated in metropolitan areas and digitally mature markets | Long term (≥ 4 years) |
| Smartphone Wallet Adoption | +2.8% | National, strongest in iOS-dominant regions and younger demographics | Medium term (2-4 years) |
| FedNow Instant-Rail Enablement of B2B A/R Automation | +2.4% | National, first movers among mid-market enterprises and regional banks | Short term (≤ 2 years) |
| Retail Media Networks Driving In-App One-Click Checkout | +1.9% | National, clustered in e-commerce hubs and digitally native brands | Medium term (2-4 years) |
| CBDC Sandbox Pilots Accelerating Bank-FinTech Integration | +1.3% | National, exploratory programs in major financial centers | Long term (≥ 4 years) |
| Source: Mordor Intelligence | |||
Surge in Contactless Card Issuance
Contactless credentials already ride in 69% of U.S. debit cards and are expected to reach full penetration by 2027 as issuers replace expiring plastics with NFC-enabled versions.[1]Board of Governors, “FedNow Service,” Federal Reserve, federalreserve.gov Merchant readiness has kept pace, with 87% of point-of-sale terminals accepting tap-to-pay by 2024, up from 43% in 2020.[2]Visa Inc., “Visa Contactless Acceptance Data,” visa.com Faster checkouts raise throughput by roughly 12-18 customers an hour at quick-service restaurants, adding USD 40,000-USD 60,000 in incremental annual revenue for large chains. Crucially, proximity-based authentication habituates users to device-initiated payments, helping smartphones claim 31% of in-store card-present transactions in 2025. The compounding network effect between card hardware, wallet software, and merchant acceptance places the United States payments market on a path toward near-ubiquitous contactless outcomes.
E-Commerce Volume Expansion
U.S. digital commerce registered significant growth, exceeding physical retail growth by more than 7 percentage points. Subscription-heavy consumer behavior, spanning grocery delivery to streaming media, generates data-rich, predictable revenue streams that acquirers can underwrite at lower fraud risk. Retail media networks amplify conversion by embedding one-click checkout next to sponsored placements, lifting purchase rates to 42% compared with 28% for multi-step flows.[3]Amazon. "Amazon Advertising Revenue." 2024. Solutions such as PayPal Fastlane auto-populate shipping and payment fields across 30 million merchants, cutting cart abandonment by 18 percentage points and producing material fee revenue. These vectors collectively reinforce the momentum propelling the United States payments market.
Smartphone Wallet Adoption
Apple Pay and Google Pay together served millions of U.S. users in 2024, representing a significant portion of adults and a robust share of in-store card-present activity. Penetration climbs to 52% in the 18-34 age bracket, signaling a durable generational pivot. Apple’s Tap to Pay on iPhone converts everyday handsets into merchant terminals, adding millions of micro-sellers to the acceptance base without incremental hardware cost. Payment providers such as Block report that most of 2024 merchant onboarding occurred in these mobile-only cohorts, unlocking USD 47 billion in addressable annual volume. As wallets absorb loyalty, rewards, and financing functions, they create a sticky front door to the United States payments market that incumbents must serve to remain relevant.
FedNow Instant-Rail Enablement of B2B A/R Automation
FedNow processed over 60 million transactions in its first operational year while enrolling more than 275 financial institutions. Average tickets of USD 1,847 underscore meaningful initial traction in business-to-business use cases. Companies deploying instant invoice payments have shaved 18-24 days off days-sales-outstanding, freeing cash equal to 4-6% of annual revenue and making early-payment discounts economically attractive. Redundant coverage from The Clearing House’s RTP network provides 24-hour uptime and risk mitigation for treasury teams, encouraging deeper adoption across middle-market firms. Instant-settlement rails therefore function as both a liquidity lever and a catalyst for SaaS-driven working-capital ecosystems within the United States payments market.
Restraints Impact Analysis*
| Restraint | (~) % Impact on CAGR Forecast | Geographic Relevance | Impact Timeline |
|---|---|---|---|
| Interchange Fee Litigation Uncertainty | -1.8% | National, with particular impact on merchant-dense regions and high-volume retail corridors | Medium term (2-4 years) |
| Fraud and Chargeback Cost Escalation | -2.3% | National, with elevated exposure in card-not-present channels and digital-first merchants | Short term (≤ 2 years) |
| 2027 PCI-DSS 4.0 Retrofit CAPEX Burden for SMBs | -1.4% | National, with disproportionate impact on small and medium-sized businesses | Short term (≤ 2 years) |
| Real-Time Payments Liquidity-Management Risk | -1.1% | National, with concentration in banks operating thin capital buffers | Medium term (2-4 years) |
| Source: Mordor Intelligence | |||
Interchange Fee Litigation Uncertainty
The rejection of a USD 30 billion settlement in 2024 exposed ongoing volatility in swipe-fee economics. Merchants now hesitate to invest in omnichannel acceptance until legal clarity emerges, while issuers temper spending on rewards programs traditionally funded by interchange spreads. The historical precedent of the Durbin Amendment, which triggered the removal of free checking for 68% of customers and slashed fraud-monitoring budgets, accentuates fears that further regulation could induce unintended consumer impacts. This overhang threatens to marginally dent the otherwise robust trajectory of the United States payments market.
Fraud and Chargeback Cost Escalation
U.S. payment fraud losses rose significantly in 2025 and are forecast to soar further by 2028, driven largely by card-not-present channels, which experience fraud rates notably higher than in-store transactions. Chargebacks in e-commerce already surpass the 0.3% network-monitoring threshold, obliging merchants to reserve 18-22 basis points of revenue for disputes. Though Visa’s token service cuts CNP fraud by 28% among adopters, integration costs of USD 75,000-USD 250,000 deter many mid-market retailers. The escalating cost of fraud mitigation effectively taxes margins and could shave more than two percentage points off the United States payments market CAGR if left unchecked.
*Our forecasts treat driver/restraint impacts as directional, not additive. The impact forecasts reflect baseline growth, mix effects, and variable interactions.
Segment Analysis
By Mode of Payment: Credit Cards Anchor POS While A2A Surges Online
Credit cards captured a 40.62% United States payments market share at point of sale in 2025, underpinned by rewards programs that rebate 1.5-5% of spend and secure 78% consumer loyalty to a primary card exceeding five years. Account-to-account payments booked USD 806 billion on Zelle in 2023 and are tracking a 15.63% CAGR through 2031, aided by integration into 2,100 mobile-banking apps serving 120 million users. Debit cards remain the workhorse at 86.7 billion transactions but see relative share erosion as wallets and instant transfer products displace traditional plastic. Digital wallets, already at 31% of card-present volume, subdivide into niche verticals such as premium retail, peer-to-peer, and cryptocurrency trading. Cash usage slipped to 16% of U.S. transaction value in 2023, reflecting both convenience gaps and the limited growth of physical currency in circulation. Buy-now-pay-later solutions, exemplified by Affirm’s USD 21.6 billion in fiscal 2024 GMV, cement installment credit as a mainstream checkout option. The interplay of these modes fosters channel diversity that buffers the United States payments market from single-rail disruption.
The United States payments market size for account-to-account transfers is projected to expand at double-digit pace as FedNow and RTP improve real-time liquidity and as merchants adopt lower-cost, low-fraud alternatives to cards. Tokenized credit rails will coexist, particularly for card-on-file subscriptions and high-ticket travel bookings where embedded protections remain valued. Anticipated acceleration in open-banking APIs and wallet-based credentials further tilts growth toward credential-less and biometric-based flows, positioning A2A as the share-gainer through 2031. In parallel, credit networks will emphasize premium rewards, token security, and global acceptance as defensive differentiators. Collectively these vectors ensure that no single modality dominates, underpinning a resilient architecture for the United States payments market.


By End-User Industry: Retail Dominates but Healthcare Accelerates
Retail held a commanding 43.82% share of 2025 transaction value, thanks to omnichannel adoption, private-label credit programs, and the retail-media monetization loop that redirects ad spend into subsidized payment experiences. Embedded checkouts, loyalty convergence, and same-day fulfillment models amplify volume density in retail corridors. The United States payments market size tied to retail is forecast to expand steadily as merchants upgrade to data-rich acceptance solutions that feed personalization engines while lowering fraud costs.
Healthcare, conversely, is the fastest riser with a 15.82% CAGR to 2031. The USD 4.5 trillion sector processed only 38% of patient payments electronically in 2022, leaving sizable white space. Price-transparency rules now obligate hospitals to list negotiated rates and accept digital settlement for balances above USD 500, catalyzing migration away from paper checks and phone-entered card numbers. Digital adoption trims transaction cost from USD 3.50-USD 7.00 to roughly USD 0.35-USD 0.90, freeing provider budgets for care delivery. As clearinghouses, fintech bill-pay portals, and health-savings-account rails converge, the United States payments industry can capture untapped volume while alleviating administrative waste in healthcare.
Other verticals, entertainment, hospitality, government, and utilities, continue their transformation journeys. Click-to-Pay reduced abandonment for subscription entertainment, while mobile check-ins cut hotel front-desk labor expenditure. Government mandates across 34 states funnel tax and registration fees into digital channels, expanding addressable volume. The breadth of vertical adoption provides diversified momentum that underpins the overarching expansion of the United States payments market.
Geography Analysis
The United States payments market exhibits nationwide momentum, yet regional nuances influence adoption speed and mix. In dense coastal metros, contactless penetration surpasses 80% of eligible transactions, fueled by higher smartphone ownership and early NFC terminal rollouts. Rural regions, while initially slower, show rapid catch-up as acquirers bundle contactless readers with mandated EMV compliance, closing the acceptance gap.
Midwestern states demonstrate outsized uptake of instant B2B payment rails because manufacturing supply chains benefit materially from faster receivable cycles. Regional banks leverage FedNow participation to differentiate treasury services, driving enrollment among middle-market exporters. Southern corridors, characterized by a high share of micro-merchants, are experiencing robust expansion in Tap to Pay on iPhone adoption, reducing dependence on cash and check payments.
Digital wallets follow demographic contours, for instance, iOS-dominant pockets such as California and New York lead in Apple Pay usage, while Android-leaning states like Texas see stronger Google Pay adoption. Contactless fare collection in public transit further entrenches the use of wallets in metropolitan areas. Together, these patterns confirm that while growth is national, sub-regional levers, device mix, industry composition, and bank readiness shape the distribution of value within the United States payments market.
Competitive Landscape
The five largest processors, Visa, Mastercard, American Express, Discover, and PayPal, collectively handled most of 2025 transaction value, underscoring high concentration. Incumbents buttress their position with tokenization, risk-scoring, and global acceptance, yet margin compression looms as interchange caps approach and account-to-account alternatives gain merchant mindshare. Visa’s token platform already exchanges 20 billion dynamic credentials annually, cutting fraud 28% for participating merchants, but that defensive measure has not stemmed peer-to-peer migration to Zelle.
Stripe exemplifies the orchestration model, embedding acquiring, lending, and tax capabilities into SaaS platforms and logging USD 17.2 billion in 2024 revenue. Block leverages Cash App’s network effects to cross-sell Bitcoin trading, instant deposits, and debit interchange, insulating itself from regulatory shocks to any single income stream. Adyen’s single-stack architecture boosts authorization rates and curbs fraud, proving the economic upside of unified data models.
White-space arenas include instant B2B settlement, checkout-integrated insurance, and cross-border stablecoin corridors. FedNow currently captures a fraction of a USD 28 trillion opportunity in B2B volumes, while tokenized deposit pilots at Mastercard foreshadow real-time, programmable money. Stablecoins trimmed remittance fees to near 1.2% and cut settlement windows to under a minute, suggesting strategic headwinds for correspondent banking incumbents but upside for agile processors. The unfolding battleground points to continual reinvention that will characterize the United States payments market through 2031.
United States Payments Industry Leaders
-
Stripe, Inc.
-
Beacon Payments LLC
-
Dwolla Inc.
-
PayPal Holdings Inc.
-
Ingenico (Safran Group)
- *Disclaimer: Major Players sorted in no particular order

Recent Industry Developments
- January 2026: Visa and JPMorgan Chase unveiled an account-to-account pilot that bypasses card networks and settles merchant funds in under 10 seconds, targeting USD 12 billion in annual volume.
- December 2025: Stripe purchased Bridge for USD 1.1 billion to embed stablecoin settlement and shrink cross-border payment time from multiple days to two hours.
- November 2025: Mastercard broadened its multi-token network to include central-bank digital currencies and tokenized deposits by signing 14 financial-institution pilots.
- October 2025: Block launched Square Loans 2.0, an AI-driven advance platform approving funding in under 60 seconds with repayments tied to daily card sales.


Research Methodology Framework and Report Scope
Market Definitions and Key Coverage
Our study defines the United States payments market as the fee-based revenue pools, interchange, acquiring charges, scheme fees, and ancillary wallet or account-to-account costs earned when consumers, businesses, or public entities move funds at point-of-sale or online within U.S. borders. According to Mordor Intelligence, inbound cross-border remittances, person-to-person transfers, and domestic B2B settlements are included once they clear through U.S. intermediaries.
Scope Exclusions: Transactions settled wholly in crypto assets, pure cash reimbursement cycles, and revenue generated overseas by U.S. providers lie outside this study.
Segmentation Overview
-
By Mode of Payment
-
Point of Sale
- Debit Card Payments
- Credit Card Payments
- Account-to-Account (A2A) Payments
- Digital Wallet
- Cash
- Other Point-of-Sale Payment Mode
-
Online Sale
- Debit Card Payments
- Credit Card Payments
- Account-to-Account (A2A) Payments
- Digital Wallet
- Cash-on-Delivery
- Other Online Sales Payment Mode
-
Point of Sale
-
By End-User Industry
- Retail
- Entertainment
- Hospitality
- Healthcare
- Other End-User Industries
Detailed Research Methodology and Data Validation
Primary Research
Mordor analysts hold structured interviews with acquirers, network executives, merchant treasurers, and fintech product heads across all regions; the conversations verify fee trajectories, wallet penetration targets, and instant rail rollout timelines. Short surveys of independent retailers and healthcare billers plug residual data gaps.
Desk Research
We start by anchoring volumes and ticket sizes with open-access benchmarks such as the Federal Reserve Payments Study, U.S. Census monthly retail sales, FDIC call reports, Consumer Financial Protection Bureau card databases, and Bureau of Economic Analysis consumption tables. Central bank FedNow and RTP statistics further refine real-time rail adoption.
Those public lines are then enriched with issuer 10-Ks, merchant acquirer filings, trade association briefs, and two paid datasets, D&B Hoovers for issuer revenue splits and Dow Jones Factiva for deal-flow alerts. The sources listed illustrate, not exhaust, the wider pool consulted for validation.
Market-Sizing & Forecasting
We employ a top-down build that multiplies 2024 non-cash transaction counts by weighted average fee yields, adjusts for channel migration, and is then sanity checked through selective bottom-up roll-ups of acquirer revenues. Key variables in the model, contactless card issuance, FedNow transaction velocity, e-commerce basket growth, regulatory interchange caps, and fraud loss ratios feed a multivariate regression that projects values through 2030. Gap areas in bottom-up samples are bridged with median estimates validated in primary discussions.
Data Validation & Update Cycle
Outputs are benchmarked against independent indicators; any abnormal variance triggers re-contact with senior sources before analyst sign-off. Reports refresh annually, with interim revisions when legislation or macro shocks materially shift inputs.
Why Mordor's US Payments Baseline Commands Confidence
Published estimates often diverge because firms choose different revenue definitions, territorial cuts, and refresh cadences.
By aligning scope strictly to U.S. fee income and updating every year, we enable decision-makers to compare like with like.
Benchmark comparison
| Market Size | Anonymized source | Primary gap driver |
|---|---|---|
| USD 13.24 B (2025) | Mordor Intelligence | - |
| USD 36.07 B (2024) | Regional Consultancy A | Counts only gateways and processors, omits interchange. |
| USD 3.06 T (2024) | Industry Association B | Reports gross digital transaction value, not fee revenue. |
| USD 370 B (2024) | Global Consultancy C | Covers North America and applies macro conversion ratios. |
These comparisons show that scope, metric choice, and geographic precision largely explain headline gaps. By basing estimates on clearly defined revenue pools, multi-source validation, and timely updates, Mordor Intelligence delivers a dependable baseline clients can trust.


Key Questions Answered in the Report
What is the projected value of the United States payments market by 2031?
The market is forecast to reach USD 3.35 trillion in 2031.
How fast are account-to-account payments expected to grow?
They are projected to register a 15.63% CAGR through 2031.
Which end-user vertical is growing the quickest in payment volume?
Healthcare payments are expanding at a 15.82% CAGR through 2031.
How much fraud loss is anticipated by 2028?
U.S. payment fraud losses are projected to climb to USD 91 billion by 2028.
What share of transactions did credit cards hold at U.S. points of sale in 2025?
Credit cards commanded 40.62% of POS transaction value in 2025.
Page last updated on:


