
Market Overview
| Study Period | 2021 - 2031 |
|---|---|
| Forecast Data Period | 2026 - 2031 |
| Historical Data Period | 2021 - 2024 |
| Market Size (2026) | USD 155.41 Billion |
| Market Size (2031) | USD 182.24 Billion |
| Growth Rate (2026 - 2031) | 4.58 % |
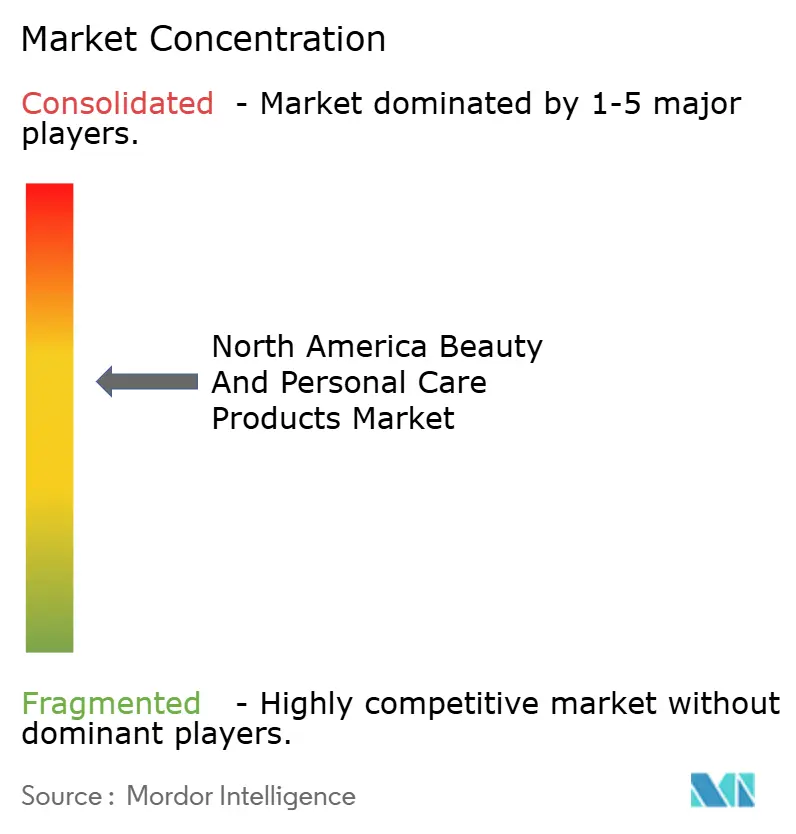
| Market Concentration | Medium |
Major Players
*Disclaimer: Major Players sorted in no particular order Image © Mordor Intelligence. Reuse requires attribution under CC BY 4.0. |
|
North America Beauty and Personal Care Products Market Analysis by Mordor Intelligence
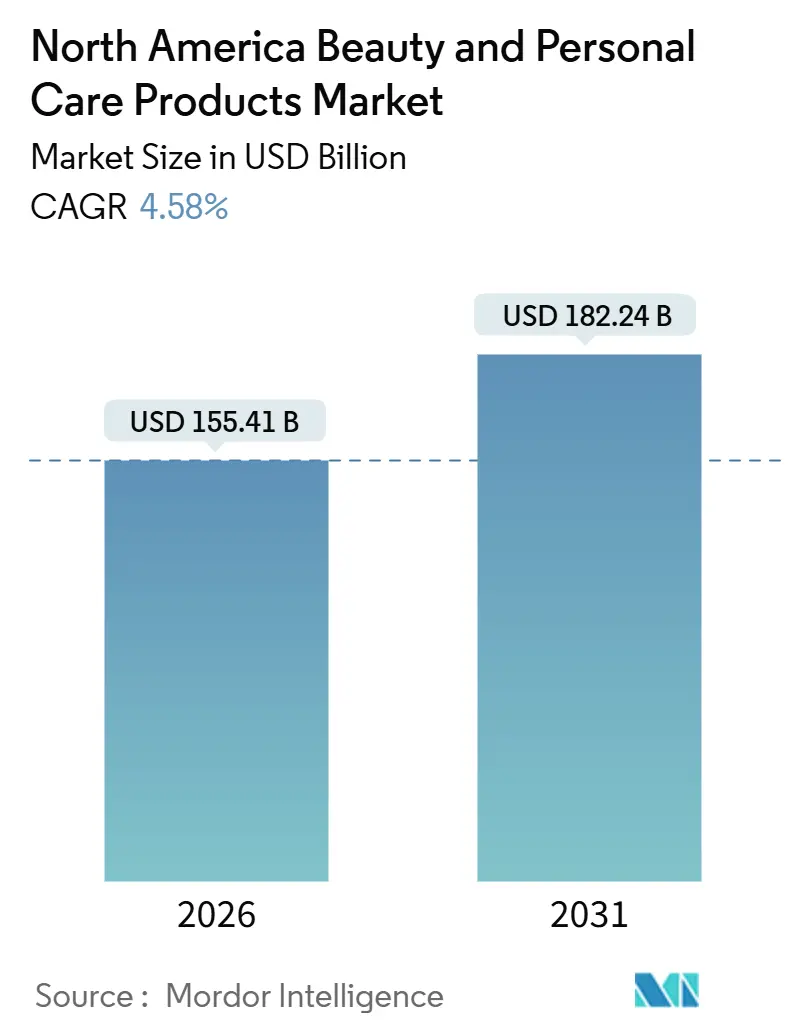
The North America beauty and personal care market size reached USD 155.41 billion in 2026 and is projected to expand to USD 182.24 billion by 2031, advancing at a 4.58% CAGR. The growth trajectory reflects a decisive consumer pivot toward science-backed formulations, digital shopping journeys, and ingredient transparency. Personal care items hold the lion’s share of spending, oral-care innovation lifts repeat purchase frequency, and men’s grooming broadens the addressable base beyond traditional demographics. Regulatory modernization—led by the U.S. Food and Drug Administration (FDA) and Health Canada—raises compliance costs yet improves consumer trust, prompting brands to prioritize safety substantiation and full-formula disclosure. At the same time, nearshoring, particularly to Mexico, mitigates tariff exposure and shortens lead times while stimulating local employment. Competitive intensity sits at a moderate level, leaving room for digital-first disruptors that excel at social commerce and ethical positioning.
Key Report Takeaways
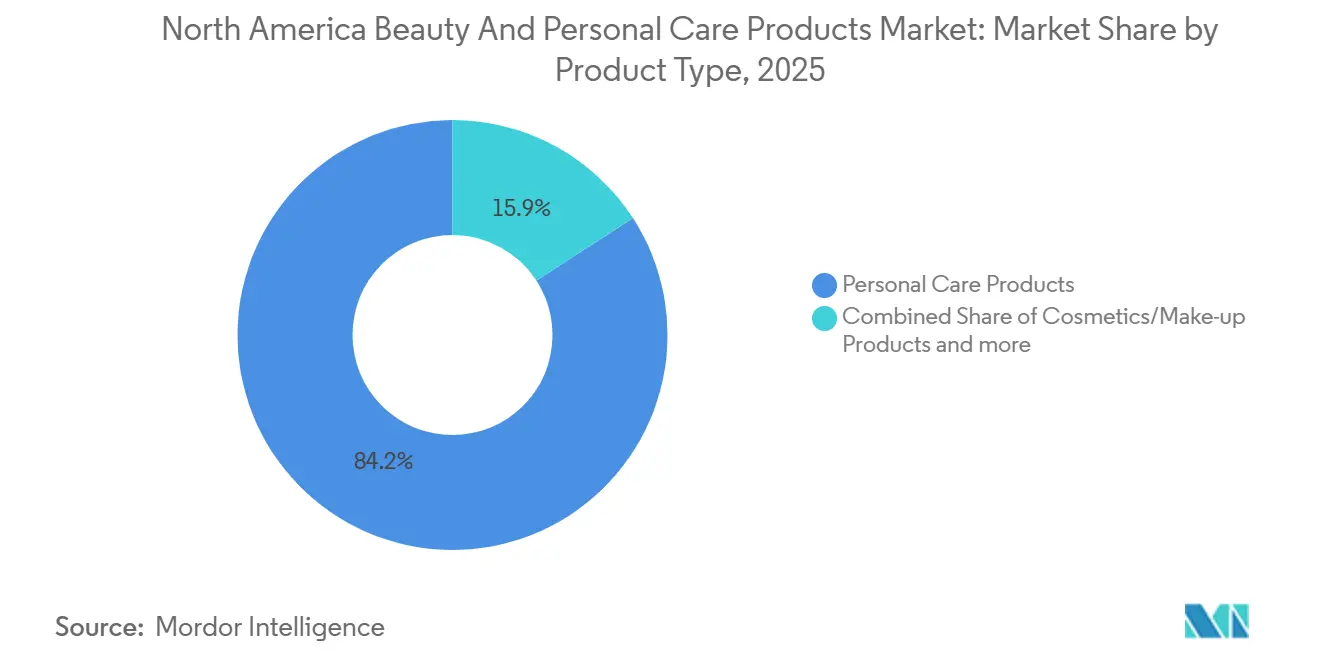
- By product type, personal care products commanded 84.15% of the North American beauty and personal care market share in 2025 and are projected to reach a CAGR of 5.34% during the forecast period.
- By category, mass products held 72.25% of 2025 revenue, but premium offerings are forecast to expand at a 5.48% CAGR through 2031.
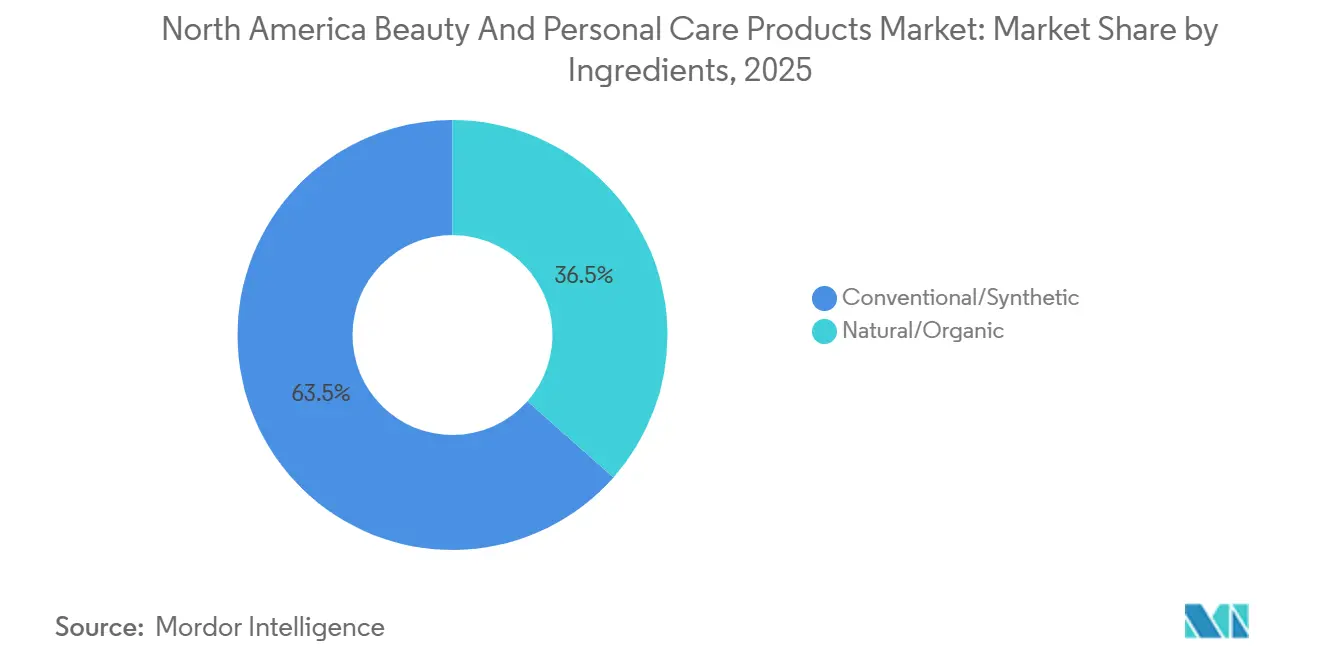
- By ingredients, conventional and synthetic inputs retained 63.48% revenue in 2025; however, natural and organic alternatives are set to grow at a 6.23% CAGR, the strongest pace among all segmentation types.
- By distribution channel, online retail captured 35.62% of sales in 2025 and will post a 6.34% CAGR through 2031, outpacing specialist stores, supermarkets, and other formats.
- By geography, the United States led with 80.29% revenue in 2025, while Mexico is projected to record the fastest 5.57% CAGR through 2031.
Note: Market size and forecast figures in this report are generated using Mordor Intelligence’s proprietary estimation framework, updated with the latest available data and insights as of January 2026.
Market Trends and Insights
Drivers Impact Analysis of North America Beauty and Personal Care Products Market*
| Drivers | (~) % Impact on CAGR Forecasts | Geographic Relevance | Impact Timeline |
|---|---|---|---|
| Rising Skin and Hair Issues From Pollution and Lifestyle Factors | +0.7% | United States, Canada, Mexico (urban centers) | Medium term (2-4 years) |
| Growing Awareness about Oral Hygiene and Dental Health | +0.5% | United States, Canada | Short term (≤ 2 years) |
| Surging Demand for Anti-Aging Products Amid Aging Populations and Preventive Skincare Trends | +0.9% | United States, Canada | Long term (≥ 4 years) |
| Consumers' Inclination Towards Natural and Organic Products | +1.2% | United States, Canada, with spillover to Mexico | Medium term (2-4 years) |
| Awareness of Vegan and Cruelty-Free Beauty Standards | +0.8% | United States, Canada | Medium term (2-4 years) |
| Rapid E-Commerce Growth and Enhanced Accessibility | +1.3% | United States, Canada, Mexico | Short term (≤ 2 years) |
| Source: Mordor Intelligence | |||


Rising Skin and Hair Issues from Pollution and Lifestyle Factors
Urban populations in North America are increasingly affected by oxidative stress caused by particulate matter. According to a May 2025 report from the American Journal of Managed Care, 99% of the global population resides in areas that do not meet WHO air quality standards. Studies show that exposure to fine particulates is linked to a more than 20% increase in facial pigment spots, driving demand for anti-pollution serums and skin barrier-repair formulations. Research published in Frontiers in Pharmacology and the Journal of the European Academy of Dermatology demonstrates that pollutants activate the aryl hydrocarbon receptor, which triggers melanogenesis and collagen degradation. In response, brands are incorporating antioxidants such as niacinamide and resveratrol, positioning these products as daily protective solutions rather than corrective treatments. This trend is particularly evident in metropolitan areas of the United States and Canada, where industrial emissions and commuting patterns intensify exposure. The shift from reactive to preventive skincare habits is extending product lifecycles and increasing average basket values, benefiting both mass-market and premium brands.
Growing Awareness About Oral Hygiene and Dental Health
The oral care market size is driven by increasing awareness of preventive dental health. According to the Centers for Disease Control and Prevention (CDC), more than 21% of United States adults between the ages of 20-64 had untreated cavities in 2024 [1]Source: Centers for Disease Control and Prevention (CDC), "2024 Oral Health Surveillance Report: Selected Findings", cdc.gov. These health concerns have led to increased adoption of advanced dental care products, including oscillating and sonic toothbrushes. The market is evolving toward subscription-based models for brush head replacements and oral care products, creating stable revenue streams. The integration of improved battery technology and recyclable materials in oral care products addresses growing environmental concerns. Consumer preference for premium oral care products suggests that North American oral care manufacturers may position their products similarly to skincare offerings, bridging the gap between dental hygiene and beauty products.
Surging Demand for Anti-Aging Products Amid Aging Populations and Preventive Skincare Trends
Estée Lauder's SIRTIVITY-LP technology, which focuses on sirtuin pathways to promote cellular longevity, highlights the transition from topical hydration to molecular-level interventions. Evolus gained FDA approval in February 2025 for Evolysse, a hyaluronic acid dermal filler designed for mid-face volumization, expanding options for both at-home and in-office treatments. In December 2025, the FDA proposed including bemotrizinol, a broad-spectrum UV filter, in its approved sunscreen ingredient list[2] Source: U.S. Food and Drug Administration. "FDA Proposes Sunscreen Ingredient Bemotrizinol." fda.gov. This proposal addresses a long-standing gap in photostable UVA protection, bringing the U.S. closer to European and Asian standards. At-home devices like NuFACE microcurrent tools and NIRA laser systems are making professional-grade treatments more accessible. Circana reported that prestige skincare sales in the U.S. increased by 4% in the first nine months of 2025, reaching USD 24.1 billion. In Canada, 54% of consumers adhere to a daily skincare routine, and 58% demonstrate brand loyalty, supporting the ongoing trend of premiumization. The convergence of aging Baby Boomers and Gen Z's preventive approach creates a multi-generational market, challenging traditional age-based marketing strategies.
Consumers' Inclination Towards Natural and Organic Products
Although 72% to 74% of consumers prefer products with organic ingredients, an NSF International survey revealed that trust in voluntary labeling remains low. This lack of trust has driven increased demand for third-party certifications such as NSF/ANSI 305 and USDA Organic. According to NATRUE's 2025 trend report, biotechnology-derived ingredients—like lab-grown squalane and fermented hyaluronic acid—represent the next innovation, combining sustainability with effectiveness. In Canada, natural and organic formulations constitute 40% of the skincare market. Additionally, a survey by the Canadian Health Food Association (CHFA) found that 77% of consumers agree with the sentiment that "nature knows best." While the Organic Trade Association has reported strong growth in the organic personal care sector, specific 2025 figures remain under embargo until the full year's data is finalized. Brands face the challenge of aligning clean formulations with performance expectations. Preservative-free products, while pure, often have a shorter shelf life, whereas synthetic alternatives provide stability but may not align with consumer preferences. The regulatory environment remains fragmented, lacking a unified North American standard, which has allowed certification bodies to play a critical role in governance.
Restraints Impact Analysis of North America Beauty and Personal Care Products Market*
| Restraints | (~) % Impact on CAGR Forecasts | Geographic Relevance | Impact Timeline |
|---|---|---|---|
| Consumer Concerns Over Product Safety and Ingredients | -0.6% | United States, Canada | Short term (≤ 2 years) |
| Counterfeit Products Affecting Brand Reputation | -0.5% | United States, Canada, Mexico | Medium term (2-4 years) |
| Supply Chain Disruptions Affecting Boutique and Local Brands | -0.4% | United States, Canada, Mexico | Short term (≤ 2 years) |
| Price Sensitivity of Premium Products | -0.7% | United States, Canada | Medium term (2-4 years) |
| Source: Mordor Intelligence | |||
Consumer Concerns Over Product Safety and Ingredients
In December 2022, the FDA introduced the Modernization of Cosmetics Regulation Act (MoCRA). By January 2025, the agency's cosmetic database expanded significantly, growing from 35,102 listings to 589,762. This 16-fold increase, driven by enhanced compliance and stricter oversight, included 12,049 registered facilities as of July 2025. While brands face higher costs for safety substantiation and labeling updates, consumers now have access to a searchable database that facilitates ingredient-level research. Similarly, Health Canada requires manufacturers to disclose all ingredients in descending order of predominance and enforces restrictions on certain preservatives, such as parabens and formaldehyde-releasing agents. Social media amplifies isolated adverse events into widespread controversies, often pressuring brands to reformulate or recall products even when incidents lack statistical significance. The growing prevalence of "free-from" claims—such as paraben-free or sulfate-free—creates a negative perception of conventional ingredients, complicating consumer education and driving costly reformulation cycles for brands.
Counterfeit Products Affecting Brand Reputation
In fiscal 2025, U.S. Customs and Border Protection (CBP) confiscated 79 million counterfeit items, valued at an estimated USD 7.3 billion. Significantly, in fiscal 2023, beauty and personal care products accounted for 31% of these seized goods[3]Source: U.S. Customs and Border Protection, “Trade Enforcement Statistics,” cbp.gov. A 2024 survey conducted by MarqVision revealed that 31.8% of shoppers unknowingly purchased counterfeit beauty products through social media. Alarmingly, one in three of these consumers stated they would not buy the authentic brand again after a negative experience with a counterfeit. Highlighting the serious risks, Los Angeles authorities in 2018 seized counterfeit cosmetics worth USD 700,000, which were found to be contaminated with fecal matter. This incident emphasizes the health risks that go beyond brand dilution. Over 90% of counterfeit seizures occur in mail and express environments, where the high volume of small packages overwhelms inspection processes. OECD data indicates that China and Hong Kong are key contributors, accounting for 45% to 62% of seized items. This reflects both the concentration of manufacturing and the prominence of e-commerce export routes. To combat counterfeiting, brands are adopting advanced strategies, including blockchain traceability, QR-code authentication, and takedown teams to monitor online marketplaces. However, counterfeiters continue to adapt, replicating packaging and exploiting jurisdictional loopholes. The consequences are significant; when consumers associate counterfeit product failures with genuine brands, it leads to reputational damage, eroding trust and reducing lifetime customer value.
*Our forecasts treat driver/restraint impacts as directional, not additive. The impact forecasts reflect baseline growth, mix effects, and variable interactions.
North America Beauty and Personal Care Products Market Segment Analysis
By Product Type:
Personal Care Dominates with Oral InnovationIn 2025, personal care products accounted for 84.15% of the market share and are expected to grow at a 5.34% CAGR through 2031, surpassing cosmetics. This growth is primarily driven by advancements in oral care and the increasing normalization of men's grooming. Hair care products are addressing urban environmental challenges with anti-pollution shampoos and scalp-health serums. Skin care is segmented into facial, body, and lip-and-nail categories, each tailored to specific consumer habits. Bath and shower products, such as shower gels and soaps, face commoditization challenges but continue to lead in volume within mass channels. Oral care, which includes toothbrushes, toothpastes, mouthwashes, and rinses, has gained momentum from Procter & Gamble's FDA-approved Crest Pro-Health Clinical Plaque Control and Oral-B's AI-powered iO Series 10 toothbrush, launched at CES 2024. Men's grooming products at Bath & Body Works grew by 50% over three years, reflecting a decline in gender-specific purchasing norms. Deodorants and antiperspirants are transitioning to aluminum-free formulations.
Although smaller in scale, cosmetics and makeup products capture aspirational spending and benefit from viral social media trends. Facial cosmetics, such as foundations and concealers, now emphasize skin-like finishes and SPF integration. Eye cosmetics, including mascaras and eyeliners, drive impulse purchases, while lip and nail makeup products maintain high repurchase rates. The FDA's MoCRA implementation has increased compliance costs for color cosmetics due to stricter pigment testing, favoring established companies with in-house laboratories. E.l.f. Beauty is disrupting the cosmetics market with its 100% vegan positioning, proving that ethical formulations can be cost-effective. Fenty Beauty has raised the bar with its inclusive range of over 50 foundation shades, prompting legacy brands to adapt. The personal care segment's strong 5.34% CAGR underscores its broad appeal and resilience.

By Category:
Premium Gains Momentum Amid Mass DominanceIn 2025, mass products accounted for 72.25% of the market share. However, premium offerings are expected to grow at a 5.48% CAGR through 2031, reflecting a trend toward bifurcation rather than widespread democratization. In 2024, masstige skincare products, typically sold in mass channels but positioned as prestige, grew six times faster than traditional prestige offerings. Baird Equity Research reported a 17% expansion, indicating that consumers are opting for these products without compromising on perceived efficacy. Circana data showed that the United States mass beauty sales increased by 5%, reaching USD 54.5 billion by September 2025. This growth outpaced the 4% rise in prestige sales, which totaled USD 24.1 billion. In response, premium brands are launching tiered product lines and emphasizing dermatologist endorsements to validate their higher price points.
The mass segment thrives on volume and extensive distribution, with supermarkets, hypermarkets, and drugstores serving as key channels for impulse purchases. Retailers like Target and Walmart, through their private-label offerings, may compress margins but simultaneously expand the market by lowering entry barriers. Premium products, on the other hand, are concentrated in specialty stores, cosmetics and personal care stores, and online platforms, where curated selections and personalized consultations justify their higher price points. The 5.48% CAGR for premium offerings reflects affluent consumers' willingness to invest in innovation, sustainability certifications, and brand heritage, even as middle-income shoppers gravitate toward masstige alternatives. Meanwhile, Mexico's growing middle class is driving mass-market penetration, while premium imports are gaining traction in urban areas. This division within the category underscores a dual reality: price sensitivity coexists with premiumization, as different consumer groups prioritize distinct value propositions.
By Ingredients:
Natural and Organic Surge Despite Synthetic LeadIn 2025, conventional and synthetic ingredients accounted for a 63.48% market share. However, natural and organic formulations are expected to grow at a 6.23% CAGR through 2031, representing the fastest growth among all segments. An NSF International survey revealed that 72% to 74% of consumers prefer organic ingredients. However, low trust in voluntary labeling has increased demand for third-party certifications, such as NSF/ANSI 305 and USDA Organic. NATRUE's 2025 trend report identifies biotechnology-derived ingredients, including lab-grown squalane and fermented hyaluronic acid, as the next innovation, combining sustainability with effectiveness. In Canada, natural and organic formulations represent 40% of the skincare market, with 77% of consumers agreeing that “nature knows best.” E.l.f. Beauty's fully vegan product range disproves the belief that ethical products must carry a premium price, showing they can succeed in the mass market.
Conventional and synthetic ingredients maintain market dominance due to their reliable performance, longer shelf life, and regulatory familiarity. Preservatives like phenoxyethanol and parabens protect against microbial contamination, while synthetic emulsifiers provide stability under varying temperature conditions. The FDA's MoCRA requires ingredient transparency but only restricts synthetic compounds deemed unsafe, allowing brands flexibility in formulation. Health Canada enforces similar disclosure requirements, with specific restrictions on preservatives and colorants. The natural and organic segment's 6.23% CAGR reflects growing consumer interest in clean formulations. However, the 63.48% share of synthetic ingredients underscores ongoing concerns about efficacy and safety. Brands are addressing this dynamic by offering dual portfolios—conventional products for performance-focused consumers and natural alternatives for those driven by values. This division in ingredients mirrors the broader market trend, where different consumer groups prioritize distinct product attributes.

By Distribution Channel:
Online Retail Leads GrowthIn 2025, online retail stores accounted for 35.62% of the distribution share, leading all channels with a projected 6.34% CAGR growth through 2031. The U.S. Census Bureau reported that e-commerce represented 16.4% of total retail sales in Q3 2025, while personal care e-commerce reached USD 54.3 billion in 2024, with penetration rates ranging from 30% to 35%. McKinsey predicts that by 2030, digital channels will represent one-third of global beauty sales, driven by augmented-reality try-ons, influencer-led discovery, and subscription models. Amazon has solidified its leadership in North American beauty e-commerce by leveraging Prime memberships and same-day delivery to shorten purchase cycles.
Supermarkets and hypermarkets remain the leaders in mass-market volume, appealing to time-pressed consumers with their one-stop shopping convenience. Walmart and Target are expanding their beauty offerings by introducing prestige brands, enabling consumers to trade up without visiting specialty stores. Other channels, including pharmacies, direct-to-consumer websites, and duty-free outlets, address niche demands but lack the scale to drive overall growth. The 6.34% CAGR for online channels reflects inherent advantages such as lower overhead costs, personalized recommendations, and effortless replenishment. However, online platforms also expose brands to counterfeit risks, with 90% of seized fake goods entering through mail and express shipments. To combat this, brands are investing in blockchain traceability and QR-code authentication to secure their digital sales, though counterfeiters continue to adapt by imitating packaging.
Geography Analysis
United States Beauty and Personal Care Products Market
In 2025, the United States led North America's beauty and personal care sector, contributing 80.29% of the region's revenue. This leadership was driven by high per-capita spending, an advanced retail infrastructure, and regulatory policies that encourage innovation. The FDA's Modernization of Cosmetics Regulation Act (MoCRA), implemented in December 2022, significantly expanded its cosmetic database from 35,102 listings to 589,762 by January 2025. This development not only strengthened compliance but also enhanced consumer trust. Although the U.S. market's maturity limits organic growth, premiumization and channel innovation have supported mid-single-digit expansion. However, counterfeit products remain a significant challenge, as U.S. Customs and Border Protection seized 79 million counterfeit items valued at USD 7.3 billion in fiscal 2025.
Canada and Mexico Beauty and Personal Care Products Market
The Canadian Health Food Association found that 77% of Canadians believe "nature knows best." Health Canada enforces strict labeling requirements for whitening products containing more than 3% hydrogen peroxide, which necessitates clinical studies. While this raises compliance costs, it also strengthens consumer confidence. However, Canada's bilingual market requires dual-language packaging, adding complexity and creating a barrier for smaller players. Mexico is poised for the fastest growth in the region, with a projected CAGR of 5.57% through 2031. This growth is fueled by a growing middle class, nearshoring investments, and the expansion of local brands. L'Oréal has committed USD 80 million to expand its manufacturing operations in Mexico by 2026, with 70% of the output from its San Luis Potosí plant being exported to the U.S. market.
Mexico and the Caribbean Beauty and Personal Care Products Market
In 2024, Mexico's beauty market exceeded MXN 280 billion (approximately USD 14 billion), reflecting a 6% year-over-year growth. This positions Mexico as the second-largest beauty market in Latin America and among the top 10 globally. While COFEPRIS, Mexico's regulatory authority, oversees cosmetic safety, its enforcement is less stringent compared to the FDA or Health Canada, creating opportunities for agile market entrants. As awareness campaigns gain traction in urban areas, male grooming and sunscreen categories present significant growth potential. Meanwhile, the Caribbean territories of North America rely heavily on tourism-driven duty-free channels, although detailed market data remains limited. This geographic distribution highlights a clear trend: emerging markets are driving growth, while mature markets focus on premiumization and channel innovation.
Regulatory Landscape
In the United States, MoCRA requires facility registration, product listing, safety substantiation, and adverse event readiness, with the FDA issuing draft guidance in December 2025 clarifying recall triggers and processes. Canada operates under the Food and Drugs Act and Cosmetic Regulations, with Health Canada fragrance allergen labeling requirements that took effect on April 12, 2026, increasing labeling complexity for cross-border SKUs. A parallel thread is the 2026 USMCA joint review that keeps trilateral trade and sourcing risks on the agenda for North American beauty supply chains that rely on trilateral movement of ingredients, components, and finished goods.
Value Chain Analysis
The North American beauty and personal care value chain starts with upstream inputs such as surfactants, emollients, pigments, preservatives, fragrances, and packaging components, followed by formulation/R&D and scale manufacturing that is frequently outsourced to contract development and manufacturing organizations (CDMOs). CDMOs and integrated operators support brands with compounding, filling, testing, and packaging, while regulatory requirements under MoCRA in the United States and Health Canada notification rules in Canada increase the importance of validated quality systems, lot traceability, and documentation that can travel with products across channels and borders.
Downstream, brands distribute through a mix of mass retail, specialty, and rapidly scaling e-commerce and social commerce pathways, which depend on specialized 3PL partners for kitting, temperature-aware handling, returns processing, and retailer-compliant routing guides. Distribution and fulfillment specialists such as Grace Beauty (omni-channel distribution footprint), and cosmetics-focused fulfillment operations across multiple US locations (for example, Advanced Distribution Systems, Inc.) illustrate how logistics capabilities have become a differentiator as assortments broaden and replenishment cycles shorten. Bottlenecks persist around cross-border compliance administration, counterfeit exposure in parcel networks, and the operational burden of variant-heavy packaging and labeling for the United States, Canada (including bilingual requirements), and Mexico.
Competitive Landscape
In North America, the beauty and personal care products market is witnessing a moderate consolidation trend. This trend paves the way for both established multinationals and emerging disruptors to vie for market share. While market leaders harness the advantages of global supply chains, robust research and development, and expansive marketing reach, smaller players carve out their niche. They do this through direct-to-consumer models and authentic brand narratives that deeply resonate with targeted consumer segments. Additionally, the market's moderate consolidation allows for innovation and competition, fostering a dynamic environment where both established and new entrants can thrive.
Strategic moves in the market underscore a pronounced shift towards technology integration. A case in point is Estée Lauder Companies' collaboration with Microsoft in April 2024, leading to the creation of an AI innovation lab aimed at refining product development and enhancing customer experiences. This partnership highlights the growing importance of artificial intelligence in driving innovation and meeting evolving consumer demands. Major players in the industry bolster their market positions through a combination of extensive research capabilities, well-established distribution networks, and formidable financial resources.
The market landscape is a blend of traditional beauty giants and specialized premium brands. Global behemoths like L'Oréal, Procter & Gamble, Estée Lauder, and Unilever Plc dominate the scene, employing multi-brand strategies and offering comprehensive product lines. The competitive landscape increasingly favors those companies that adeptly weave together technology, sustainability, and personalization, all while ensuring operational efficiency and adhering to regulatory standards in a market that's growing ever more intricate. Furthermore, the emphasis on sustainability and personalization reflects a broader shift in consumer preferences, with buyers increasingly seeking products that align with their values and individual needs.
North America Beauty and Personal Care Products Industry Leaders
-
L'Oréal S.A.
-
Unilever PLC
-
Procter & Gamble Company
-
Estée Lauder Companies Inc.
-
Colgate-Palmolive Company
- *Disclaimer: Major Players sorted in no particular order
North America Beauty and Personal Care Products Market Companies Covered in this Report
- L’Oréal S.A.
- Unilever PLC
- Procter & Gamble Company
- Estée Lauder Companies Inc.
- Johnson & Johnson Services Inc.
- Coty Inc.
- Mary Kay Inc.
- Colgate-Palmolive Company
- LVMH Moët Hennessy Louis Vuitton
- Natura & Co Holding S.A.
- Revlon Group Holdings LLC
- e.l.f. Beauty Inc.
- Shiseido Company Ltd.
- Beiersdorf AG
- Henkel AG & Co. KGaA
- Kao Corporation
- Church & Dwight Co. Inc.
- Edgewell Personal Care Company
- The Honest Company Inc.
- Glossier Inc.
- Burt’s Bees (The Clorox Company)
- Fenty Beauty LLC
- Anastasia Beverly Hills LLC
- Kylie Cosmetics LLC

Market Opportunities and Future Outlook
Compliance-driven differentiation is a near-term whitespace as MoCRA moves from onboarding to ongoing operating cadence, including biennial renewal cycles for facility registrations and product listings beginning in 2026 based on individualized dates. Brands and manufacturers that institutionalize safety substantiation, complaint handling, and recall readiness can shorten retailer onboarding and reduce channel friction, while third-party frameworks add another layer of trust signaling: NSF International published NSF/ANSI 527 in March 2026 as a voluntary finished-cosmetics standard that supports safety and quality evaluation for brands selling into scrutiny-heavy channels.
Channel mix and price architecture continue to open room for targeted innovation. Circana reported that in the United States, prestige beauty grew 6% to USD 8.1 billion in Q1 2026 and mass beauty grew 7% to USD 18.1 billion, reinforcing demand for both premiumized claims and high-velocity mass assortments. Social commerce is an additional lever for customer acquisition and replenishment; early-2026 data points to TikTok Shop taking a measurable share of US beauty e-commerce, encouraging brands to build content-led merchandising, live shopping capability, and tighter control of authorized distribution to limit counterfeit and gray-market leakage.
Recent Industry Developments in North America Beauty and Personal Care Products Market
- March 2026: L'Oréal announced a strategic realignment of its luxury fragrance licensing portfolio to streamline brand partnerships and accelerate omnichannel distribution across North America.
- February 2025: L'Oréal opened a USD 160 million North America Research and Innovation Center in Clark, New Jersey.
- October 2024: Estee Lauder launched its flagship brand into the Amazon Premium Beauty store in the United States.


North America Beauty and Personal Care Products Market Report Scope and Research Methodology
Market Definition and Coverage
For this report, the market covers revenues earned from finished beauty and personal care products sold to consumers across North America through retail and online channels, with values counted at the point of sale in the region.
Scope exclusions: Services such as salon treatments, spa procedures, and other professional service revenues are excluded from the market size.
Segments Covered in This Report
-
By Product Type
-
Personal Care
-
Hair Care
- Shampoo
- Conditioner
- Hair Colourant
- Hair Styling Products
- Others
-
Skin Care
- Facial Care Products
- Body Care Products
- Lip and Nail Care Products
-
Bath and Shower
- Shower Gels
- Soaps
- Others
-
Oral Care
- Toothbrush
- Toothpaste
- Mouthwashes and Rinses
- Others
- Men’s Grooming Products
- Deodorants and Antiperspirants
- Perfumes and Fragrances
-
Hair Care
-
Cosmetics / Make-up Products
- Facial Cosmetics
- Eye Cosmetics
- Lip and Nail Make-up Products
-
Personal Care
-
By Category
- Premium Products
- Mass Products
-
By Ingredients
- Natural/Organic
- Conventional/Synthetic
-
By Distribution Channel
- Specialist Stores
- Supermarkets/Hypermarkets
- Online Retail Stores
- Other Distribution Channels
-
By Geography
- United States
- Canada
- Mexico
- Rest of North America
Data Sources, Market Sizing, and Validation
Desk Research
Desk research starts with building a clean fact base on demand and retail activity, so our assumptions stay aligned with real consumer spending patterns in North America. We rely on public, non-paywalled sources such as US Census retail and trade data, Bureau of Labor Statistics price indices, Health Canada publications, the US FDA updates (including MoCRA-related items), and UN Comtrade where relevant for product flows.
After that, the numbers are checked against company filings, investor presentations, annual reports, reputable press coverage, and association statistics, which help us track category mix shifts and channel changes. In a few spots, paid subscriptions for company financials and news intelligence, patent databases, and an import-export shipment-level database are used to support cross-checks and fill in gaps where public series are not specific enough. This desk research list is not exhaustive, and many other sources were also used for data collection, validation, and clarification.
Primary Interviews and Surveys
Primary work is used to pressure-test the desk assumptions and to clarify what is being counted as in-scope revenue across product categories and channels. We speak with manufacturers, brand owners, distributors, large retailers, and sector specialists across the United States, Canada, and Mexico so the model reflects differences in pricing, promotions, and channel mix by country.
Distribution of primary research fieldwork respondents
| Company type | Respondent position |
|---|---|
| Top tier: 27% | CXOs: 14% |
| Mid tier: 59% | Functional/Unit leaders: 41% |
| Smaller Players: 14% | Managers: 45% |
Market-Sizing & Forecasting
Sizing is built using a top-down approach where consumer spending and retail sales signals are translated into category level demand for beauty and personal care products across North America, and then reconciled by country totals. Once the first total is formed, it is corroborated with selective bottom-up approximations, such as sampled brand and channel revenue roll-ups, plus price per unit times volume checks from available public indicators.
Key inputs used in the model include category mix across skin care, hair care, oral care, bath and shower, fragrances, deodorants, men's grooming, and color cosmetics, along with online share trends, inflation and price index movement, import dependence for select sub-categories, and country-level growth differences (with Mexico often showing faster expansion). When the data gets thin for smaller categories, we apply conservative proxy logic by anchoring to close substitutes and then validating the resulting shares through interviews.
For forecasting, scenario analysis is applied so that expected growth can flex with variables that matter in this market, including disposable income direction, pricing and promotion intensity, channel shifts to e-commerce, and regulatory-driven reformulation and labeling costs. The final time series is smoothed only after the assumptions are agreed with primary respondents, so the forecast stays explainable and repeatable.
Data Validation & Update Cycle
Validation happens in layers so errors do not travel unnoticed into the final market size. Model outputs are compared against independent signals such as retail sales direction, price movement, and the implied category splits that show up in public disclosures and channel commentary, and then outliers are investigated before sign-off.
A second analyst reviews the structure, units, and conversion logic, and follow-up outreach is triggered when interview feedback conflicts with the model by a material margin. Reports are refreshed annually, and interim updates are made when major events occur, such as sharp inflation swings, regulation changes, or large channel disruptions. Before delivery, a fresh pass is completed so clients receive the latest updated view.
Mordor Intelligence's North America Beauty and Personal Care Products Market Market Size Measured Against Other Published Estimates
Published market sizes for beauty and personal care in North America often look different because each publisher draws the line around products, channels, and geographies in its own way, and they may also use different base years and currency timing. Differences also come from how quickly assumptions are refreshed when pricing, promotions, and online mix shift.
The benchmark table shows a noticeable spread, and in Mordor Intelligence's model the total is built for North America as a whole and ties the value to finished product revenues across the United States, Canada, and Mexico, while keeping salon and spa service revenues out of scope.
Benchmark comparison
| Source | Market Size | Gaps in Research Methodology |
|---|---|---|
| Mordor Intelligence | USD 155.41 B (2026) | |
| Regional Consultancy A | USD 124.53 B (2023) | Uses an earlier base year and may blend professional and direct sales definitions differently, which can shift what gets counted as product revenue versus channel activity when compared across years. |
| Global Consultancy B | USD 109.56 B (2025) | Covers the United States only, which naturally excludes Canada and Mexico, and the higher growth path suggests a more aggressive price and premiumization assumption through the forecast period. |
What the comparison mainly tells us is that scope and timing drive the biggest differences, not just math. When the geography is aligned, and when product-only revenues are separated from services and channel proxies, the resulting market size becomes easier to trace back to clear demand indicators and to update in a repeatable way.


Key Questions Answered in the Report
How fast is demand growing for natural formulations within North American beauty?
Natural and organic products are expected to expand at a 6.23% CAGR between 2026 and 2031, outpacing the overall market as third-party certifications build trust.
Which sales channel is expanding quickest for beauty and personal care in North America?
Online retail, already holding 35.62% of revenue in 2025, is projected to grow at a 6.34% CAGR as consumers leverage fast delivery and virtual try-on tools.
What segment accounts for most spending in North American beauty?
Personal care commands 84.15% of 2025 revenue, buoyed by oral-care innovation, men’s grooming, and anti-pollution hair products.
Which country is forecast to grow the fastest in North America’s beauty market?
Mexico is projected to record a 5.57% CAGR through 2031, driven by a growing middle class and expanded local manufacturing capacity.
Page last updated on:





