Netherlands Organic Waste Collection Services Market Size and Share
Market Overview
| Study Period | 2020 - 2031 |
|---|---|
| Forecast Data Period | 2026 - 2031 |
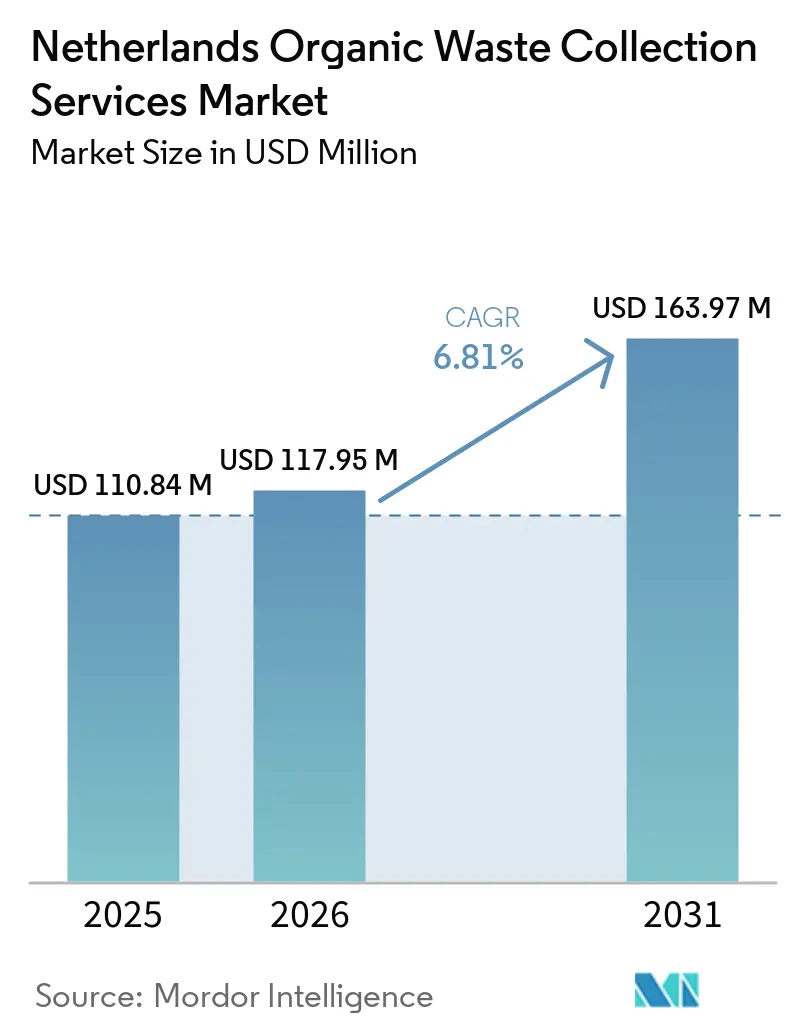
| Base Year Market Size (2025) | USD 110.84 Million |
| Market Size (2026) | USD 117.95 Million |
| Market Size (2031) | USD 163.97 Million |
| Growth Rate (2026 - 2031) | 6.81% CAGR |
| Market Concentration | Medium |
Major Players *Disclaimer: Major Players sorted in no particular order Image © Mordor Intelligence. Reuse requires attribution under CC BY 4.0. | |
Netherlands Organic Waste Collection Services Market Analysis by Mordor Intelligence
The Netherlands Organic Waste Collection Services Market size is projected to be USD 110.84 million in 2025, USD 117.95 million in 2026, and reach USD 163.97 million by 2031, growing at a CAGR of 6.81% from 2026 to 2031.
This growth profile rests on a firm policy base that bans landfilling of biodegradable waste and steers all organic streams toward composting and anaerobic digestion, with enforcement that keeps landfill rates among the lowest in Europe. Widespread adoption of differentiated tariffs, now in use across 59% of municipalities, improves source separation, reduces residual waste, and lowers average household waste management costs, which supports steady gains in the Netherlands organic waste collection services market even when commodity prices fluctuate. Door-to-door coverage that reaches most households coexists with urban systems of underground containers and smart-bin monitoring, which adapt to high-density areas and help stabilize quality. Commercial food waste segregation is accelerating under EU targets and local programs. At the same time, zero-emission freight zones catalyze fleet electrification, improving operating economics and reducing the risk profile for long-term contracts.
Key Report Takeaways
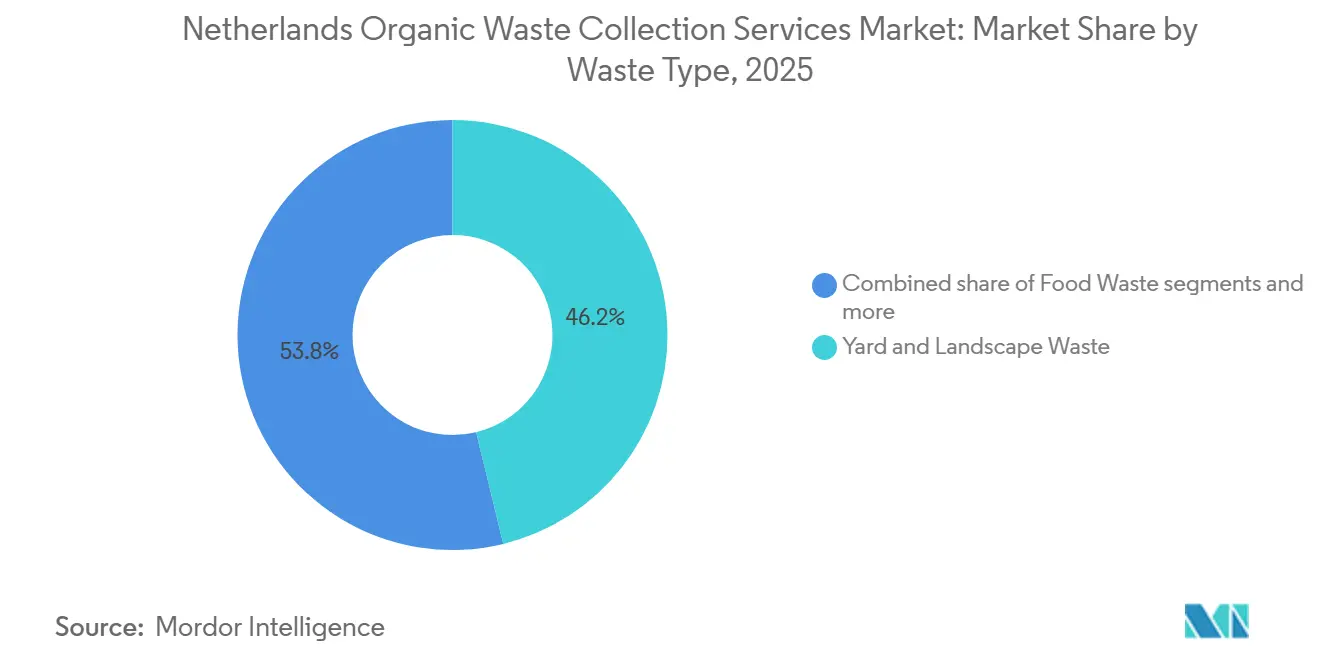
- By waste type, yard & landscape waste led with 46.2% of the Netherlands organic waste collection services market share in 2025, while food waste is projected to grow at a 7.62% CAGR to 2031.
- By end-user, residential held a 79.2% share in the Netherlands organic waste collection services market size in 2025, while commercial is projected to grow at an 8.26% CAGR to 2031.
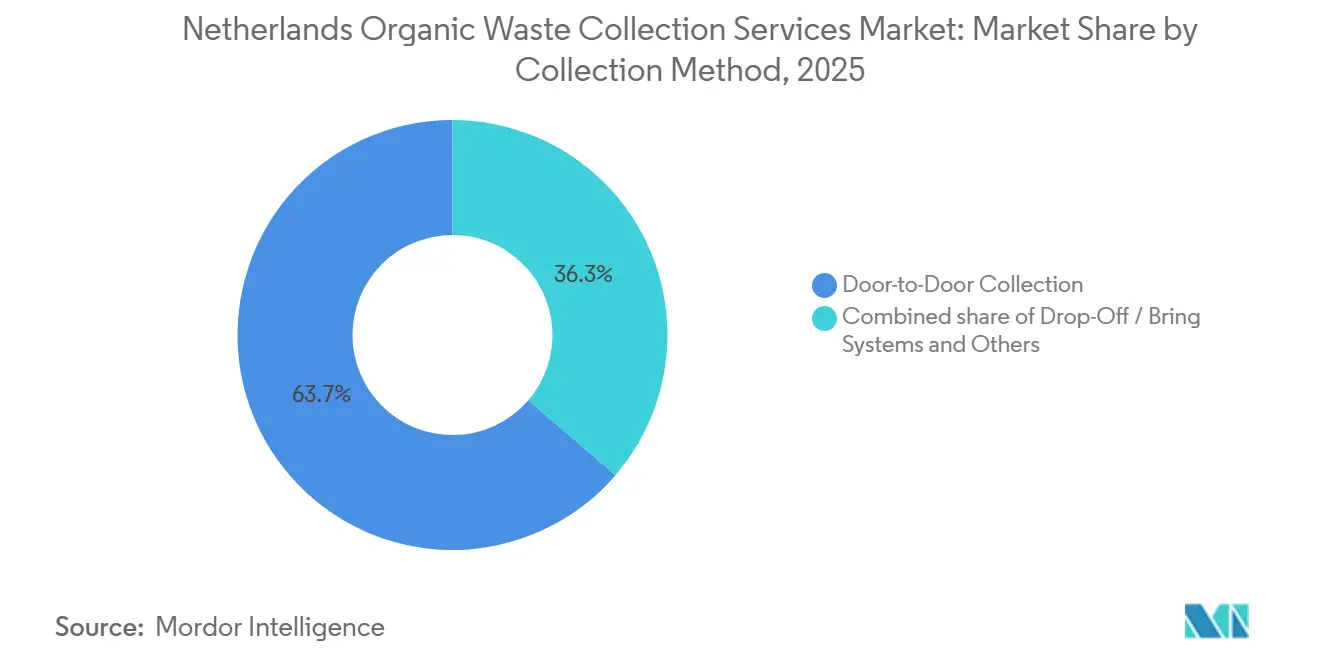
- By collection method, door-to-door accounted for 63.7% of the market share in 2025 and is projected to grow at a 7.92% CAGR through 2031.
- By technology and equipment, semi-automated systems captured 71.8% of the market in 2025, while fully automated systems are projected to grow at an 8.43% CAGR through 2031.
Note: Market size and forecast figures in this report are generated using Mordor Intelligence’s proprietary estimation framework, updated with the latest available data and insights as of January 2026.
Netherlands Organic Waste Collection Services Market Trends and Insights
Drivers Impact Analysis*
| Driver | (~) % Impact on CAGR Forecast | Geographic Relevance | Impact Timeline |
|---|---|---|---|
| Landfill Ban on Organic Waste Reinforcing Collection Volumes | +1.8% | National, with enforcement via NVWA and municipal compliance frameworks | Short term (≤ 2 years) |
| Strong Adoption of "Pay-As-You-Throw" Pricing Models | +1.5% | National, concentrated in 59% of municipalities, with the highest penetration in East Netherlands and medium-sized cities | Medium term (2-4 years) |
| Circular Economy Targets under the Dutch Government 2050 Agenda | +1.2% | National, cascading to provincial and municipal circular materials plans, particularly Utrecht, Noord-Brabant | Long term (≥ 4 years) |
| High Household Participation in GFT Collection | +0.9% | National, skewed toward non- or lightly urbanized areas, with 142.77 kg per capita vs 60.38 kg per capita in highly urbanized zones | Medium term (2-4 years) |
| Advanced Urban Waste Segregation Infrastructure | +0.7% | National core, with early gains in Amsterdam, Rotterdam, The Hague, Utrecht, expanding to secondary cities | Medium term (2-4 years) |
| Increasing Commercial Food Waste Segregation Regulations | +0.7% | National, with pilot intensity in Amsterdam and Rotterdam, and spillovers to the tourist region of HoReCa clusters | Long term (≥ 4 years) |
| Source: Mordor Intelligence | |||
Landfill Ban on Organic Waste Reinforcing Collection Volumes
The Netherlands has enforced a landfill prohibition on combustible and biodegradable waste for decades, which was broadened in 2018 to capture more bio-waste streams and keep landfill use among the lowest in Europe.[1]European Environment Agency, “Netherlands, Municipal Waste Factsheet 2025,” European Environment Agency, eea.europa.eu This legal framework removes landfilling as a low-cost option and channels organic material to composting or anaerobic digestion. At the same time, incineration faces rising taxes that reached USD 46.3 per tonne in 2024, with policy scenarios pointing to USD 82.3 per tonne by 2030. Enforcement has tightened further, with checks requiring transport documentation for compost loads above 3 tonnes, thereby strengthening traceability and helping prevent leakage or illegal dumping. The resulting policy certainty supports long-term investment and offtake contracts that anchor new processing capacity, including multi-year green gas agreements that convert collected feedstock into stable energy revenues. These links between collection rules and downstream markets help sustain predictable volumes, supporting the Netherlands organic waste collection services market through economic cycles.
Strong Adoption of "Pay-As-You-Throw" Pricing Models
Differentiated tariffs, known as DIFTAR, now apply in 59% of Dutch municipalities and change behavior by tying payment to frequency or weight rather than applying a flat fee. Weight-based variants are effective for organic streams because households pay more when heavy residual bins are set out, thereby raising the incentive to separate GFT and increasing captured kilograms per person by a measurable margin in non-DIFTAR areas. Municipalities report lower costs and lower residual waste under DIFTAR, and many achieve higher separation rates than flat-fee peers, thereby improving processing quality and reducing penalties for contaminated loads. Recent rollouts in municipalities such as Hellendoorn and operational results in Emmen show residual waste reductions after implementation, validating the model for councils facing budget pressure and rising gate fees. This mix of behavioral pricing and quality premiums from processors supports rising capture rates and a healthier margin pool in the Netherlands organic waste collection services market.
Circular Economy Targets under the Dutch Government 2050 Agenda
The national circular economy program aims for a 50% reduction in the use of primary abiotic materials by 2030 and full circularity by 2050, placing organic waste valorization within a wider decarbonization and materials strategy. Policy instruments within this program are projected to deliver material and emissions reductions by the end of the decade, and they push municipalities to design tenders that favor suppliers with proven records of recycling and greenhouse gas reduction. Local waste strategies are turning these national targets into operating rules that call for higher recycling performance and tailored GFT solutions in high-rise buildings. Funding and subsidy frameworks, including support for mono-digestion and green gas, improve the business case for dedicated organics plants and speed the shift from incineration to valorization.[2]Netherlands Enterprise Agency (RVO), “Grondstoffen en technieken voor groen gas,” RVO, rvo.nl This alignment between public goals and private investment strengthens the outlook for the Netherlands organic waste collection services market as more contracts reward quality feedstock and predictable delivery.
High Household Participation in GFT Collection
Widespread household access to door-to-door GFT service, reaching around 90% of homes nationally, removes logistical barriers to participation and normalizes weekly sorting behavior that sustains steady organic feedstock volumes. Participation intensity varies with urbanization: lightly urbanized municipalities capture 142.77 kg of GFT per person, while highly urbanized areas capture 60.38 kg per person, shaping service design and outreach priorities by locality. Municipal convenience interventions, such as distributing free kitchen caddies, have cut GFT leakage into residual bins by about half in pilots and improved feedstock cleanliness, which protects processor acceptance and downstream biogas yields. In dense neighborhoods with limited curb space, cities deploy underground GFT containers to preserve separation opportunities for apartment dwellers and stabilize quality even at higher dwelling densities. Targeted enforcement and feedback tools, including AI camera checks with staged warnings and rejections for heavily contaminated bins, raise sorting discipline while reducing costly processor rejections. In municipalities using DIFTAR, chip-enabled bins and variable fees create household-level accountability that lifts GFT capture and lowers residual volumes, reinforcing predictable supply and better economics for collection and processing contracts.
Restraints Impact Analysis*
| Restraint | (~) % Impact on CAGR Forecast | Geographic Relevance | Impact Timeline |
|---|---|---|---|
| High Operational Costs | -1.4% | National, acute pressure in zero-emission freight municipalities such as Amsterdam, Rotterdam, and Utrecht | Short term (≤ 2 years) |
| Contamination Issues in GFT Waste Streams | -1.1% | National, with higher severity in large cities and in post-separation systems | Medium term (2-4 years) |
| High Capital Investment Requirements for Advanced Collection Infrastructure | -0.9% | National core, with a higher burden in 29 zero-emission freight expansion municipalities and IoT pilot regions | Medium term (2-4 years) |
| Seasonal Variability in Organic Waste Volumes | -0.5% | National, stronger in garden-waste heavy rural areas, less in food-waste dominated urban zones | Short term (≤ 2 years) |
| Source: Mordor Intelligence | |||
High Operational Costs
Operating margins have tightened since 2024 due to broad inflation, a temporary reduction in incineration capacity, and rising taxes on residual processing, which together increased costs per tonne and squeezed earnings in large Dutch commercial waste divisions. The national CO₂ levy on incinerators has also increased, which pushes higher gate fees back into collection contracts. Zero-emission zones require fleet upgrades that entail higher upfront capital costs, even with subsidies, and grid upgrades for depot charging add further fixed costs and timing risks to city operations. Operators with electric trucks have flagged grid capacity limits as a barrier to faster rollout, which slows scale benefits and keeps maintenance and charging plans in pilot mode in some depots. Municipal budgets face pushback when fees rise, which limits the room to pass through all cost increases. This cap on tariff adjustments can defer upgrades that would otherwise improve quality and reduce contamination. These pressures weigh on near-term growth and temper gains for the Netherlands organic waste collection services market in districts with tighter budgets.
Contamination Issues in GFT Waste Streams
Processing plants penalize or reject loads that do not meet purity standards, and municipal audits have shown large differences in contamination by district, which tracks with factors such as high-rise density and use of non-compostable bags. The most common contaminant is plastic film from kitchen waste bags, which increases sorting costs, lowers biogas yields, and increases the amount of residue for incineration, thereby raising costs and increasing the risk of processor rejection. Some municipalities report a link between aggressive residual service reductions and rising contamination in GFT, as households try to avoid variable fees, which underscores the need to pair DIFTAR with clear communication and enforcement. New enforcement and education tools, including AI camera checks with warning systems before rejections, have begun to reduce problem loads while encouraging proper sorting. However, they require investment and strong public communication to maintain support. Until contamination falls further, operators face more screenings and higher front-end costs, which slow efficiency improvements in the Netherlands organic waste collection services market.
*Our forecasts treat driver/restraint impacts as directional, not additive. The impact forecasts reflect baseline growth, mix effects, and variable interactions.
Segment Analysis
By Waste Type: Garden-Heavy Streams Face Competition from Food Valorization
Yard and landscape waste accounted for 46.2% of the Netherlands organic waste collection services market share in 2025, reflecting the influence of single-family homes and garden ownership patterns that boost GFT volumes in less-dense areas. Rural and lightly urbanized municipalities generate more kilograms per person than large cities, supporting more stable yard waste flows to compost sites over the growing season. Composting and fermentation volumes rose in 2023, and that gain lined up with wetter conditions that drove garden trimmings, which underscores the seasonality built into this stream. Agricultural residues play a smaller supporting role, but they provide useful feedstock for biogas production when blended with manure under green gas subsidy schemes. This mix of yard and agricultural inputs keeps volumes steady in many service areas and continues to anchor a significant portion of the Netherlands organic waste collection services market.
Food waste from households and commercial sites is the fastest-growing category with a projected 7.62% CAGR in 2026-2031, driven by binding European Union targets and local pilots that improve sorting practices and reduce edible waste.[3]European Commission, “Revised Waste Framework Directive enters into force,” European Commission, europa.eu Processors report larger gains in biogas output when feedstock has a higher food content, and recent production increases point to the margin potential of cleaner, more energy-dense inputs. City pilots have shown strong reductions in commercial food waste within a short window, and those results define the commercial opportunity for dedicated collection services and value-sharing agreements. Subsidized green gas investments further improve the economics of dedicated food waste capture and processing, thereby attracting more private capital and strengthening the Netherlands organic waste collection services market. These dynamics support a pivot within the Netherlands organic waste collection industry as operators look to balance high-volume yard waste with higher-value food waste streams.


By End-User: Residential Dominance Challenged by Tightening Commercial Mandates
The residential segment accounted for 79.2% of total value in 2025, supported by broad door-to-door coverage reaching most households and a steady expansion of DIFTAR systems that raise separation rates. DIFTAR municipalities record higher kilograms of GFT collected per person and higher separation rates than flat-fee peers, which support processor quality and reduce penalty risks from contaminated loads. Local programs that distribute kitchen caddies and adjust services in high-rise areas have reduced contamination and increased participation, helping municipalities meet their circular targets and maintain acceptance at compost and biogas facilities. These practices stabilize household capture and support long-term contracts in the Netherlands organic waste collection services market.
Commercial food service is projected to grow at the fastest pace with an 8.26% CAGR between 2026 and 2031, as binding targets move large hospitality and retail sites to sign structured service and reporting agreements. Pilots in major cities have shown measurable reductions in food waste within a month, suggesting that well-designed programs can scale across chains and venues, delivering direct cost savings. Large operators are winning multi-year contracts with airports and food manufacturers that include organics capture and valorization, which embeds biogas output into long-term customer relationships. Biogas plants with support mechanisms attract consistent commercial inputs, helping optimize plant loads and favoring operators who can guarantee quality and continuity. These drivers raise the commercial share of volumes and value in the Netherlands organic waste collection services market and set new standards that carry across the Netherlands organic waste collection industry.
By Collection Method: Digital Route Optimization Narrows Door-to-Door’s Advantage
Door-to-door collection accounted for 63.7% of the value in 2025 and is also projected to grow the fastest at a 7.92% CAGR through 2031, as digital tools extend the method’s efficiency into denser zones. High coverage of household service makes door-to-door the default operating model in most municipalities, and AI route optimization reduces fuel and labor use by cutting daily kilometers and the number of trucks in service. Real-time bin fill data supports dynamic routes that reduce driving movements, keeping service reliable while improving the total cost of ownership for private and municipal operators. These tools preserve the incumbency of door-to-door service and support the sharing of gains within the Netherlands organic waste collection services market as urban pilots mature.
Drop-off or bring systems remain important for specific high-density settings, but they face headwinds from contamination and illegal dumping, which require faster responses and greater monitoring. Municipal pilots are converting underground container capacity to GFT in inner-city neighborhoods, aiming to blend the convenience of door-to-door delivery with the spatial constraints of mixed-use streets. Expanding container fleets require constant digital oversight to avoid overflows and misuse, which adds cost but also enables route automation and quicker responses to dumping alerts. Capital requirements for underground systems remain higher than for curbside bins, which slows full-scale rollouts and keeps door-to-door ahead in the Netherlands organic waste collection services market.
By Technology & Equipment: Automation Premium Driven by Zero-Emission Compliance
Semi-automated systems captured 71.8% of the 2025 value, as side- and rear-loader platforms balance labor and capital while integrating electric powertrains within proven workflows. Municipal fleets that began electrification years ago are scaling up with new models that meet daily range and duty-cycle requirements, which align with the stop-start profile of waste collection. Zero-emission freight zones across major cities and expanding to more municipalities through 2030 amplify the shift to electric platforms as operators bid for contracts that factor in emissions in award decisions. Operators that deployed dozens of electric trucks in 2024 highlight the operational fit and quieter service, while also pointing to grid constraints that limit the speed of rollout across depots. These conditions sustain the lead for semi-automated platforms while supporting steady value growth in the Netherlands organic waste collection services market.
Fully automated systems are projected to grow the fastest at 8.43% CAGR during 2026-2031, driven by battery-electric chassis that integrate automated lifting, bin recognition, and e-PTO systems to reduce manual work and improve energy efficiency. Municipalities are commissioning new electric side-loaders with charging infrastructure that supports overnight operations, which allows scaling without proportional grid reinforcement. The duty cycle is a good match for electric trucks that benefit from regenerative braking and more efficient stop-start operation, which reduces maintenance and expands early-morning service windows. Uptake rates for electric vans and trucks are higher in zero-emission zones than in non-zones, which signals a procurement standard that favors fully automated electric platforms over the planning horizon. Manual systems are phasing out as labor costs rise and diesel access tightens, which concentrates new investment in automated equipment across the Netherlands organic waste collection industry.
Geography Analysis
Regional patterns in separate collection reflect differences in urban density, service infrastructure, and local policy choices, which show up in adjacent waste indicators and per-capita capture for organic streams. The G4 cities have the highest value concentration but collect far fewer kilograms of GFT per person than rural municipalities, which is explained by high-rise housing and fewer gardens that reduce yard waste. These cities are pushing new solutions such as underground GFT units and targeted commercial pilots, which aim to shift quality and volumes in dense districts through a mix of convenience and accountability. Route optimization collaborations and regional consortia also reduce truck miles and emissions, which improves service economics and strengthens bids in tenders that rate environmental impact. These local shifts set the stage for continued growth in the Netherlands organic waste collection services market within the Randstad and other large urban zones.
Eastern provinces such as Gelderland and Overijssel show deeper DIFTAR penetration and higher source separation, which aligns with stronger organics capture and supports investments in dedicated composting and digestion capacity. Route optimization programs in the region have achieved daily truck reductions, keeping costs in check and freeing capacity for service extensions. Northern and southern provinces show different levels of investment in adjacent streams and container infrastructure, indicating local priorities that inform GFT design decisions. These differences shape near-term tender opportunities and keep the Netherlands organic waste collection services market diverse by operating model.
Zero-emission zones that began in 2025 and extend to more municipalities by 2030 set clear boundaries for fleet planning and capital deployment, and they create corridors where electric adoption spreads into neighboring areas. Uptake rates for electric vans and trucks are higher in these zones than in non-zones, signaling a geographic pace-setter for equipment and charging investments that improve operating efficiency over time. Recycling and sorting facilities near Eindhoven and other industrial centers also tie into circular supply chains that support bin and container manufacturing, thereby shortening logistics and feeding back into local tenders. Island and coastal municipalities with seasonal tourism see higher per-capita waste. Still, outcomes vary with infrastructure decisions that either add separate GFT collection or channel volumes into mixed waste systems, which leads to wide performance dispersion. These patterns will continue to shape the Netherlands organic waste collection services market as zero-emission rules spread and local investments follow.
Competitive Landscape
The Netherlands organic waste collection services market is moderately consolidated in nature, bringing together integrated national processors, regional municipal service organizations, and technology providers that optimize routes and containers, creating a balanced field with multiple profit pools. Large operators process millions of tonnes across the Benelux and have shifted their strategy toward green gas production through multi-year offtake contracts, which reduce earnings volatility and anchor new capex programs. Earnings at scale players have faced pressure from inflation and processing constraints, but pricing and cost actions have stabilized results as new plants and contracts come online. These moves keep the Netherlands organic waste collection services market competitive while building more resilient revenue streams tied to energy output rather than only gate fees.
Regional public companies and private operators compete with zero-emission credentials and depot charging networks, which now play a central role in municipal tenders that score environmental performance. Fleet deployments of electric trucks have demonstrated that duty cycles fall within current ranges. At the same time, grid capacity remains the key bottleneck to faster scale, creating a temporary advantage for incumbents with earlier charging investments. Route and contract consolidation across adjacent municipalities reduces kilometers and emissions, improving cost positions and supporting contract renewals in areas with strict circular targets. These strategies continue to shape awards and defend share positions in the Netherlands organic waste collection services market as electrification spreads.
Technology providers supply smart-bin sensors, AI routing tools, and analytics platforms that improve labor and fuel efficiency by sizable margins, compressing the advantage of pure scale and shifting value toward software and data integration. This software layer is now a core feature of bids and renewals and helps maintain service quality in dense neighborhoods where misuse of drop-offs and the risk of illegal dumping remain higher. As these tools roll out across more districts, they raise baseline expectations for punctuality, cleanliness, and emissions, further professionalizing the organic waste collection market in the Netherlands.
Netherlands Organic Waste Collection Services Industry Leaders
Renewi
PreZero Stiftung & Co. KG
GP Groot
Rova
Veolia Environnement
- *Disclaimer: Major Players sorted in no particular order

Recent Industry Developments
- March 2026: Renewi completed the acquisition by Earth Bidco B.V. during Q2 2025, providing additional capital to support innovation-led growth across European markets where the company operates, including the expansion of biogas and bio-LNG processing capacity in the Netherlands to strengthen its organics business operations.
- February 2026: The Dutch government's Circulair Materialenplan, effective December 30, 2025, as the successor to LAP3, introduced updated circular materials planning frameworks, with a revision scheduled for April 1, 2026, to accelerate organic waste diversion from incineration by tightening processing standards.
- December 2025: Gemeente Dronten received its first electric waste collection truck on December 19, 2025, marking the initial deployment of a planned six-vehicle electric fleet comprising four side-loaders for mini-containers and two units for underground containers, contributing to CO₂ emissions reduction in household waste operations.


Netherlands Organic Waste Collection Services Market Report Scope
The Netherlands Organic Waste Collection Services Market Report is Segmented by Waste Type (Food Waste, Yard & Landscape Waste, and more), by End-User (Residential, Commercial, and more), by Collection Method (Door-to-Door, Drop-Off / Bring Systems, and Others), by Technology & Equipment (Manual, Semi-Automated, and more), and by Geography. Market Forecasts are Provided in Terms of Value (USD) and Volume (Tons).
| Food Waste (Pre and Post Consumer) |
| Yard & Landscape Waste |
| Agricultural Residues |
| Others |
| Residential |
| Commercial (HoReCa, Retail) |
| Industrial (Food Processing & Manufacturing) |
| Others (Agri-waste) |
| Door-to-Door Collection |
| Drop-Off / Bring Systems |
| Others |
| Manual Collection Systems |
| Semi-Automated Systems |
| Fully Automated Systems |
| Others |
| By Waste Type | Food Waste (Pre and Post Consumer) |
| Yard & Landscape Waste | |
| Agricultural Residues | |
| Others | |
| By End-User | Residential |
| Commercial (HoReCa, Retail) | |
| Industrial (Food Processing & Manufacturing) | |
| Others (Agri-waste) | |
| By Collection Method | Door-to-Door Collection |
| Drop-Off / Bring Systems | |
| Others | |
| By Technology & Equipment | Manual Collection Systems |
| Semi-Automated Systems | |
| Fully Automated Systems | |
| Others |


Key Questions Answered in the Report
What is the projected size of the Netherlands organic waste collection services market by 2031?
The Netherlands organic waste collection services market is projected to reach USD 163.97 million by 2031, based on a 6.81% CAGR for 2026-2031.
Which waste type leads and which grows fastest in the Netherlands organic waste collection services market?
Yard and landscape waste leads by share, while food waste grows fastest due to European Union targets and higher energy yields in anaerobic digestion.
How do DIFTAR tariffs influence the Netherlands organic waste collection services market?
DIFTAR links fees to usage, increasing GFT separation, lowering residual waste, and improving feedstock quality, thereby supporting stable processor acceptance.
What role do zero-emission freight zones play in this market?
Zero-emission zones accelerate the electrification of collection fleets, improving operating economics over time and influencing tender awards that score on emissions.
Which end-user segment is growing fastest in the Netherlands organic waste collection services market?
Commercial food service is the fastest-growing end-user due to binding EU reduction targets and structured service agreements with large venues and chains.
How are cities addressing contamination in GFT streams?
Municipalities use AI camera checks, targeted warnings, kitchen caddie programs, and underground GFT containers in dense areas to improve sorting quality and reduce rejections.
Page last updated on:


