Europe Waste Recycling Services Market Size and Share
Market Overview
| Study Period | 2020 - 2031 |
|---|---|
| Forecast Data Period | 2026 - 2031 |
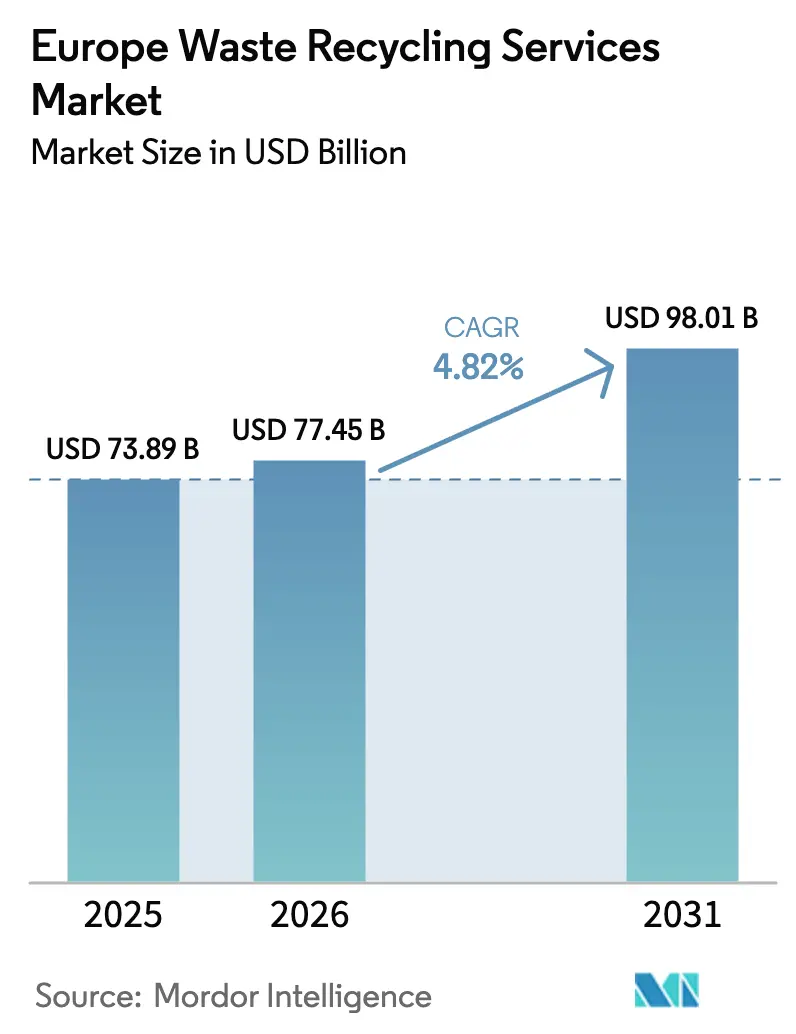
| Base Year Market Size (2025) | USD 73.89 Billion |
| Market Size (2026) | USD 77.45 Billion |
| Market Size (2031) | USD 98.01 Billion |
| Growth Rate (2026 - 2031) | 4.82% CAGR |
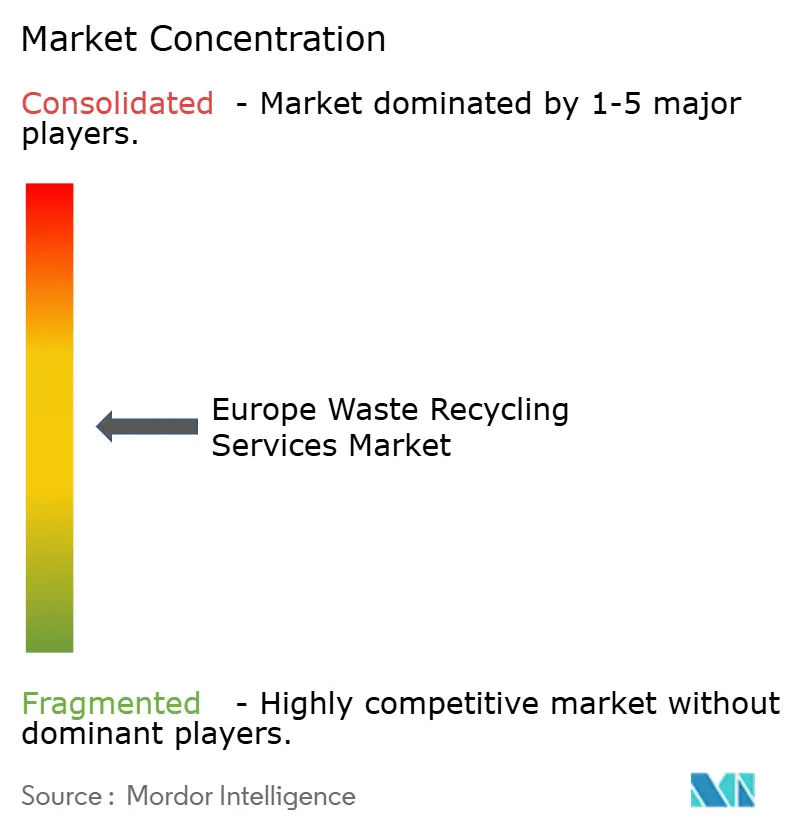
| Market Concentration | Medium |
Major Players *Disclaimer: Major Players sorted in no particular order Image © Mordor Intelligence. Reuse requires attribution under CC BY 4.0. | |
Europe Waste Recycling Services Market Analysis by Mordor Intelligence
The Europe Waste Recycling Services Market size was valued at USD 73.89 billion in 2025 and estimated to grow from USD 77.45 billion in 2026 to reach USD 98.01 billion by 2031, at a CAGR of 4.82% during the forecast period (2026-2031). Regulatory momentum from the EU Circular Economy Action Plan, rapid expansion of lithium-ion battery gigafactories, and accelerating Extended Producer Responsibility (EPR) schemes are converting what was once a compliance cost center into a strategic resource-recovery platform. Operators able to deliver specification-grade secondary materials, deploy AI-enabled sorting, and integrate chemical recycling are capturing rising demand from packaging, automotive, and electronics supply chains. Meanwhile, divergent national strategies from Germany’s digitally driven National Circular Economy Strategy to the Nordic region’s cross-border waste-to-energy model are creating localized opportunity pockets across the Europe waste recycling services market.[1]European Commission, “Circular Economy Action Plan,” ec.europa.eu
Key Report Takeaways
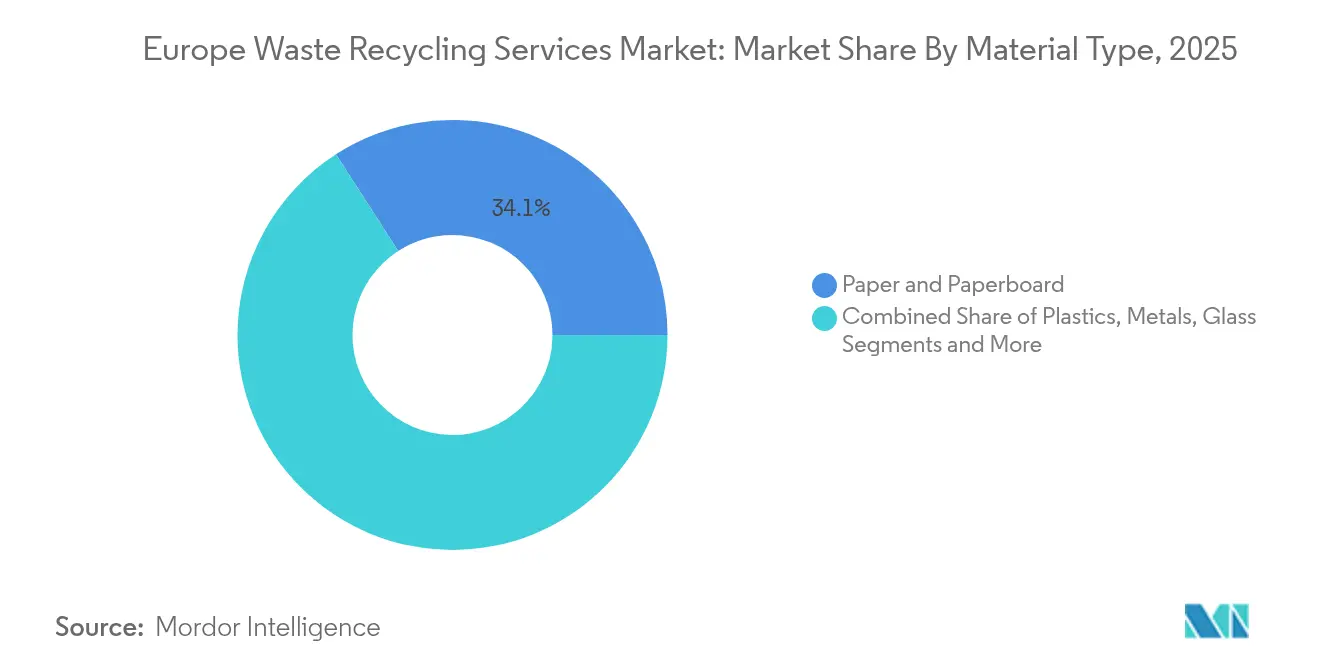
- By material type, paper and paperboard led with 34.12% of the Europe waste recycling services market share in 2025, while batteries are forecast to post the fastest 9.70% CAGR through 2031.
- By source, industrial streams held 38.55% of the Europe waste recycling services market size in 2025; residential collection is set to grow at a 6.76% CAGR to 2031.
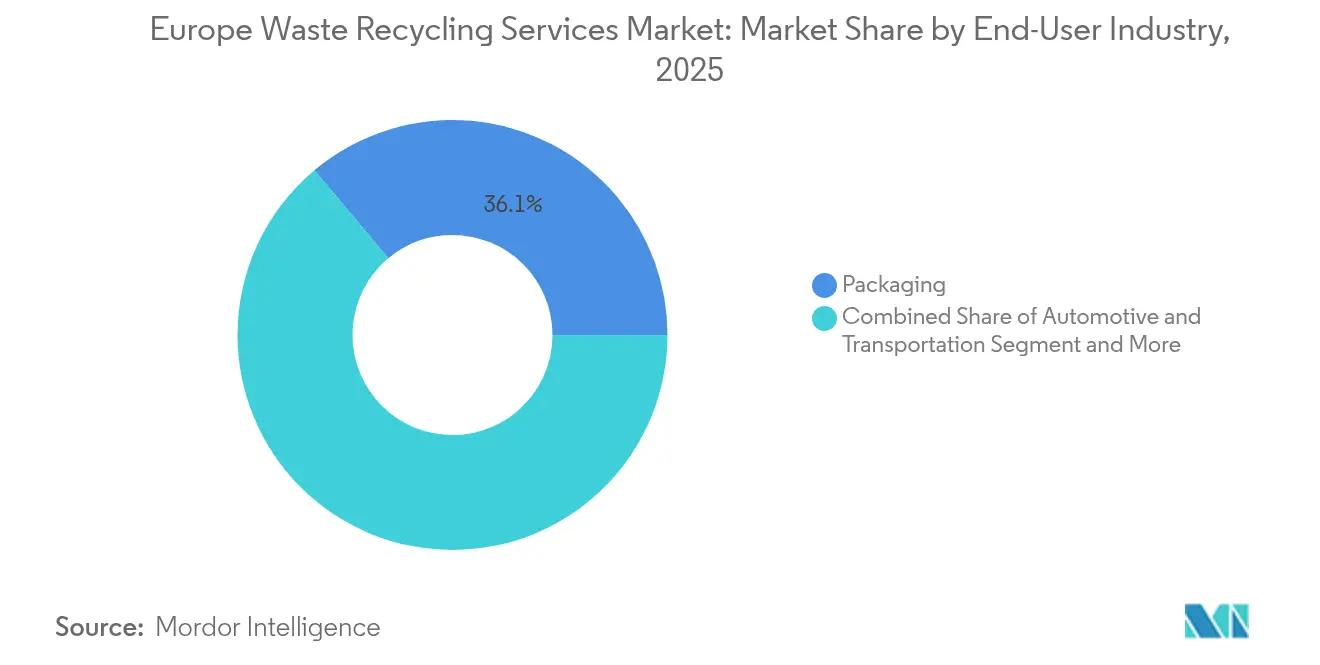
- By end-user industry, packaging applications commanded 36.10% revenue share in 2025; electrical and electronics recycling is advancing at a 7.54% CAGR to 2031.
- By recycling process, mechanical methods accounted for 68.40% share of the Europe waste recycling services market size in 2025; chemical and advanced recycling will expand at a 8.88% CAGR between 2026-2031.
- By geography, Germany held 22.31% of the regional revenue in 2025, while the Nordic region is projected to grow fastest at a 7.22% CAGR over the same period.
Note: Market size and forecast figures in this report are generated using Mordor Intelligence’s proprietary estimation framework, updated with the latest available data and insights as of 2026.
Worldwide, activity is shaped by contributions from multiple regions, with Europe representing one of the more structurally developed among them. The global report on waste recycling services market by Mordor Intelligence reflects how these regional layers combine into a single system.
Europe Waste Recycling Services Market Trends and Insights
Drivers Impact Analysis*
| Driver | % Impact on CAGR Forecast | Geographic Relevance | Impact Timeline |
|---|---|---|---|
| EU Circular Economy Action Plan 2.0 Mandating 65% Recycling Rate by 2035 | +1.8% | Global | Long term (≥ 4 years) |
| Country-specific EPR Schemes Accelerating Plastics & E-waste Recycling | +1.2% | Germany, France, Netherlands core, spill-over to Eastern Europe | Medium term (2-4 years) |
| Surge in Li-ion Battery Gigafactories Driving Battery Recycling in Germany & France | +0.7% | Germany & France, expanding to NORDICS | Short term (≤ 2 years) |
| Source: Mordor Intelligence | |||
EU Circular Economy Action Plan 2.0 Mandating 65% Recycling Rate by 2035
The revised Action Plan lifts municipal recycling obligations to 65% by 2035, raising investment needs to nearly EUR 42 billion annually for collection, sorting, and processing infrastructure. Beyond volume targets, the regulation introduces digital product passports and “high-quality recycling” metrics, rewarding operators that supply contamination-free secondary raw materials. German mechanically recycled plastic packaging rates already climbed from 42.1% in 2018 to 68.9% in 2023, demonstrating how policy pressure sparks operational upgrades. Performance-based targets are therefore recalibrating competitive dynamics across the Europe waste recycling services market toward technology-rich players.
Country-specific EPR Schemes Accelerating Plastics & E-waste Recycling
France’s 25 parallel EPR schemes show how stream-specific obligations cultivate specialized collection and processing networks. Harmonization across member states creates scale economies for multinational recyclers and standardizes service levels, while fiscal instruments such as Italy’s EUR 0.45/kg virgin-plastic tax further strengthen recycled-content economics. Compressed implementation timelines 18 months for EU textile EPR instead of the earlier 30 months are accelerating capacity additions across the Europe waste recycling services market.
Surge in Li-ion Battery Gigafactories Driving Battery Recycling in Germany & France
High-density clusters of battery plants in Germany and France now require closed-loop recycling to secure lithium, nickel, cobalt, and manganese supply. BASF’s Schwarzheide black-mass facility, operational since 2024, exemplifies chemical players vertically integrating into recycling[2]BASF SE, “Battery Recycling Facility Starts Up in Schwarzheide,” basf.com. Hydrometallurgical technologies achieving 95% metal recovery are becoming the industry baseline as the EU Critical Raw Materials Act targets 25% sourcing from recycled streams by 2030 [3]Eurostat, “Secondary Raw Material Price Statistics,” ec.europa.eu. This localized raw-materials pull is reshaping capital allocation across the Europe waste recycling services market.
Restraints Impact Analysis*
| Restraint | % Impact on CAGR Forecast | Geographic Relevance | Impact Timeline |
|---|---|---|---|
| Volatile Secondary Raw-Material Prices Squeezing Recycler Margins | -1.1% | Global | Short term (≤ 2 years) |
| Fragmented Municipal Tender Structures Limiting Economies of Scale | -0.9% | Southern and Eastern Europe primarily | Medium term (2-4 years) |
| Source: Mordor Intelligence | |||
Volatile Secondary Raw-Material Prices Squeezing Recycler Margins
Recyclers operate with fixed processing costs yet sell into commodity markets prone to price swings. Plastic recyclate averaged EUR 454/tonne in 2022 versus EUR 206/tonne for paper, but volatility in virgin polymer pricing still cut margins. Export restrictions on steel scrap and shifting trade flows since China’s import ban exacerbate revenue unpredictability. The result is cautious capital spending even as policy and brand-owner demand escalate.
Fragmented Municipal Tender Structures Limiting Economies of Scale
Short tender cycles of 3-5 years and politically driven award criteria impede investment in high-capex automated sorting and chemical recycling, especially in smaller municipalities. Non-standardized performance metrics make benchmarking difficult, while local employment clauses hinder regional consolidation. Consequently, operators in Southern and Eastern Europe face higher unit costs, holding back broader efficiency gains across the Europe waste recycling services market.
*Our forecasts treat driver/restraint impacts as directional, not additive. The impact forecasts reflect baseline growth, mix effects, and variable interactions.
Segment Analysis
By Material Type: Batteries Outpace a Dominant Paper Segment
Paper and paperboard held the largest share in 2025, driven by mature curbside systems and packaging demand for recycled fiber. In contrast, batteries are projected to expand at a 9.70% CAGR as electric-vehicle growth and critical-materials policy converge. The Europe waste recycling services market size for batteries is forecast to climb sharply alongside hydrometallurgical plant commissioning. Glass and metals maintain steady momentum through deposit schemes and scrap value, while plastics await scaling of chemical recycling such as LyondellBasell’s EUR 40 million EU-funded unit.
Metals recovery benefits from high intrinsic value, yet growth moderates given market maturity. Electronics recycling is accelerating under WEEE compliance and AI-enabled precious-metal extraction. Construction and demolition waste remains a volume opportunity, with EU targets of 70% recovery and Dutch rates already at 99% . Across these streams, operators able to shift from commodity to specification-grade outputs are capturing margin upside within the Europe waste recycling services market.


By Source: Residential Growth Surges Amid Industrial Scale
Industrial sources accounted for 38.55% of 2025 volumes thanks to predictable, homogeneous feedstock from manufacturing. Residential waste, however, is set for 6.76% CAGR as mandatory organic and textile separation spreads across major markets. Workplace separation rules arriving in the United Kingdom in March 2025 further formalize household-like sorting behaviors within commercial premises.
Commercial volumes from retail and hospitality remain significant but logistically complex. Healthcare waste creates niche demand for hazardous-handling specialists, and agricultural organics represent an underdeveloped bioenergy pool. Operators broadening collection footprints while standardizing digital tracking stand to gain share across the Europe waste recycling services market.
By End-User Industry: Electronics Fastest Despite Packaging Scale
Packaging commanded 36.10% of 2025 demand, powered by recycled-content mandates such as the 30% target for PET food containers by 2030 europarl.europa.eu. Electrical and electronics applications will widen at a 7.54% CAGR as precious-metal recovery aligns with corporate critical-materials strategies, helped by robotic battery-sorting solutions deployed with Stena Recycling.
Automotive recycling benefits from take-back schemes and high-value metal flows, while construction gains from recycled aggregates embedded in green-building codes. Food and beverage industries stimulate biowaste processing, and e-commerce drives film and corrugated recovery. Diversified service portfolios, therefore, remain key to revenue stability in the Europe waste recycling services market.
By Recycling Process: Chemical Technologies Gain Momentum
Mechanical processes dominated with 68.40% share in 2025 owing to established infrastructure and lower capex. Yet chemical and other advanced routes are poised for a 8.88% CAGR as they unlock mixed-plastic streams and food-grade PET from post-consumer waste.
Biological pathways like anaerobic digestion enjoy dual revenue from compost and biogas. Thermal processes serve contaminated fractions, while portable robotic Material Recovery Facilities under projects such as RECLAIM extend service reach to remote regions. The technology mix is thus widening across the Europe waste recycling services market as policy, feedstock complexity, and investor appetite align.
Geography Analysis
Germany continues to lead as the largest waste recycling market in Europe. Germany retained 22.31% of regional revenue in 2025 through a policy suite emphasizing digital tracking, raw-material security, and optimized municipal systems. National revenue from recycling totaled EUR 105 billion in 2021, and mandatory textile separation begins in January 2025. Mechanical plastic-packaging recycling already exceeds 68%, keeping Germany at the forefront of the European waste recycling services market.
Nordic countries post the highest 7.22% CAGR outlook owing to integrated waste-to-energy grids, automated sorting, and strong public buy-in. Renewcell’s 2024 insolvency, however, illustrates commercialization risks for breakthrough technologies despite favorable policy environments.
France couples 25 EPR schemes with a 2040 plastic-packaging ban, while “composte obligatoire” rules from January 2024 are reshaping food-waste streams. The United Kingdom’s post-Brexit trajectory introduces wide-ranging reforms, from workplace separation mandates to potential carbon-capture requirements at energy-from-waste plants that could sequester up to 20 MtCO₂ annually. BENELUX ports enable large-scale import and processing, highlighted by Freepoint Eco-Systems’ 80,000 tpy Ghent chemical-recycling project.
Mordor Intelligence provides coverage of the waste recycling services market across other key regional markets, including North America, each with their regulatory frameworks and demand patterns.
Competitive Landscape
Competition remains fragmented, with technology, regulatory agility, and integrated portfolios outweighing sheer scale. Veolia and SUEZ leverage water-energy-waste convergence to cross-sell solutions, while mid-tier specialists target high-value niches such as battery or textile recycling. Veolia’s GreenUp strategy allocates EUR 4 billion through 2027 to expand hazardous waste and bioenergy platforms veolia.com.
Technology partnerships differentiate players: Stena Recycling and the Danish Technological Institute co-developed AI-robot sorting for hazardous batteries, improving safety and recovery rates dti.dk. Chemical innovators like Itelyum and Freepoint Eco-Systems secure long-term feedstock via producer alliances, bypassing traditional municipal gatekeepers.
White-space opportunities lie in construction-waste recovery, decentralized organics processing, and blockchain-verified traceability. Corporations increasingly demand audited circular-economy outcomes to meet ESG disclosures, reinforcing the Europe waste recycling services market’s shift from commoditized waste handling toward high-value resource management.
Europe Waste Recycling Services Industry Leaders
Veolia
SUEZ
Biffa plc
REMONDIS SE & Co. KG
FCC Environment
- *Disclaimer: Major Players sorted in no particular order

Recent Industry Developments
- February 2025: Freepoint Eco-Systems signed a concession with North Sea Port to build an 80,000 tpy advanced plastics recycling facility in Ghent, Belgium, expandable to 160,000 tpy.
- February 2025: Veolia reported 2024 revenue of EUR 44.7 billion, up 5.0%, with waste services rising 6.4%; synergy targets under GreenUp lifted to EUR 530 million by 2025.
- January 2025: ANDRITZ partnered with Nouvelles Fibres Textiles to launch France’s first automated textile-sorting line processing 1,000 t annually.
- November 2024: European Metal Recycling received £3.4 million from the UK Advanced Propulsion Centre for the ReCircAl aluminum-recycling project.
- July 2024: Italy introduced a EUR 0.45/kg tax on virgin-plastic content to accelerate recycled-content adoption.
- March 2024: BASF’s Schwarzheide battery-recycling line began commercial operation for lithium, nickel, cobalt, and manganese recovery.
- February 2024: Itelyum bought a stake in Plasta Rei to build a 100% recycled PET chemical-recycling plant in Italy.


Research Methodology Framework and Report Scope
Market Definitions and Key Coverage
Mordor Intelligence defines the Europe waste-recycling services market as the annual revenue earned when firms collect, sort, clean, and re-process municipal, commercial, and industrial discards into secondary raw materials that re-enter manufacturing supply chains. Activities that only burn, landfill, or store waste sit outside this boundary.
Scope Exclusion: Energy-from-waste, landfilling, and un-treated hazardous disposal are not sized here.
Segmentation Overview
- Paper & Paperboard
- Plastics
- Metals
- Glass
- Electronics (E-waste)
- Batteries
- Organics & Compostables
- Construction & Demolition Debris
- Textiles
- Other Materials (rubber, etc.)
- By Source
- Residential
- Commercial (Retail, Offices, etc.)
- Industrial (Hazardous & Non-hazardous)
- Other Sources (Institutional, Heatlhcare, Agricultural, etc.)
- By End-User Industry
- Packaging
- Automotive & Transportation
- Electrical & Electronics
- Food & Beverage
- Construction
- Retail (E-commerce, Fashion)
- Others (Agriculture, Energy, etc.)
- By Recycling Process
- Mechanical Recycling
- Chemical / Advanced Recycling
- Biological (Composting/Anaerobic Digestion)
- Thermal (Pyrolysis, Gasification)
- Others (Electrochemical & Metallurgical Processes, Semi-automated Sorting)
- By Geography
- Germany
- United Kingdom
- France
- Italy
- Spain
- BENELUX (Belgium, Netherlands, and Luxembourg)
- NORDICS (Denmark, Finland, Iceland, Norway, and Sweden)
- Rest of Europe
Detailed Research Methodology and Data Validation
Primary Research
Mordor analysts spoke with material-recovery-facility managers, EPR scheme operators, equipment vendors, and local regulators across Germany, the UK, France, Italy, Spain, and the Nordics. Interviews verified throughput rates, average gate fees, and the status of emerging chemical-recycling lines that public data rarely cover.
Desk Research
Our team begins with open datasets from Eurostat, the European Environment Agency, and national environment ministries, then overlays trade-flow detail from Eurostat Comext, patent counts in Questel, and monthly London Metal Exchange price tracks to spot commodity swings. Company filings on D&B Hoovers and news on Dow Jones Factiva reveal processor capacity moves and contract wins. These sources frame generation volumes, policy triggers, and price corridors. The examples cited are illustrative; many other publications support data collection, cross-checks, and clarification.
Market-Sizing & Forecasting
We rebuild market value top-down by pairing Eurostat waste-generation tables with observed recycle rates per material, then multiplying by typical gate fee plus recovered-material sales spreads. Sample plant roll-ups of capacity multiplied by average selling price serve as a bottom-up sense check before totals are adjusted. Key inputs include per-capita municipal waste, industrial production index, mandated recycled-content targets, EPR fee differentials, secondary metal and polymer price indices, and announced plant additions. A multivariate regression supported by ARIMA smoothing projects each driver to 2030, while scenario analysis frames commodity price shocks. Capacity gaps are bridged using license data and utilization factors gathered in interviews.
Data Validation & Update Cycle
Every model run passes automated variance tests, a peer review, and senior sign-off. We refresh figures yearly and trigger interim updates when any core variable deviates beyond preset bands.
Credibility Anchor - Why Mordor's Europe Waste Recycling Services Baseline Stands Out
Published numbers differ because some firms bundle disposal, transport, or energy recovery, convert currencies on different dates, or roll forward old baselines. By focusing only on recycling revenue, applying transparent drivers, and updating each year, we provide a narrower yet clearer benchmark that clients can trace and replicate.
Benchmark comparison
| Market Size | Anonymized source | Primary gap driver |
|---|---|---|
| USD 73.89 Bn (2025) | Mordor Intelligence | - |
| USD 155.20 Bn (2022) | Regional Consultancy A | Includes disposal, incineration, logistics; older base year not inflation-adjusted |
| USD 188.28 Bn (2022) | Global Consultancy B | Sizes full waste-management chain, uses contract value not realized revenue |
| USD 394.40 Bn (2023) | Trade Journal C | Combines collection, transport, and WtE; derived from macro spend ratios |
These comparisons show how our disciplined scoping, driver selection, and refresh cadence make Mordor's figures the most reliable starting point for European recycling strategy.


Key Questions Answered in the Report
What is the current size of the Europe waste recycling services market?
The Europe waste recycling services market is valued at USD 77.45 billion in 2026 and is expected to reach USD 98.01 billion by 2031 at a 4.82% CAGR during the forecast period (2026-2031).
Which material stream is growing fastest within the sector?
Battery recycling is forecast to expand at a 9.70% CAGR, driven by electric-vehicle growth and EU critical-materials policy.
Why is Germany the largest national market?
Germany combines a robust regulatory framework, advanced infrastructure, and a large industrial base, giving it a 22.31% share of regional revenue.
How are EPR schemes shaping market demand?
EPR mandates transfer end-of-life responsibility to producers, creating predictable revenue streams for recyclers and accelerating investment across plastics, textiles, and electronics.
What technologies are reshaping competitive dynamics?
AI-enabled sorting, chemical recycling for mixed plastics, and hydrometallurgical battery processes are improving material purity and opening new feedstock categories.
What key restraint could slow market growth?
Margin compression from volatile secondary material prices remains a significant headwind despite rising policy-driven demand.
Page last updated on:


