Sweden Organic Waste Collection Services Market Size and Share
Market Overview
| Study Period | 2020 - 2031 |
|---|---|
| Forecast Data Period | 2026 - 2031 |
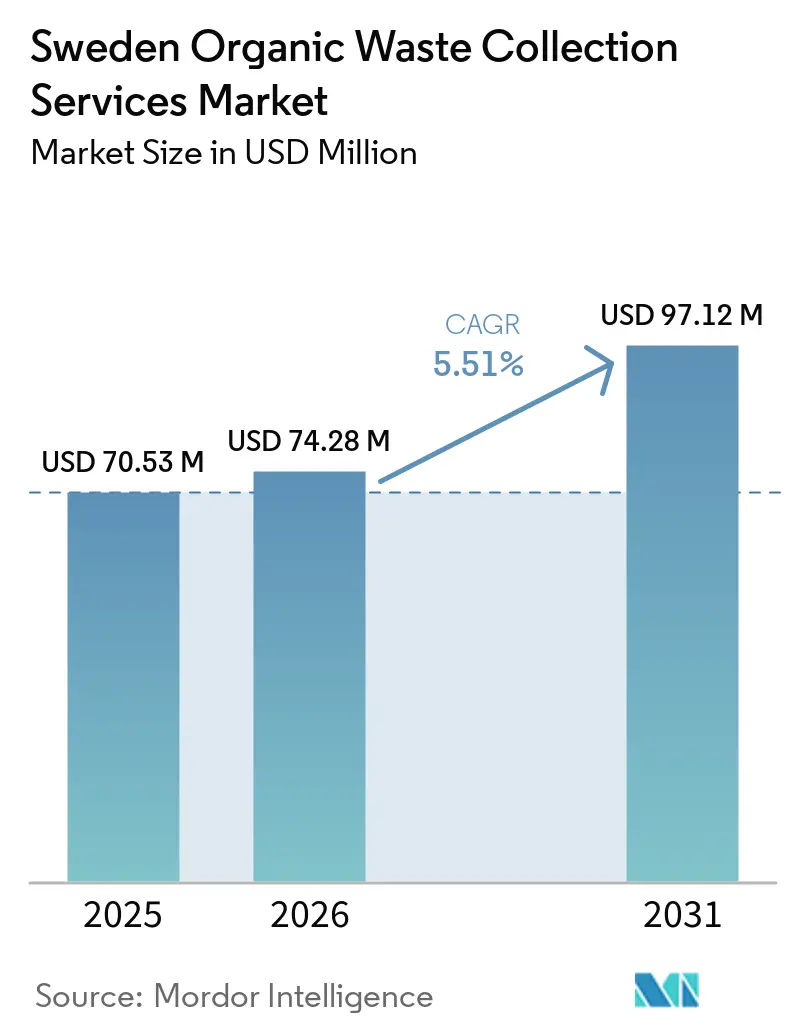
| Base Year Market Size (2025) | USD 70.53 Million |
| Market Size (2026) | USD 74.28 Million |
| Market Size (2031) | USD 97.12 Million |
| Growth Rate (2026 - 2031) | 5.51% CAGR |
| Market Concentration | Low |
Major Players
*Disclaimer: Major Players sorted in no particular order Image © Mordor Intelligence. Reuse requires attribution under CC BY 4.0. |
|
Sweden Organic Waste Collection Services Market Analysis by Mordor Intelligence
The Sweden Organic Waste Collection Services Market size is expected to grow from USD 70.53 million in 2025 to USD 74.28 million in 2026 and is forecast to reach USD 97.12 million by 2031 at 5.51% CAGR over 2026-2031.
From early 2024, the mandatory separate collection of bio-waste from households and businesses accelerated adoption, with 284 of 290 municipalities implementing door-to-door food waste programs that strengthened compliance and increased volumes entering biological treatment. Sweden’s 2024-2030 National Waste Plan and the reported 6% increase in 2024 biogas output confirm that anaerobic digestion capacity is not the binding constraint, which shifts near-term focus to improving capture rates and route efficiency for organics collection. Producer responsibility reforms tabled in January 2026 clarify roles across the value chain and are expected to broaden commercial collection networks as retail waste producers assume primary responsibility for certain municipal waste flows from July 2026. Cost signals reinforce the trend, with a 2025 landfill tax of SEK 744 (USD 74.4) per tonne and procurement criteria linking tenders to environmental management standards and to fossil-free fleets, rewarding early adopters of electrification and digital route optimization. Long-term funding frameworks for biogas, including reserved national support allocations for 2027, further stabilize downstream demand for clean organic feedstock that collection operators can supply at scale.
Key Report Takeaways
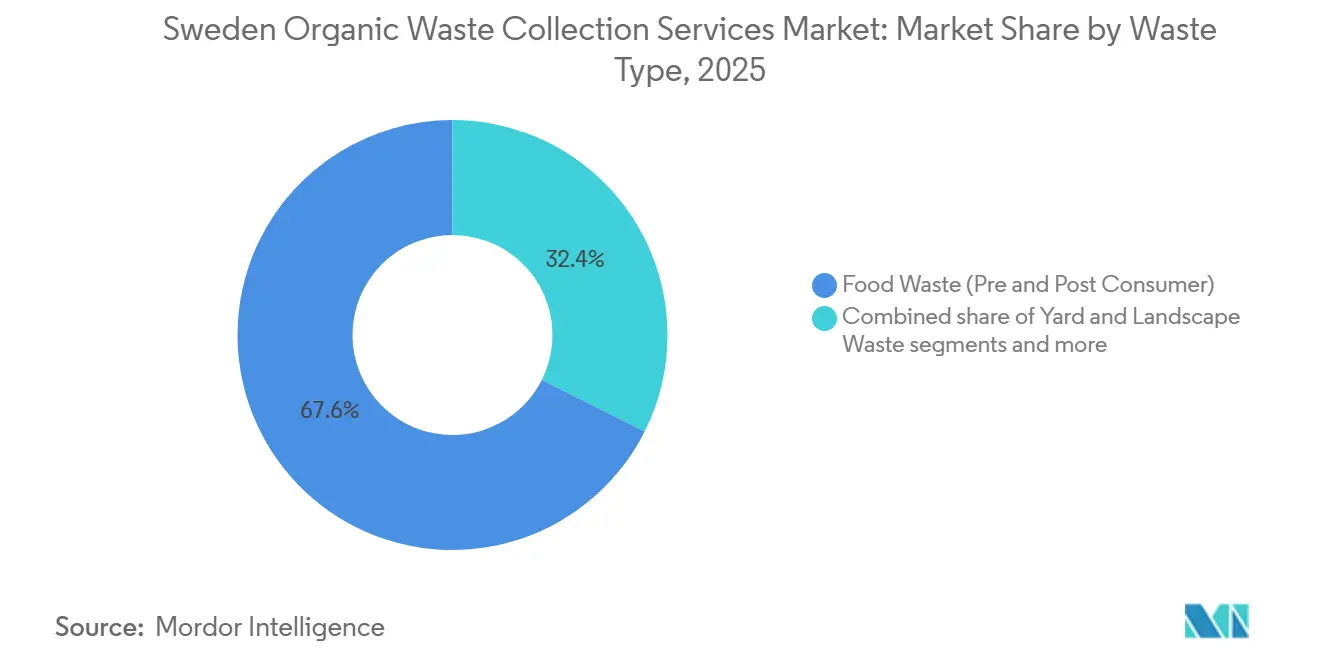
- By waste type, food waste accounted for 67.6% of Sweden organic waste collection service market size in 2025 and is projected to expand at a 6.27% CAGR through 2031.
- By end-user, the residential segment commanded 72.5% of Sweden organic waste collection service market share in 2025, while commercial food service is forecast to grow at a 6.87% CAGR through 2031.
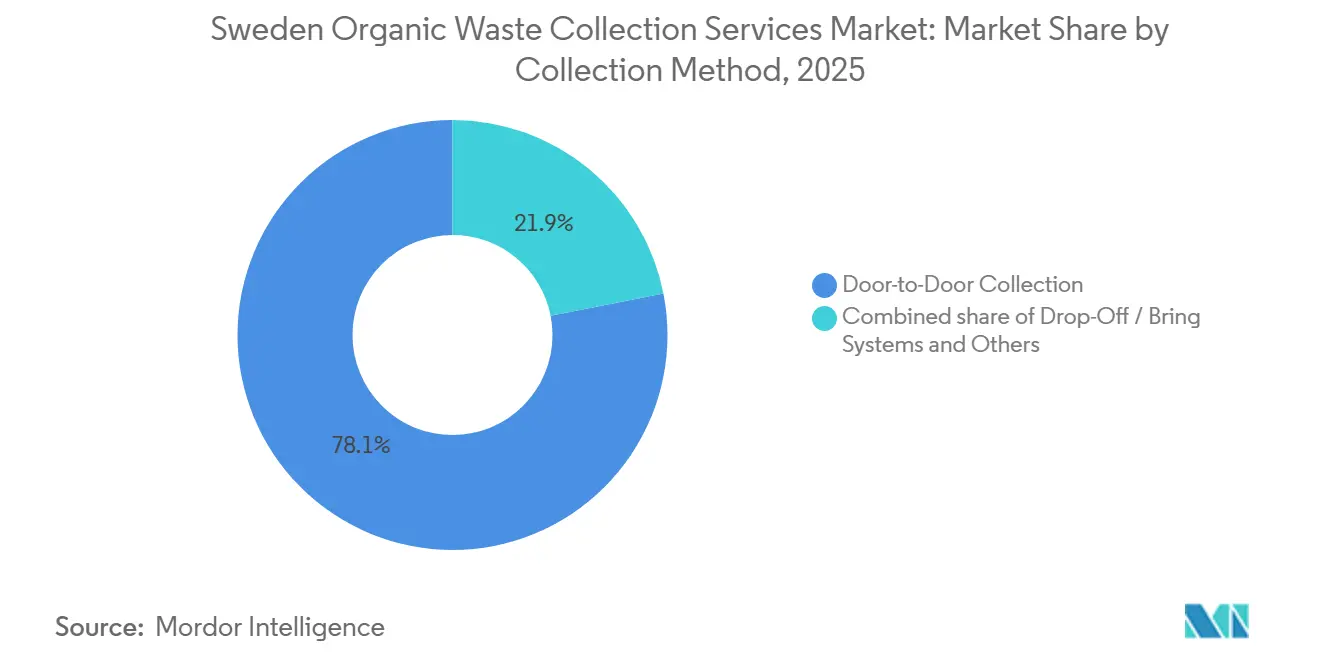
- By collection method, door-to-door collection held 78.1% share in 2025 and is advancing at a 7.46% CAGR through 2031 as property-near service becomes standard under national rules.
- By technology & equipment, semi-automated systems accounted for 48.7% of the market in 2025, while fully automated systems recorded the highest projected CAGR at 7.81% through 2031, supported by municipal transitions to electric fleets and ergonomic cabs for drivers.
Note: Market size and forecast figures in this report are generated using Mordor Intelligence’s proprietary estimation framework, updated with the latest available data and insights as of January 2026.
Sweden Organic Waste Collection Services Market Trends and Insights
Drivers Impact Analysis*
| Driver | (~) % Impact on CAGR Forecast | Geographic Relevance | Impact Timeline |
|---|---|---|---|
| Sweden's Ambitious Circular Economy Goals and Waste-to-Resource Transformation Targets | +1.8% | National, strongest in Stockholm, Gothenburg, Malmö | Medium term (2-4 years) |
| Growing Biogas Production Demand Driving Organic Waste Feedstock Requirements | +1.5% | National, especially Västra Götaland and Stockholm | Long term (≥ 4 years) |
| Rising Landfill Taxes and Disposal Costs Making Organic Waste Diversion Economically Attractive | +1.1% | National, uniform tax application | Short term (≤ 2 years) |
| Increasing Consumer Awareness and Environmental Consciousness Regarding Waste Segregation | +0.9% | National, higher in urban centers | Medium term (2-4 years) |
| Municipal Commitments to Achieving Carbon Neutrality and Reducing Methane Emissions | +0.7% | National, led by major cities | Long term (≥ 4 years) |
| Technological Advancements in Collection Logistics and Route Optimization | +0.6% | National, earlier adoption in larger municipalities | Medium term (2-4 years) |
| Source: Mordor Intelligence | |||
Sweden's Ambitious Circular Economy Goals and Waste-to-Resource Transformation Targets
Sweden’s National Waste Plan 2024-2030 elevates the role of separate collection and biological treatment of bio-waste to help meet EU recycling ambitions, translating into clearer expectations for municipalities to raise capture rates and for service providers to improve quality and throughput. Policy reform gained further traction in early 2026 when Proposition 2025/26:108 proposed shifting certain collection responsibilities to retail and related producers, reallocating operational duties and investment decisions across the chain, and unlocking new commercial routes for organic waste from shops and offices. Sweden’s updated National Energy and Climate Plan aligns food-waste prevention with energy and climate objectives, including a mid-decade material reduction target that is now pushing local authorities to expand separate collection and reduce contamination in organics.[1] Ministry of Climate and Enterprise, “Sweden’s Updated National Energy and Climate Plan 2021–2030,” European Commission, commission.europa.eu European monitoring in 2025 highlighted that progress on waste prevention and recycling requires faster infrastructure buildout and improved data, which can favor operators that offer verifiable quality and reporting at contract tendering. Aligned with these policy signals, Avfall Sverige’s 30 by 30 goal seeks a 30% reduction in residual waste by 2030 from 2023 baselines, a target that effectively raises demand for organics collection, pre-treatment, and logistics optimization to funnel more feedstock into anaerobic digestion or composting lines. New multi-municipal tenders, such as Ohlssons AB’s four-compartment rollouts starting in 2026 across Sörmland, show how operators are building integrated routes for food waste alongside packaging streams to hit policy milestones while meeting procurement sustainability clauses.
Growing Biogas Production Demand Driving Organic Waste Feedstock Requirements
Swedish biogas production rose 6% to 2,395 GWh in 2024, driven mainly by co-digestion and farm-based projects, while upgrading capacity remained underutilized relative to its potential, underscoring the need for steady, clean organic waste feedstock from municipal and commercial collection streams. Funding demand in 2026 surpassed the biogas support budget for the first time, reflecting strong investment appetite, including applications for liquefaction capacity that target heavy-duty transport fuel markets. Municipal investments reinforce this pull effect, as shown by Renova’s February 2026 decision to enhance pre-treatment at Marieholm to boost slurry yields by about 15-20%, an upgrade aligned with Gothenburg’s regional objective to increase the share of food waste that becomes biogas and biofertilizer over the decade. The national support scheme commits to reserved allocations for 2027 and differentiated incentives for manure-based gas, providing long-duration visibility for investors and de-risking upstream contracts for high-quality organics collection. Adjacent value streams, such as biogenic CO2 capture, demonstrated at scale in Linköping, impose additional quality requirements on incoming waste, as contamination that degrades gas or CO2 purity can endanger downstream sales or environmental crediting. As a result, collection operators that can guarantee low-contamination organics and transparent traceability gain a competitive edge, as digestion plants and municipalities seek stable biogas output.
Rising Landfill Taxes and Disposal Costs Making Organic Waste Diversion Economically Attractive
Sweden’s landfill tax reached USD 81 per tonne in 2025, raising disposal costs and strengthening the case for sending organic waste for composting and anaerobic digestion rather than landfill. The tax structure exempts waste directed to full biological treatment, while residues after treatment remain taxable, which creates a clear cost advantage for complete diversion pathways. Municipal accounts for 2024 showed higher household waste fees and a wide gate-fee spread between anaerobic digestion and landfill, which steers nearly all collected organics away from disposal. Seasonal tariff updates have extended collection windows for garden waste and holiday homes, and adjusted latrine service charges, reflecting routing and handling realities and aligning with separate collection goals. Weight-based fee models in over 40 municipalities shift liability to generators and reward households and businesses that sort food waste and reduce residual weights. Differential per-kilogram pricing for sorted versus mixed residuals in larger cities adds a visible premium on non-compliance, which lifts capture rates and helps protect digester uptime.
Increasing Consumer Awareness and Environmental Consciousness Regarding Waste Segregation
Public campaigns, school programs, and clear bin signage are teaching households and businesses how to sort food scraps and garden organics. Property-near access to color-coded, four-compartment bins reduces confusion and turns daily sorting into a simple routine. Digital prompts from municipal apps, QR codes on bins, and driver feedback create quick learning loops that cut contamination and improve bin quality. Weight-based fees and visible price differences between sorted and mixed residuals give residents and restaurants a direct reason to keep organics clean. Retailers, housing providers, and HoReCa chains now run their own engagement drives that align with corporate goals and local rules, boosting participation. As awareness spreads, organic capture improves, routes become more predictable, and the quality of feedstock entering digestion plants rises, supporting steady growth for collection services.
Restraints Impact Analysis*
| Restraint | (~) % Impact on CAGR Forecast | Geographic Relevance | Impact Timeline |
|---|---|---|---|
| Contamination Issues in Organic Waste Streams Affecting Processing Efficiency | -0.8% | National, higher in multi-dwelling units and rural areas | Short term (≤ 2 years) |
| Rural Area Collection Challenges Due to Lower Population Density and Longer Routes | -0.6% | Northern and archipelago municipalities with <10 inhabitants per km² | Medium term (2-4 years) |
| Limited Composting and Anaerobic Digestion Facility Capacity in Certain Regions | -0.5% | Regional, notably Norrbotten, Västerbotten, Västernorrland, and the archipelagos | Medium term (2-4 years) |
| Seasonal Variations Affecting Collection Frequency and Operational Costs | -0.4% | National, stronger where holiday homes exceed 15% of the housing stock | Short term (≤ 2 years) |
| Source: Mordor Intelligence | |||
Contamination Issues in Organic Waste Streams Affecting Processing Efficiency
Household statistics continue to show gaps in sorting quality, with zones offering property-near collection reporting much lower packaging leakage into residual waste than areas without the same service level, which indicates that container access and system design influence contamination in food-waste bins as well. Anaerobic digestion plants typically need contamination below around 5% by weight to maintain digestate certification, which keeps biofertilizer markets open and helps ensure near-total utilization of outputs. In contrast, higher contamination can lead to downgrades, maintenance issues, and even load rejection, with direct financial impacts. Consultations in 2025 flagged challenges with certain on-site drying units in commercial kitchens that create a secondary waste stream requiring regulated treatment, which can add SEK 400-600 (USD 40.0-60.0) per tonne to re-handling and pest control if protocols are not followed. Animal by-product rules remain a compliance hurdle, as specific categories require sterilization or incineration, which complicate packaging separation in food service and retail settings and can lead to default mixed disposal, leaving uncertainty. Public-housing companies also report penalties linked to mis-sorting incidents, while a small share use standardized quality-assurance methods, suggesting a need for digital tracking, shared data, and consistent assessment tools across contractors and landlords. Closing these gaps is essential for the Sweden organic waste collection service market to scale clean feedstock supply without bottlenecks at the plant gate.
Rural Area Collection Challenges Due to Lower Population Density and Longer Routes
Low population density and long driving distances in northern and archipelago areas stretch route times and reduce stop density, which raises per-tonne collection costs. Seasonal occupancy in holiday-home zones concentrates most tonnage into summer weeks while vehicles and crews remain underutilized during off-season months, which weakens asset productivity. Winter conditions with snow, ice, and limited daylight slow operations and force less frequent pickups and bin consolidation, which increases missed-collection risks and customer service load. Ferry-dependent islands and narrow roads restrict vehicle sizes and turning radii, which pushes manual handling and multiple transfers that add time and safety risks. Sparse access to nearby digestion facilities in these regions extends haul distances to processing hubs, which makes any load rejection for contamination more costly and disruptive. These constraints reduce the feasibility of city-like door-to-door service frequencies and require hybrid approaches such as seasonal routes, shared bring points, and dynamic scheduling to maintain service quality at sustainable cost.
*Our forecasts treat driver/restraint impacts as directional, not additive. The impact forecasts reflect baseline growth, mix effects, and variable interactions.
Segment Analysis
By Waste Type: Pre-Consumer Food Flows Anchor Volumes as Policy Tightens Sorting
Food waste, including pre- and post-consumer streams, accounted for 67.6% of collected organic tonnage in 2025, supported by separate collection expansion and local enforcement, which are expected to lift volumes over the forecast period. The Sweden organic waste collection service market for food waste is projected to expand at a 6.27% CAGR between 2026 and 2031 as municipalities scale up property-near bin systems and improve contamination control in households and commercial kitchens. Pre-consumer material from food and beverage manufacturing complements household streams by stabilizing composition for digestion. For example, Renova’s Marieholm line processes a combined 50,000 tonnes per year, balancing pre-treated household organics with industrial residues to optimize methane yields and slurry quality. Collection capture varies by region, with 2024 household data showing an average of 44 kilograms per capita and higher performance in counties such as Blekinge at 55 kilograms per capita compared with Västernorrland at 28 kilograms per capita, a spread that often mirrors bin access and communication campaigns. Mandatory edible-fat separation in food service from 2024 is drawing new tonnage into structured pickups and supporting higher-energy substrates in digestion lines. This adjustment can also shift cost structures for compliant restaurants by better valorizing collected fats.
Yard and landscape waste remains the second-largest organic fraction. It follows a bimodal seasonal pattern, leading some municipalities to extend pickup calendars and align fees with the marginal costs of operating routes during shoulder months, when volume is variable. Valorization options beyond compost are being tested, including biochar pilots that surface technical hurdles in pre-treatment and process stability and show that multi-step crushing and robust equipment are prerequisites for scale-up. Agricultural residues, while less prominent in urban areas, became more important for rural digestion projects as farm-based biogas production grew in 2024, supported by incentives and blending strategies that combine manure with food waste and crop residues. This interplay creates local competition for school cafeteria and institutional kitchen waste between municipal collection routes and farm digesters that seek consistent feedstock to meet output targets. As these channels mature, the Sweden organic waste collection service market will likely rely on clearer source-separation protocols and contract design to maintain quality and support end-markets for biofertilizer and biogas.


By End-User: Commercial Kitchens Outpace Households as Compliance Costs Converge
Residential generators accounted for 72.5% of collected volumes in 2025, including 498,110 tonnes of food waste and additional yard organics, a scale achieved by near-universal door-to-door programs and property-near infrastructure in most municipalities. On a broader biological treatment basis, the combined tonnage, including home composting and wastewater digestion, reached 766,030 tonnes in 2024, underscoring the importance of consistent household participation in meeting circular economy targets. The Sweden organic waste collection service industry now sees commercial food service as the fastest-growing segment, with hotels, restaurants, and catering improving source control and benefiting from the higher energy density of kitchen fats, which boost biogas yields per kilogram of collected material. City programs, such as Gothenburg’s plan to lift the share of commercial kitchens sending organics to digestion, are drawing more private operators into contracts that couple food-waste collection with grease-trap servicing and edible-oil pickups on consolidated routes. These shifts are changing route economics, labor planning, and contamination controls across the Sweden organic waste collection service market as service tiers grow more specialized. The commercial foodservice segment is projected to grow at a CAGR of 6.87% over the forecast period.
Industrial food processing and manufacturing provide stable pre-consumer tonnage under long-term feedstock agreements that hedge digestion plant composition risk. However, these streams must comply with animal by-product handling rules that elevate packaging removal and sterilization steps for certain categories. In rural areas, higher manure-biogas incentives since 2024 and sustained support through the late 2020s are helping farm-based plants compete for nearby organics. This trend may rebalance flows between centralized and distributed digestion over time. The Sweden organic waste collection service industry is responding with contract models that bundle data reporting, quality verification, and sustainability certifications to meet tightening procurement standards and client expectations. Where possible, industrial and commercial pickups are integrated with residential routes to raise stop density and keep unit costs in check while preserving feedstock quality required by digestion facilities. These dynamics favor operators who can harmonize household and business flows and reliably deliver low-contamination organic loads.
By Collection Method: Door-to-Door Dominance Cements Grip as Policy Mandates Narrow Alternatives
Door-to-door collection accounted for 78.1% of volumes in 2025 and is projected to grow at a 7.46% CAGR through 2031 as national requirements standardize property-near service and reduce reliance on bring systems for food waste. In practice, collection contracts are now designed around four-compartment that consolidate food waste, packaging, residuals, and paper, thereby increasing stop density and supporting predictable scheduling and load factors at scale. New municipal wins in mid-sized cities illustrate the operational template, as operators invest in electric fleets and charging infrastructure to improve route economics and align with fossil-free commitments embedded in tenders. This integration reduces noise during pre-dawn routes and supports driver ergonomics, reducing injuries and improving service reliability across the Sweden organic waste collection service market.
Bring systems remain relevant for bulky organics and in archipelagos where ferry-dependent logistics and low density challenge kerbside economics, which is why municipal guidance often retains centralized points for glass and metal while moving packaging and food waste to property-near service. Niche pneumatic systems have a small national share but demonstrate step-changes in energy and emissions performance when installed in high-density districts, including measurable reductions in residual waste and lower truck traffic from centralized extraction. Given these trade-offs, door-to-door will remain the core collection method for food waste, while tailored bring systems and pneumatic solutions address location-specific constraints. Together, these choices increase consistency in feedstock supply and support biogas operators’ need for stable volumes and quality over time. This approach anchors route optimization, fleet investments, and performance metrics that municipalities now use to evaluate bids in the Sweden organic waste collection service market.
By Technology & Equipment: Electrification Propels Fully Automated Systems Past as Semi-Automated Fleet Plateaus
Semi-automated rear loaders with hydraulic lifts held 48.7% share in 2025, reflecting compatibility with the dominant bin standards used nationwide and the embedded base of trained crews and service routines. Fully automated systems are the fastest-growing configuration through 2031 with a 7.81% CAGR, propelled by electric-truck rollouts, better cab ergonomics, and route designs that reduce repetitive manual movements for crews over long shifts. Fleet electrification eliminates tailpipe emissions during kerbside work and reduces noise, easing early morning access rules and allowing operators to balance rounds across the day without breaching noise limits. As municipal depots add charging infrastructure, the total cost of ownership can converge with or beat diesel in several routes where predictable stop density and regenerative braking amplify efficiency. This supports steady upgrades as tenders increasingly weigh fossil-free fleets and work-environment criteria in bid scoring.
Manual systems persist in certain narrow-street or island zones where access constraints preclude standard trucks, raising per-tonne costs and limiting service options, such as garden-waste pickup, to keep contracts financially viable.[2]Göteborgs Stad, “Waste Tariffs for Single-Family Houses,” Göteborgs Stad, goteborg.se Pneumatic and vacuum systems in dense new developments and medical facilities reduce vehicle movements, energy use, and contamination risks, with measured hygiene benefits that align with strict facility standards and sustainability targets.[3]Envac Group, “Sustainability Report 2024 Highlights,” Envac, envacgroup.com Beyond the vehicle, digitization of bin monitoring and automated quality checks with cameras and AI are lowering operational costs and improving feedstock purity, which is now a differentiator in municipal tenders and biogas off-take agreements. Together, these technology layers reinforce the performance edge for operators that invest in clean fleets and data-driven workflows in the Sweden organic waste collection service market
Geography Analysis
Greater Stockholm, Västra Götaland, and Skåne accounted for 62% of the national total of collected food waste in 2024, roughly 305,000 of the 498,110 tonnes recorded that year, driven by high door-to-door penetration and mature processing infrastructure close to waste sources. This clustering supports lower transport costs, predictable gate fees, and better alignment with municipal climate plans that favor clean collection fleets and high organics diversion rates. In the Sweden organic waste collection service market, these regions serve as the core demand centers for route-optimization tools, electrification pilots, and producer responsibility transitions that will reshape commercial account servicing through 2031.
Biogas grid connectivity shapes local economics by reducing transport and handling for upgraded biomethane, with southwestern Sweden and Stockholm absorbing significant volumes of injected gas in 2024 even as liquefied biogas for heavy-duty vehicles grew quickly. Where plants and grids are co-located with dense populations, operators can plan round trips that maintain high payloads and stable schedules, lowering per-tonne collection costs and strengthening the case for additional property-near services. Regions with fewer digestion plants and longer hauls must manage higher logistics costs, which increases the value of contamination control to avoid rejected loads and protect margins. These differences are material for local planning, as capture rates vary by tens of kilograms per capita and influence the fraction-specific education and bin access needed to meet policy targets.
Northern and archipelago municipalities face additional constraints tied to low density, seasonal population shifts, and winter operations, which drive route designs with monthly pickups in colder months and strict container access controls outside of high season for holiday homes. These patterns result in higher per-tonne costs, for example SEK 550-700 per tonne (USD 55.0-70.0), compared with SEK 280-350 per tonne, (USD 28.0-35.0), in year-round service areas with higher density and more stable flows. To improve scale and economics, mid-sized cities are aggregating procurement across municipal clusters with fossil-free mandates, thereby strengthening the business case for electric trucks and ISO 14001-certified operations and drawing more national players into competitive tenders. New multi-year awards in Norrköping and other hubs show how regional operators are scaling electrification and route analytics to anchor services in the Sweden organic waste collection service market over the next contract cycles.
Competitive Landscape
The Sweden organic waste collection service market remains fragmented, with municipal-owned entities managing a majority of residential volumes while private operators expand in commercial food service and industrial niches that benefit from specialized service tiers and cross-municipal routing. The 2024-2026 shift to mandatory separate collection for food waste increased tendering activity, with 284 of 290 municipalities operating door-to-door programs and embedding sustainability-weighted criteria into selection processes. Operators that scale electrified fleets, deploy data-driven route optimization, and offer transparent quality reporting are improving bid competitiveness as municipalities seek both cost control and emissions reduction. In Norrköping, a 5-8-year contract starting in 2026 includes a commitment to a seven-vehicle electric fleet and depot charging, signaling that fossil-free operations are becoming standard for large municipal routes.
Vertical integration is an emerging differentiator. Renova’s upgrade to its Marieholm pre-treatment line, approved in February 2026, improves slurry output quality and strengthens the link between collection, pre-treatment, and digestion off-take, which supports regional goals to convert a larger share of food waste into biogas and biofertilizer. Partnerships that close material loops beyond organics, such as Ragn-Sells’ flat-glass circularity pilot with industrial partners, show how waste companies are diversifying across resource streams while building capabilities in traceability and compliance that also benefit organics routing and quality monitoring. Adjacent projects in biogenic CO2 capture and storage add value streams tied to gas purity, which further raises the premium on low-contamination collection practices and verified data along the chain.
Digitalization and behavioral tools complement fleet investments. IoT sensor deployments are shrinking empty miles and cutting rest-area trips, while AI-based bin imaging blocks contaminated loads at the source and saves processing plants from downtime and costly interventions. Pneumatic systems in high-density developments achieve lower energy use and fewer truck movements, which resonates with municipal climate plans and underscores how infrastructure choices influence collection footprints. As tenders increasingly weigh ISO 14001 and Fair Transport certification, contractors that combine certified management systems with verifiable data reporting will likely grow their share in the Sweden organic waste collection service market.
Sweden Organic Waste Collection Services Industry Leaders
-
Renova AB
-
Stena Recycling AB
-
Ragn-Sells AB
-
Remondis Sweden AB
-
Veolia Sweden
- *Disclaimer: Major Players sorted in no particular order

Recent Industry Developments
- January 2026: The government submitted Proposition 2025/26:108 to the Riksdag to reform waste legislation and shift certain producer responsibilities for municipal waste from July 2026, with separate sectoral reporting and clarified accountability along the value chain.
- January 2026: The Swedish Energy Agency reported subsidy applications of SEK 1,058 million (USD 105.8 million), against a SEK 1,035 million (USD 103.5 million), budget for 2026 biogas support, the first over-subscription since the scheme started.
- December 2025: Gothenburg published a biochar feasibility study that documented pre-treatment and process reliability barriers to garden-waste pyrolysis and called for robust equipment and multi-step crushing before larger-scale deployments.
- October 2025: The Swedish Energy Agency confirmed 2024 biogas production at 2,395 GWh, a 6% annual increase, with upgraded gas reaching 1,535 GWh and liquefied biogas use up 21%.


Sweden Organic Waste Collection Services Market Report Scope
The Sweden Organic Waste Collection Services Market is Segmented by Waste Type (Food Waste, Yard Waste & Landscape Waste, Agricultural Residues, and Others), by End-User (Residential, Commercial, Industrial, and Others), by Collection Method (Door-To-Door, Drop-Off / Bring Systems, and Others), and by Technology & Equipment (Manual, Semi-Automated, and More). The Market Forecasts are in Value (USD) and Volume (Tons).
| Food Waste (Pre and Post Consumer) |
| Yard & Landscape Waste |
| Agricultural Residues |
| Others |
| Residential |
| Commercial (HoReCa, Retail) |
| Industrial (Food Processing & Manufacturing) |
| Others (Agri-waste) |
| Door-to-Door Collection |
| Drop-Off / Bring Systems |
| Others |
| Manual Collection Systems |
| Semi-Automated Systems |
| Fully Automated Systems |
| Others |
| By Waste Type | Food Waste (Pre and Post Consumer) |
| Yard & Landscape Waste | |
| Agricultural Residues | |
| Others | |
| By End-User | Residential |
| Commercial (HoReCa, Retail) | |
| Industrial (Food Processing & Manufacturing) | |
| Others (Agri-waste) | |
| By Collection Method | Door-to-Door Collection |
| Drop-Off / Bring Systems | |
| Others | |
| By Technology & Equipment | Manual Collection Systems |
| Semi-Automated Systems | |
| Fully Automated Systems | |
| Others |


Key Questions Answered in the Report
What is the Sweden organic waste collection service market size and growth outlook to 2031?
The Sweden organic waste collection service market size is USD 74.28 million in 2026 and is projected to reach USD 97.12 million by 2031 at a 5.51% CAGR over 2026-2031.
Which end-user drives most volumes in Sweden’s organics collection?
Residential generators lead with a 72.5% share in 2025, supported by widespread door-to-door service and property-near bin systems.
Which collection method is most prevalent in Sweden’s organics ecosystem?
Door-to-door service accounts for 78.1% of collected volumes and is set to grow at a 7.46% CAGR as national rules standardize property-near collection.
Where are growth hotspots for organics collection in Sweden?
Greater Stockholm, Västra Götaland, and Skåne drive around 62% of collected food waste, supported by dense populations and strong digestion infrastructure.
What technology trends are improving organics collection performance?
Electric fleets, IoT fill-level sensors, and AI-based bin imaging reduce empty miles, improve route planning, and block contamination before it reaches digestion plants.
How do policies influence the Sweden Organic waste collection service industry outlook?
Producer responsibility shifts from July 2026, landfill taxation, and long-term biogas support all reinforce separate collection, route optimization, and cleaner feedstock for energy recovery.
Page last updated on:


