Organic Waste Collection Market Size and Share
Market Overview
| Study Period | 2020 - 2031 |
|---|---|
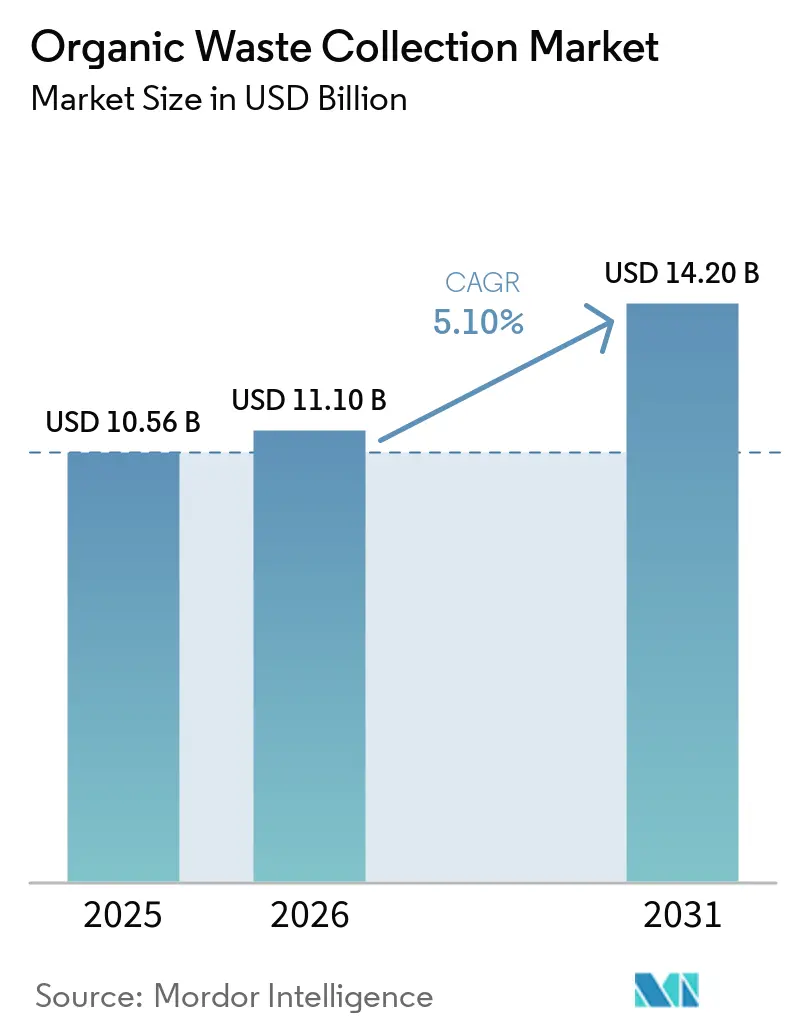
| Market Size (2026) | USD 11.10 Billion |
| Market Size (2031) | USD 14.20 Billion |
| Growth Rate (2026 - 2031) | 5.10% CAGR |
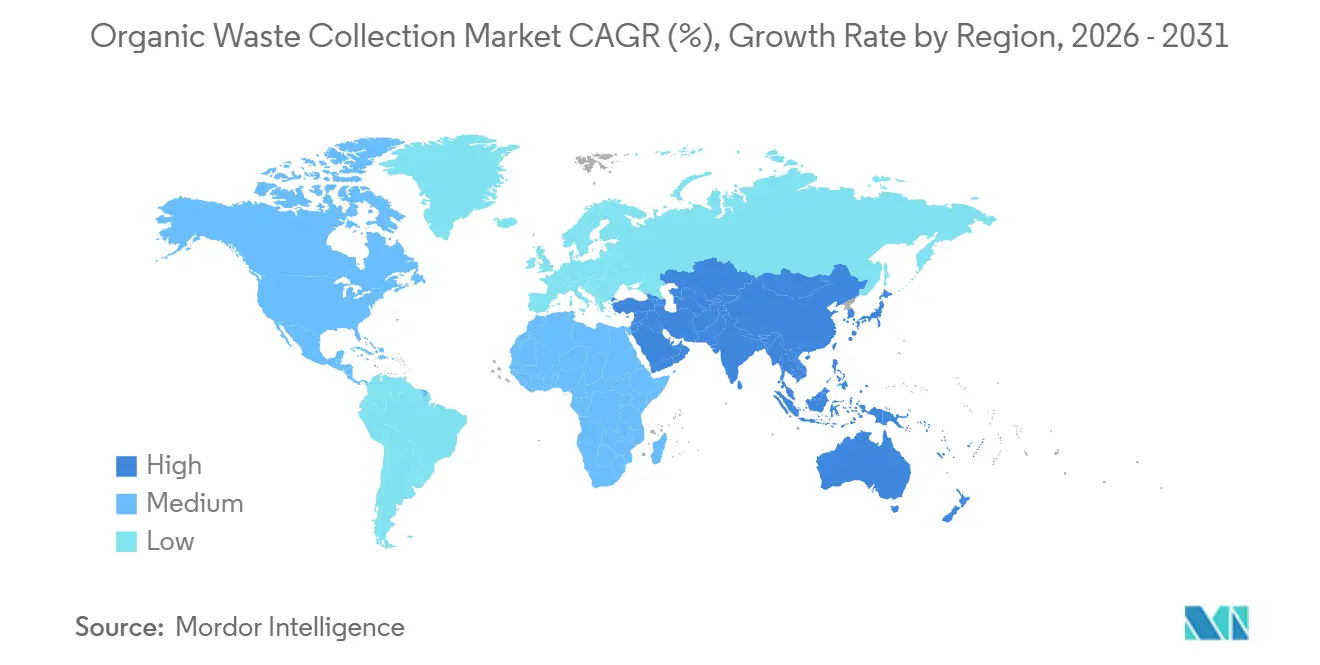
| Fastest Growing Market | Asia-Pacific |
| Largest Market | Asia-Pacific |
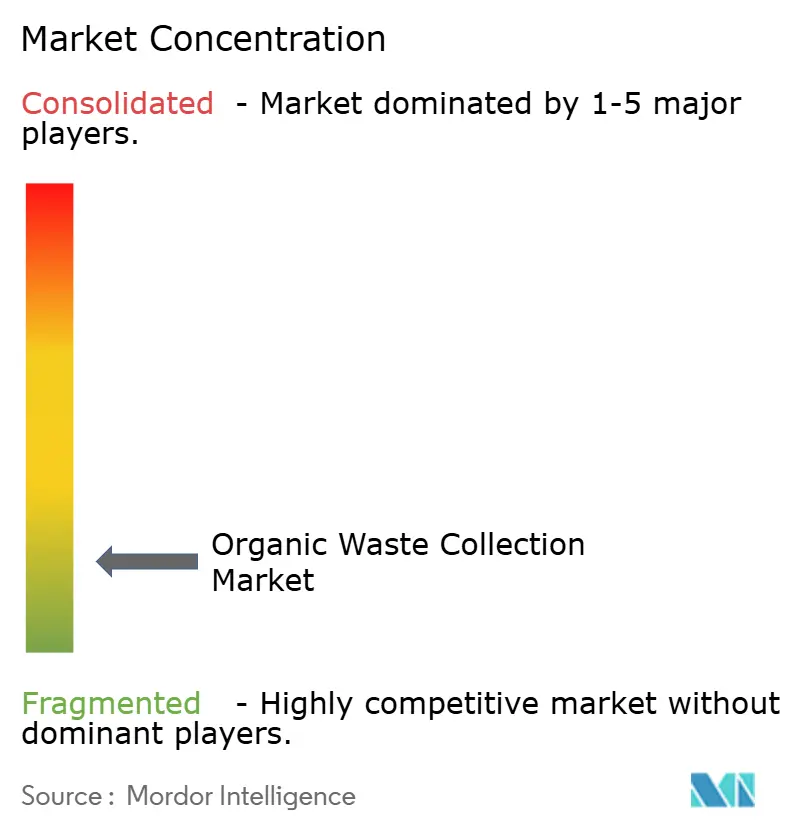
| Market Concentration | Low |
Major Players *Disclaimer: Major Players sorted in no particular order Image © Mordor Intelligence. Reuse requires attribution under CC BY 4.0. | |
Organic Waste Collection Market Analysis by Mordor Intelligence
The Organic Waste Collection Market size is expected to grow from USD 10.56 billion in 2025 to USD 11.10 billion in 2026 and is forecast to reach USD 14.20 billion by 2031 at 5.10% CAGR over 2026-2031.
Mandatory policies that require separate biowaste collection and food waste reduction shift organics from optional programs to core municipal services, raising the baseline for contracted collection volumes and processing throughput. Federal and state funding in the United States, along with targeted grants in Europe, is accelerating the deployment of composting and anaerobic digestion infrastructure, creating reliable outlets for collected streams and supporting new citywide rollouts. Urbanization patterns and the concentration of large generators in commercial corridors are increasing demand density, driving the need for route-based collection and service-level agreements that reward verified diversion outcomes. Advances in sensor-enabled containers, AI route planning, and one-person automated side loaders are improving operating ratios and service reliability, which strengthens the business case for expanding curbside and commercial pickup programs. Corporate decarbonization and waste-reduction commitments are also moving from pledges to procurement criteria, increasing demand for traceable, low-contamination organics collection solutions across food retail, hospitality, and manufacturing networks.
Key Report Takeaways
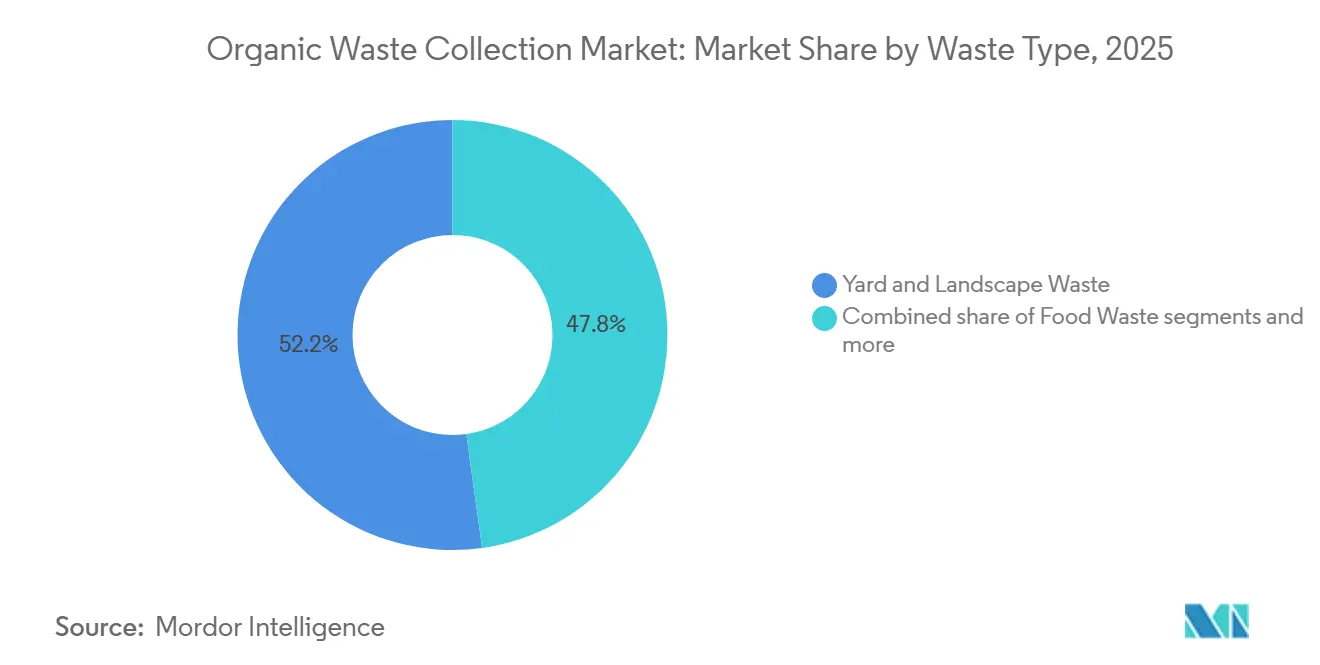
- By waste type, Yard and Landscape Waste accounted for 52.2% of organic waste collection market size in 2025. Food Waste is forecast to expand at a 5.78% CAGR to 2031.
- By end user, the Residential segment held a 54.1% share in 2025. Commercial Food Service records the highest projected CAGR at 6.23% through 2031.
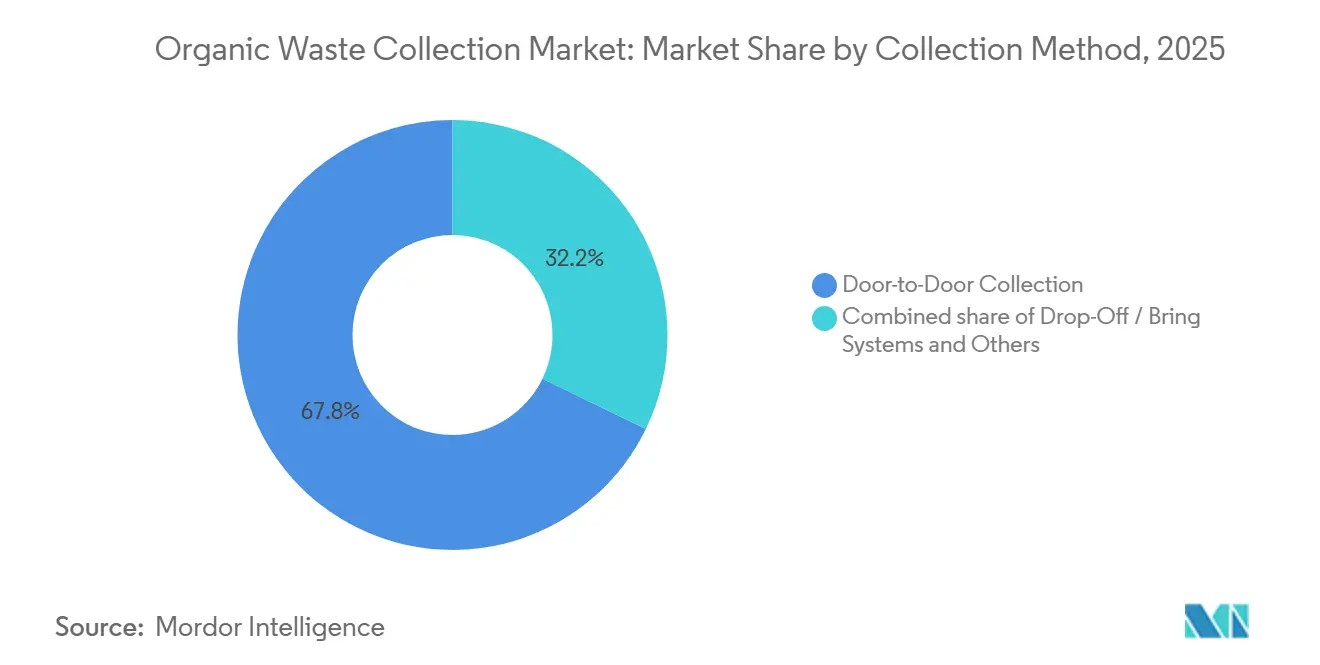
- By collection method, Door-to-Door Collection dominated with a 67.8% organic waste collection market share in 2025 and is also the fastest-growing, with a 6.72% CAGR to 2031.
- By technology and equipment, Semi-Automated Systems accounted for 62.3% of deployments in 2025. Fully Automated Systems post the highest projected CAGR at 6.46% through 2031.
- By geography, Asia-Pacific accounted for 33.2% share in 2025 and is projected to grow at a 7.54% CAGR through 2031
Note: Market size and forecast figures in this report are generated using Mordor Intelligence’s proprietary estimation framework, updated with the latest available data and insights as of January 2026.
Global Organic Waste Collection Market Trends and Insights
Drivers Impact Analysis*
| Driver | (~) % Impact on CAGR Forecast | Geographic Relevance | Impact Timeline |
|---|---|---|---|
| Stringent government regulations mandating organic waste segregation and diversion from landfills | +1.8% | Global, with early gains in the European Union, California, India, and China | Medium term (2-4 years) |
| Rising urbanization is driving higher volumes of municipal organic waste generation | +1.3% | Asia Pacific core, spill-over to Middle East and Africa | Long term (≥ 4 years) |
| Increasing adoption of circular economy principles and waste-to-energy initiatives | +0.9% | North America and the European Union | Medium term (2-4 years) |
| Growing environmental awareness and corporate sustainability commitments | +0.6% | Global | Short term (≤ 2 years) |
| Economic incentives and subsidies for organic waste management programs | +0.4% | National, with early gains in the United States , Germany, France, and India | Short term (≤ 2 years) |
| Expansion of composting infrastructure and biogas production facilities | +0.3% | European Union, North America, Asia Pacific | Long term (≥ 4 years) |
| Source: Mordor Intelligence | |||
Stringent Government Regulations Mandating Organic Waste Segregation and Diversion from Landfills
Regulatory mandates are driving organics diversion by requiring separate biowaste collection and food waste reduction. The European Union's Waste Framework Directive, effective October 16, 2025, mandates a 10% reduction in food waste during processing and manufacturing and a 30% per capita reduction at retail and consumption by 2030, alongside consistent biowaste collection across Member States. In the United States, the February 2025 National Strategy for Reducing Food Loss and Waste allocates USD 275 million for organics recycling infrastructure under the Solid Waste Infrastructure for Recycling framework, supported by education and outreach grants. France will require gas suppliers to source biogas production certificates from 2026, ensuring demand for biomethane from organic waste.[1]U.S. Environmental Protection Agency, “National Strategy for Reducing Food Loss and Waste and Recycling Organics,” EPA, epa.gov The Netherlands' 2026 biomethane grid-blending obligation will drive infrastructure investment, favoring low-contamination feedstock. However, uneven implementation persists, as an audit found low biowaste collection rates in three of four European Union Member States in 2022–2023, highlighting the need for enforcement, infrastructure, and public engagement.
Rising Urbanization Driving Higher Volumes of Municipal Organic Waste Generation
Population growth in large cities is concentrating organic waste streams in areas where route-based collection is operationally feasible, and capital spending can be justified, thereby expanding the addressable base for the organic waste collection market. UN DESA reports that cities housed nearly half of humanity in 2025, and that urban land area per person has expanded since 1975, which increases haul distances and creates new siting challenges that favor efficient routing and well-planned transfer points.[2]United Nations Department of Economic and Social Affairs, “World Urbanization Prospects 2025,” United Nations, population.un.org The expected expansion of megacities across Asia increases waste generation, strengthening the economics of fully automated side-loading vehicles, smart containers, and performance-based service contracts in dense multi-user districts. The World Bank’s work on solid waste management documents high levels of uncollected waste in lower-income settings, suggesting that the need for scalable, lower-cost organics collection models is most acute where city growth outpaces public budgets and collection coverage.[3]World Bank, “Clean Cities, Bright Futures: Accelerating Investment and Reforms in Solid Waste Management,” World Bank, worldbank.org As built-up areas expand faster than population, municipalities must plan for longer transport legs and more intermediate storage, which increases the value of contamination control and predictable scheduling to maintain feedstock quality for composting and digestion facilities. Regions with rapid urban growth and policy momentum, therefore, present the strongest conditions for new or expanded programs, which leads to a larger and more stable pipeline for the organic waste collection market.
Increasing Adoption of Circular Economy Principles and Waste-to-Energy Initiatives
Circular economy policies and investment plans are reframing organic waste as a feedstock for energy and soil products, clarifying revenue streams tied to biomethane, digestate, and compost, and reinforcing the value of reliable collection. The International Energy Agency estimates that today’s combined biogas and biomethane output accounts for only a small share of the technical potential from existing organic streams, indicating significant headroom for feedstock growth through better source segregation and dedicated collection routes. Europe’s sector-level data show digestate already displacing a meaningful portion of nitrogen fertilizer, supporting stable end markets for materials derived from high-quality feedstock delivered by disciplined collection programs. European Union stakeholders also outline specific measures to accelerate biowaste integration within broader bioeconomy strategies, which reinforce the case for investments to improve the capture and routing of residential and commercial organics. In the United States, federal support for local composting and food waste reduction planning helps cities stand up or scale collection services that achieve measurable diversion and provide consistent feedstock for new or expanded processing facilities. Large retailers have demonstrated that redistribution, digestion, animal feed, and compost pathways can be integrated into supply chains, validating the operational feasibility of high-volume diversion when reliable collection partners are available.
Growing Environmental Awareness and Corporate Sustainability Commitments
Brand, retail, and food manufacturing commitments are moving from policy statements to procurement and performance metrics, creating consistent demand for verified organic diversion and automated reporting. Leading corporate signatories to global packaging initiatives reduced virgin plastic use. They increased recycled content, even amid a growing market, demonstrating that supply chain partners respond when contracts include measurable targets and transparency requirements. Food producers are embedding waste reduction into decarbonization plans and setting science-based targets, expanding the role of external haulers to ensure stable service levels, enabling digital tracking, and providing evidence of diversion to support Scope 3 accounting. Distribution and retail groups are increasing diversion rates and formalizing data-collection partnerships, raising the bar for vendor selection toward operators with IoT-enabled monitoring and report-ready data interfaces. Major food companies have achieved high diversion at the facility level through recycling, donations, and animal feed pathways, demonstrating that end-market alignment is possible at scale when internal and contracted collection performance is measured and rewarded. Policy reviews also recommend that governments pair soft measures with stronger public-private partnerships and periodic evaluations, which support a more consistent operating environment for the organic waste collection market.
Restraints Impact Analysis*
| Restraint | (~) % Impact on CAGR Forecast | Geographic Relevance | Impact Timeline |
|---|---|---|---|
| High initial capital investment for collection infrastructure and processing facilities | -1.1% | Global, acute in emerging markets | Medium term (2-4 years) |
| Contamination of organic waste streams reduces processing efficiency | -0.7% | North America and the EU | Short term (≤ 2 years) |
| Lack of public awareness and low participation rates in source segregation programs | -0.5% | Global, particularly acute in the Asia-Pacific and the Middle East | Medium term (2-4 years) |
| Limited availability of cost-effective collection and transportation solutions in rural areas | -0.3% | Rural regions globally, most acute in developing nations | Long term (≥ 4 years) |
| Source: Mordor Intelligence | |||
Contamination of Organic Waste Streams Reducing Processing Efficiency
Contamination increases preprocessing requirements, reduces product quality, and constrains end-market applications, thereby limiting the value captured from compost and digestate and increasing disposal risk if facilities reject loads. Evidence from national studies shows that food and garden waste streams face contamination challenges that have trended upward in recent years, underscoring the need for targeted outreach, bin standards, and feedback loops to address behaviors. Local experience in the United States confirms that targeted crew intervention and tagging can significantly reduce curb contamination, benefit downstream facilities, and support steady operations when co-digestion or composting is part of the municipal treatment mix. Processing operators communicate that contamination thresholds drive acceptance decisions, which places a premium on reliable source segregation and clear material standards within service agreements to avoid expensive rejections and re-routing. Federal agencies flag plastics and persistent chemicals as ongoing barriers, and they are working to synthesize science and provide technical assistance, which should support more consistent practices and standards across jurisdictions. These dynamics favor providers that combine service design with data-driven outreach and clear customer feedback, which can produce measurable reductions in contamination and higher-value outputs over time.
Lack of Public Awareness and Low Participation Rates in Source Segregation Programs
Participation rates remain a structural challenge when programs are voluntary, communications are infrequent, or residents lack clear bin guidance, which constrains capture even when processing capacity is available. National recycling surveys in the United States show participation and capture gaps among households, suggesting that consistent program communication and measurement frameworks are not yet standard practice across states and territories. Federal reporting to Congress confirms that many states do not collect, capture, and report contamination data, making benchmarking difficult and slowing improvement cycles for contamination reduction and service design. Citywide rollouts can collect large tonnages once operational, but sustained resident engagement and simple, consistent rules are needed to lift participation in dense multi-family districts and to stabilize contamination levels. Programs that pair service access with clear feedback and steadily enforced standards tend to show stronger outcomes, which supports the use of simple tools such as tagging, bin audits, and periodic information refreshes. Over time, better data, more consistent communication, and straightforward bin standards should increase participation and strengthen the business case for expanding the organic waste collection market.
*Our forecasts treat driver/restraint impacts as directional, not additive. The impact forecasts reflect baseline growth, mix effects, and variable interactions.
Segment Analysis
By Waste Type: Food Waste Expansion Outpaces Established Yard Waste Flows
Yard and Landscape Waste accounted for 52.2% of the organic waste collection market in 2025, reflecting long-standing seasonal programs and the relatively lower contamination inherent to outdoor green waste streams collected through well-understood municipal routes. Food Waste, covering pre-consumer and post-consumer sources, is projected to grow at a 5.78% CAGR through 2031 as separate food waste collection requirements in European Member States and the United Kingdom mature and expand to more local jurisdictions, increasing the share of putrescible material served by dedicated routes and service days. India has mandated four-stream source segregation under rules that take effect in 2026, elevating wet waste to a specific category in city plans and gradually scaling food waste capture as compliance increases. Agricultural Residues create sizable regional opportunities tied to livestock and crop systems, with projects that combine manure and crop wastes to produce biogas and compost-grade outputs under controlled conditions and steady feedstock contracts. Bio-Sludge and Wastewater Organics continue to provide integration points for co-digestion at water resource recovery facilities, which can absorb collected food waste to increase gas yields where plant design and permit conditions allow.
Food Waste growth will be supported by the expansion of citywide residential programs and by commercial organics mandates that define collection service expectations and reporting cadence for food service operators, helping maintain growth momentum even as yard waste remains the largest stream by volume in many jurisdictions. Dedicated digestion assets and long-term composting outlets are needed to handle forecast increases in Food Waste tonnage, which favors haulers and municipalities that pre-negotiate off take or maintain equity in local processing capacity to stabilize tipping fee exposure. Commercial Organics that are not food-related remain small but valuable, since they often consist of homogeneous, single-source streams that are easier to process and can be contracted on stable schedules, thereby improving route density and fleet utilization. As mandates settle and enforcement increases, the organic waste collection industry will likely prioritize service tiers, container standards, and packaging controls that reduce contamination and increase the throughput and value of downstream products.


By End-User: Commercial Food Service Intensity Drives Diversion Economics
Residential households accounted for 54.1% of collected volumes in 2025, reflecting the reach of municipal curbside systems and cart-based programs that standardize pickups across neighborhoods and support regular participation through simple rules and clear bin colors. Commercial Food Service is the fastest-growing end-user group, with a 6.23% CAGR through 2031, as restaurants, institutional cafeterias, and hospitality venues consolidate high volumes at fewer pickup points, reducing the per-ton cost of service and supporting cleaner streams through staff training and account-level feedback. Jurisdictions that define bulk waste generators and require onsite processing or verified off site diversion create compliance-driven demand that locks in recurring service days, documented tonnage, and contamination oversight for large generators in food service and institutional settings. The organic waste collection market benefits from these rules because they create regular demand and measurable performance, which justify route investments and staff training that improve yield and data quality over time.
Food Processing and Manufacturing offers high-volume, homogeneous streams that are simpler to segregate and collect, which supports steady co digestion yields and consistent compost inputs when contamination is controlled at the source. Retail and Grocery networks are formalizing partnerships for redistribution, animal feed, and composting, which reduce edible waste while moving inedible materials into diversion channels that depend on reliable collection and predictable pickup windows. Schools and other public institutions are accessing dedicated grants to reduce food waste, which helps pay for bins, training, and initial collection services that transition pilot efforts into standing programs with measurable outcomes. As reporting expectations tighten across sectors, the organic waste collection industry will create value for end users by combining curbside or dockside pickups with digital verification, contamination alerts, and basic analytics that link training to improved diversion rates.
By Collection Method: Door-to-Door Dominance Reflects Municipal Service Models
Door-to-Door Collection held a 67.8% share in 2025 and is also the fastest-growing method, with a 6.72% CAGR through 2031, mirroring city decisions to add organics to regular curbside services with standardized rules and carts across all neighborhoods and building types, where feasible. Major city rollouts have shown that tonnage scales quickly once service is universal and supported by fleet, staffing, and long-term processing contracts, which reduce program risk and support stepwise expansion based on district-level lessons. Centralized Drop-Off Collection serves areas without curbside density or where households prefer periodic trips to a community site, adding flexibility and filling service gaps. In contrast, community composting efforts integrate residents into program logistics. Bulk Collection supports large generators and construction sites that can stage material for high-capacity pickups, which improves route efficiency and contamination control when supported by clear acceptance standards and account-level training.
Underground and pneumatic systems are installed in dense districts and greenfield developments that plan for enclosed or underground storage, which reduces odors and improves street aesthetics but requires higher capital outlays that limit use to specific urban contexts. Event-based collection for yard waste peaks and subscription garden waste services offer flexible options that match seasonal needs and can be managed with cloud route planners to stabilize crew time and vehicle hours across the calendar. Over time, the organic waste collection market will likely blend these methods within cities, which allows residents and businesses to choose services that fit their density, storage space, and participation preferences while keeping contamination low and feedstock quality high. As mandates broaden and enforcement schedules tighten, universal curbside programs will remain the anchor method, complemented by drop-off and bulk solutions that extend coverage and produce cleaner streams for composting and digestion.
By Technology and Equipment: Automation Advances Disrupt Labor-Intensive Legacy Systems
Semi-Automated Systems accounted for 62.3% of deployments in 2025, anchored by rear and side loaders with cart lifters and two-person crews, delivering reliable service across a range of street widths and building layouts. Fully Automated Systems are the fastest-growing segment, with a 6.46% CAGR, as fleets adopt one-person side loaders, equip bins with fill-level sensors, and use cloud routing software to optimize collection days and stop sequences, reducing miles and fuel costs while improving on-time performance and resident satisfaction. City deployments that combine low-power networks, ultrasonic sensors, and predictive models are reducing route kilometers and resident complaints, demonstrating the operational leverage of data-driven scheduling and bin-level monitoring across public spaces and commercial accounts. Manual systems remain in use where access is constrained by narrow streets or steep terrain, and they can be supported with handheld RFID and asset tracking tools that improve pickup verification and basic analytics without a full automation upgrade.
Traceability tools are emerging to verify diversion under Extended Producer Responsibility and to support corporate claims, linking container access control, ID readers, and cloud-based records to audited outcomes at account and route levels. Route planning platforms that evaluate billions of options in minutes are cutting planning time and enabling dynamic changes, helping integrate add-on pickups, account growth, and contamination sweeps into a steady weekly cycle without service lapses. The organic waste collection industry will continue to benefit from lower sensor costs, longer device battery life, and interoperable software components, which reduce the cost of proof-of-ROI cases and support staged rollouts that align capital spending with verified operating savings. As automation scales, data quality will improve, which creates opportunities to offer premium service tiers tied to diversion guarantees, contamination thresholds, and verified low-emission operations to large commercial accounts.
Geography Analysis
Asia-Pacific accounted for 33.2% of the organic waste collection market size in 2025 and is projected to be the fastest growing region at a 7.54% CAGR through 2031, driven by large population centers, mandatory source segregation rules, and national biomethane blending obligations that formalize offtake pathways for collected organics. Policy signals in China and India are strengthening alignment between collection programs and downstream gas markets, encouraging investment in digestion assets as cities build curbside or commercial pickup coverage in step with facility capacity. Japan’s progress on food waste reduction in the business sector illustrates how mandatory measurement and clear targets can guide private investment and shape supplier expectations, benefiting service providers that can deliver consistent hauling with accurate reporting. Rapid growth in megacities across Asia supports route density and favors technology-enabled fleets, which raises the likelihood that fully automated vehicles and bin sensors will move from pilots to baseline practice over the forecast period.
Europe combines mature regulation with active investment in biomethane production and composting capacity, which provides strong signals for municipalities and private haulers to expand separate collection coverage and reduce contamination. The revised Waste Framework Directive establishes food waste reduction targets and separate biowaste collection, which anchors growth in residential and commercial organics programs and positions the region to absorb collected streams in line with capacity additions. Sector data confirm a rapid buildout of biomethane plants and long-term investment commitments. However, production and capacity additions need to accelerate to meet 2030 targets, suggesting that continued policy support and certificate systems will help bridge the gap. Audits show uneven implementation across some Member States, suggesting that enforcement, landfill pricing, and cost-recovery mechanisms need to be strengthened to unlock the full potential of the organic waste collection market. These findings support focused investments in collection coverage, communications, and contamination reduction to meet legal targets and stabilize feedstock flows to digesters and compost sites.
North America mixes strong state-level mandates with federal grant support and voluntary frameworks, which yield a patchwork of program maturity across states and provinces that is moving toward broader coverage. U.S. federal funding through the Solid Waste Infrastructure for Recycling program includes allocations for organics recycling infrastructure, which reduces capital hurdles and enables cities to scale collection services with better equipment and processing contracts. Large city rollouts demonstrate operational feasibility at scale when staffing, trucks, and processing are aligned and when resident education is steady, which supports the broader case for universal curbside coverage for organics over time. Canada is adding digestion capacity in key provinces through partnerships backed by long-term gas off take, which should strengthen the market for contracted organics collection services as new sites come online. The Middle East and Africa face higher rates of mismanagement and limited recycling and composting. Still, regional strategies to diversify energy supply and reduce food waste are taking shape, opening the door to targeted projects in urban centers that can combine organic collection with digestion under supportive feed-in tariffs and clean cooking policies. South America is advancing legal frameworks that monetize biomethane and bring landfill gas and organics to market under renewable and decarbonization rules, which aligns municipal collection expansions with long-term fuel demand.

Competitive Landscape
The organic waste collection market is fragmented, with multinational haulers competing with regional specialists and technology-enabled providers that differentiate on route efficiency, contamination control, and verified diversion outcomes. As mandates expand, procurement criteria are emphasizing transparent reporting, contamination thresholds, and proof of end-market utilization, which rewards providers that can combine collection with processing partnerships or controlled capacity for digestion and compost. Vertical integration into processing, whether through ownership or long-term contracts, is a common response to tipping fee volatility, enabling operators to capture value from biomethane sales, compost products, and carbon credits associated with verifiable diversion.
Competitive differentiation is increasingly tied to digital instrumentation and data practices that improve service quality and lower costs. Municipal fleets that deploy fill-level sensors and dynamic routing have reported large reductions in route miles and fuel spend, along with improved pickup compliance and fewer resident complaints, which validates the ROI of one-person automated side loaders paired with smart containers. European cities that use federated AI models to predict bin fill levels and optimize daily routes are also seeing fewer collection kilometers and fewer service complaints, which points to scalable playbooks that can be shared across municipalities while protecting sensitive operational data. These practices align with city priorities for cost containment and resident satisfaction and will likely become normalized procurement expectations over the forecast period.
Another priority is verifiable traceability to support Extended Producer Responsibility claims and corporate disclosures. Access control for bins, RFID readers, and cloud-based recordkeeping help ensure materials come from authorized sources and reach qualified processors, improving audit readiness and supporting data-driven billing when pay-as-you-throw models are in place. On the corporate demand side, companies are linking financing terms and executive compensation to food waste reduction and packaging targets, making reliable organics collection and documentation a board-level priority that influences vendor selection and contract renewals. In Europe, policy instruments that require gas suppliers to secure biomethane certificates from 2026 are driving more feedstock into digestion pathways, favoring operators that can deliver low-contamination streams under stable contracts.
Organic Waste Collection Industry Leaders
Republic Services
Veolia
Waste Management (WM)
Waste Connections
Cleanaway
- *Disclaimer: Major Players sorted in no particular order

Recent Industry Developments
- December 2025: The European Biogas Association released its 15th Statistical Report, noting Europe’s biomethane production at 5.2 billion cubic meters in 2024 and significant private investment commitments toward 2030, with a call for stronger policy support to reach regional targets and realize long-term sector potential.
- October 2025: The European Court of Auditors published Special Report 23/2025, showing uneven progress on separate biowaste collection and cost recovery mechanisms in several Member States, which highlights implementation gaps that could hinder achievement of 2025 and 2035 targets without stronger enforcement and infrastructure.
- May 2025: The International Energy Agency’s Outlook for Biogas and Biomethane highlighted a large gap between technical potential and current production and identified policy levers such as blending mandates that are creating guaranteed markets for biomethane.
- February 2025: The United States Environmental Protection Agency, United States Department of Agriculture, and United States Food and Drug Administration published a national strategy that directs up to USD 275 million in organics recycling infrastructure grants under the Solid Waste Infrastructure for Recycling program, along with education grants and broader community funding that together elevate organics diversion as a national priority.


Global Organic Waste Collection Market Report Scope
The Organic Waste Collection Market Report is Segmented by Waste Type (Food Waste, Yard Waste, Agricultural Residues, Bio-Sludge, Others), End-User (Residential, Commercial Food Service, Manufacturing, Retail, Others), Collection Method (Door-to-Door, Drop-Off, Bulk, Others), Technology (Manual, Semi-Automated, Fully Automated), and Geography (North America, Europe, Asia-Pacific, South America, Middle East and Africa). Market Forecasts in Value USD Billion
| Food Waste (Pre and Post Consumer) |
| Yard & Landscape Waste |
| Agricultural Residues |
| Bio-Sludge & Wastewater Organics |
| Commercial Organics (Non-Food) |
| Others |
| Residential |
| Commercial Food Service |
| Food Processing & Manufacturing |
| Retail & Grocery |
| Others |
| Door-to-Door Collection |
| Centralized Drop-Off Collection |
| Bulk Collection |
| Underground Collection |
| Others |
| Manual Collection Systems |
| Semi-Automated Systems |
| Fully Automated Systems |
| Others |
| North America | United States |
| Canada | |
| Mexico | |
| Europe | United Kingdom |
| Germany | |
| France | |
| Italy | |
| Spain | |
| Russia | |
| Rest of Europe | |
| Asia-Pacific | China |
| India | |
| Japan | |
| Australia | |
| South Korea | |
| South East Asia (Singapore, Malaysia, Thailand, Indonesia, Vietnam, and Philippines) | |
| Rest of Asia-Pacific | |
| South America | Brazil |
| Argentina | |
| Rest of South America | |
| Middle East and Africa | Saudi Arabia |
| United Arab Emirates | |
| Turkey | |
| South Africa | |
| Nigeria | |
| Rest of Middle East and Africa |
| By Waste Type | Food Waste (Pre and Post Consumer) | |
| Yard & Landscape Waste | ||
| Agricultural Residues | ||
| Bio-Sludge & Wastewater Organics | ||
| Commercial Organics (Non-Food) | ||
| Others | ||
| By End-User | Residential | |
| Commercial Food Service | ||
| Food Processing & Manufacturing | ||
| Retail & Grocery | ||
| Others | ||
| By Collection Method | Door-to-Door Collection | |
| Centralized Drop-Off Collection | ||
| Bulk Collection | ||
| Underground Collection | ||
| Others | ||
| By Technology & Equipment | Manual Collection Systems | |
| Semi-Automated Systems | ||
| Fully Automated Systems | ||
| Others | ||
| By Geography | North America | United States |
| Canada | ||
| Mexico | ||
| Europe | United Kingdom | |
| Germany | ||
| France | ||
| Italy | ||
| Spain | ||
| Russia | ||
| Rest of Europe | ||
| Asia-Pacific | China | |
| India | ||
| Japan | ||
| Australia | ||
| South Korea | ||
| South East Asia (Singapore, Malaysia, Thailand, Indonesia, Vietnam, and Philippines) | ||
| Rest of Asia-Pacific | ||
| South America | Brazil | |
| Argentina | ||
| Rest of South America | ||
| Middle East and Africa | Saudi Arabia | |
| United Arab Emirates | ||
| Turkey | ||
| South Africa | ||
| Nigeria | ||
| Rest of Middle East and Africa | ||


Key Questions Answered in the Report
What is the current size and growth outlook for the organic waste collection market?
The organic waste collection market size was USD 10.56 billion in 2025 and is projected to reach USD 14.2 billion by 2031, reflecting a 5.1% CAGR during 2026-2031. This trajectory is supported by policy mandates, infrastructure funding, and technology adoption that strengthen collection economics.
Which end-user segments are expanding fastest in organics collection?
Commercial Food Service is the fastest-growing end-user, with a 6.23% CAGR through 2031, driven by concentrated waste generation in restaurants, institutions, and hospitality venues that reward dedicated pickup schedules and verified diversion.
Which collection methods lead to adoption today?
Door-to-Door Collection dominates with a 67.8% share and the highest growth rate at a 6.72% CAGR, as cities integrate organics into regular curbside services and pair universal coverage with processing contracts and steady communication.
How is automation changing the economics of organics collection?
Fully automated side-loading vehicles, bin sensors, and AI routing have reduced route miles and fuel costs while improving service reliability, supporting one-person crews, and enabling faster ROI for equipment upgrades and smart container networks.
Which regions present the strongest near-term opportunities?
Asia-Pacific holds a 33.2% share and is the fastest-growing region at a 7.54% CAGR, supported by mandatory segregation, biomethane blending obligations, and rapid urbanization that increases route density and accelerates infrastructure buildout.
What are the main barriers to scaling organic collection?
High upfront capital requirements, contamination that reduces processing efficiency, and participation gaps in source segregation are the key barriers, underscoring the importance of grants, clear bin standards, enforcement, and data-driven communications to improve yields and lower costs.
Page last updated on:


