Mobile Broadband Market Size and Share
Market Overview
| Study Period | 2019 - 2030 |
|---|---|
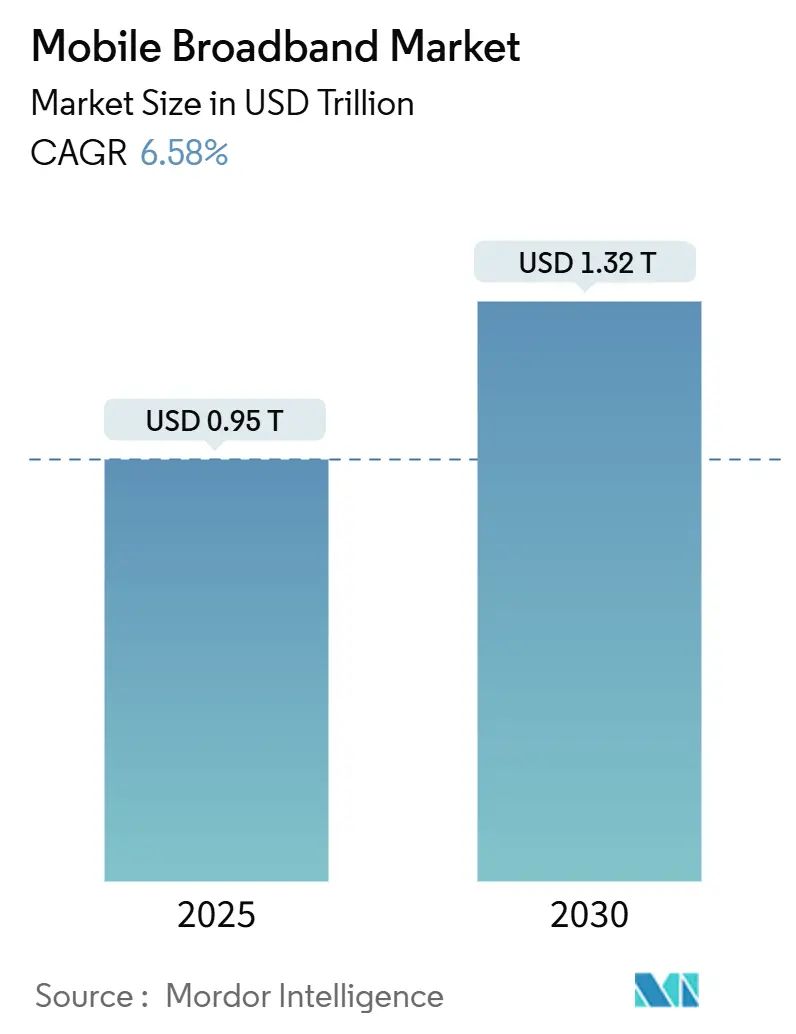
| Market Size (2025) | USD 0.95 Trillion |
| Market Size (2030) | USD 1.32 Trillion |
| Growth Rate (2025 - 2030) | 6.58% CAGR |
| Fastest Growing Market | Asia Pacific |
| Largest Market | Asia Pacific |
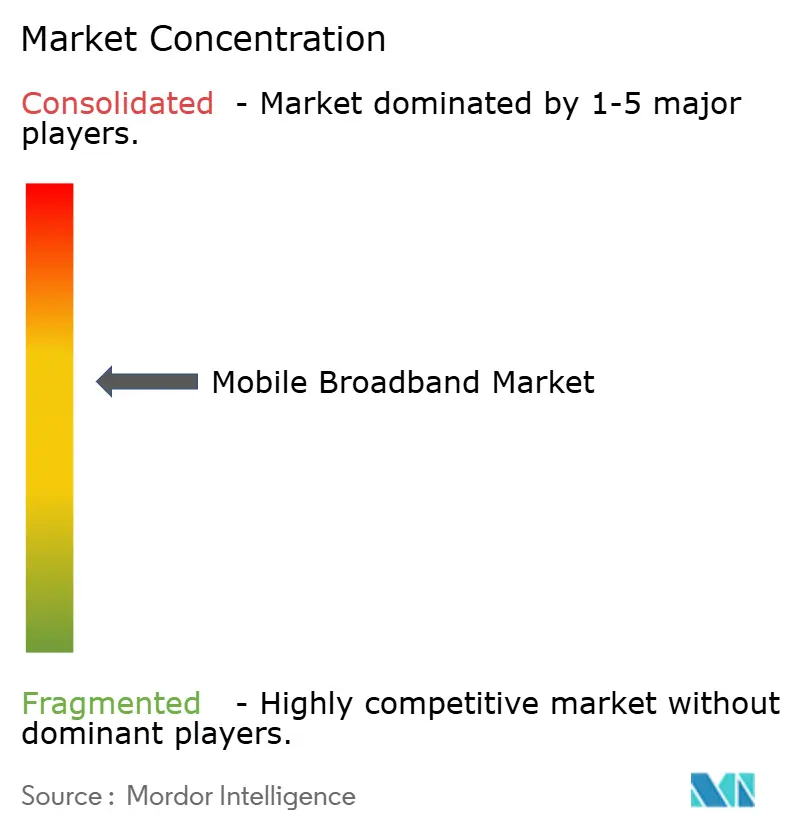
| Market Concentration | Medium |
Major Players *Disclaimer: Major Players sorted in no particular order Image © Mordor Intelligence. Reuse requires attribution under CC BY 4.0. | |
Mobile Broadband Market Analysis by Mordor Intelligence
The Mobile Broadband Market size is estimated at USD 0.95 trillion in 2025, and is expected to reach USD 1.32 trillion by 2030, at a CAGR of 6.58% during the forecast period (2025-2030). Consistent 5G standalone rollouts, escalating video traffic, and government-supported rural connectivity schemes are the key drivers of this trajectory. Intensifying spectrum auctions are reshaping operator capex allocation priorities, while edge computing and network-slicing monetization models are boosting revenue diversity. Energy-efficiency mandates in Europe and North America are driving investments in AI-enabled RAN automation, and partnerships between satellite and cellular backhaul are starting to address remote-area coverage challenges. Competitive intensity is gradually tilting toward service innovation rather than price wars, as operators bundle cloud, IoT, and private-network solutions to defend margins in mature markets.[1]Ericsson AB, “Ericsson Mobility Report November 2024,” ericsson.com
Key Report Takeaways
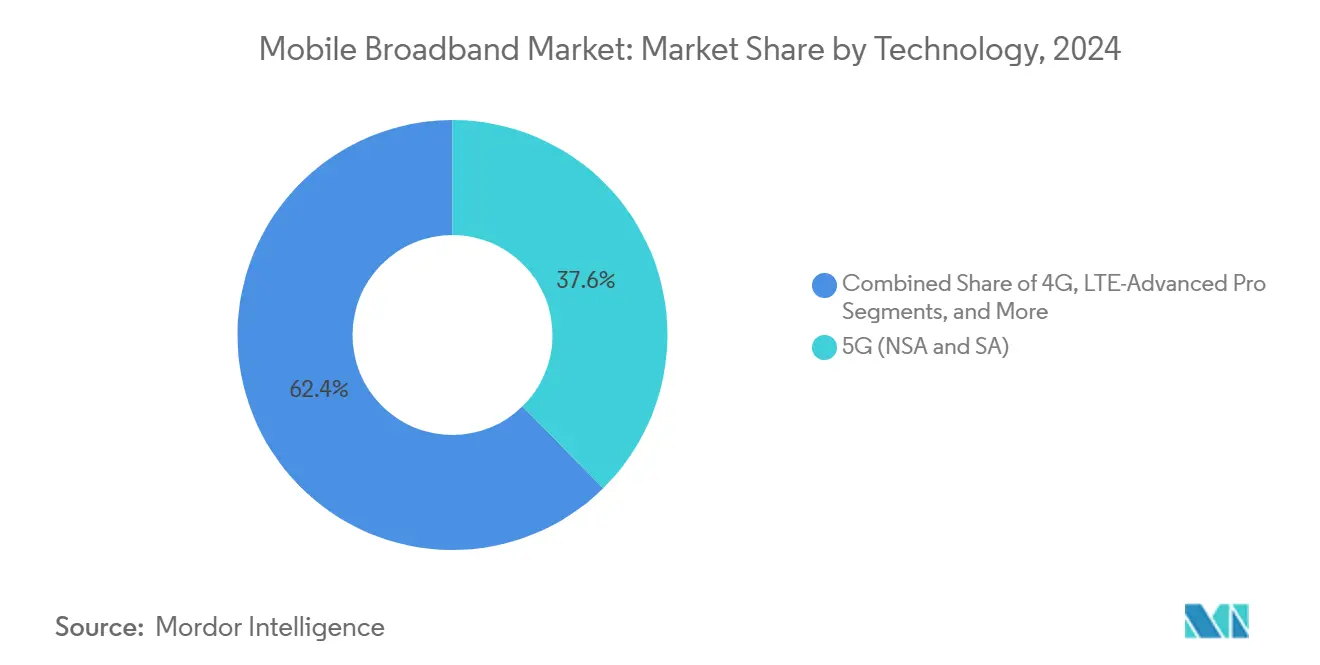
- By technology, 5G captured 37.64% of the mobile broadband market share in 2024, and it is advancing at a 15.38% CAGR through 2030.
- By service type, mobile data plans accounted for 74.55% of the mobile broadband market share in 2024, and are forecasted to grow at an 8.19% CAGR through 2030.
- By end-user, the consumer segment represented 72.91% of the mobile broadband market share in 2024, while the business/enterprise segment is projected to rise at a 10.06% CAGR through 2030.
- By application, the entertainment and media (streaming, gaming) segment accounted for 39.94% of the mobile broadband market share in 2024, while the e-commerce and retail segment is projected to grow at a 10.14% CAGR through 2030.
- By spectrum band, the 1-6 GHz (mid-band) segment captured 56.67% of the mobile broadband market share in 2024 and is projected to advance at an 8.19% CAGR through 2030.
- By geography, the Asia Pacific accounted for a 44.73% revenue share in the mobile broadband market in 2024; the region is expected to expand at a 7.47% CAGR through 2030.
Global Mobile Broadband Market Trends and Insights
Drivers Impact Analysis*
| Driver | (~) % Impact on CAGR Forecast | Geographic Relevance | Impact Timeline |
|---|---|---|---|
| Adoption of 5G Stand-Alone (SA) Core Networks | +2.1% | Global; early gains in North America, Europe, APAC | Medium term (2-4 years) |
| Explosive Growth in Video Streaming and Immersive Media Traffic | +1.8% | Global; strongest in North America and Europe | Short term (≤ 2 years) |
| Mobile Network Energy-efficiency Mandates | +0.9% | Europe and North America; spill-over to APAC | Long term (≥ 4 years) |
| Rural Fixed-Wireless Access (FWA) Subsidies | +0.7% | North America, Europe, emerging APAC | Medium term (2-4 years) |
| Satellite-cellular Convergence for Ubiquitous Back-haul | +0.5% | Global; remote and underserved regions | Long term (≥ 4 years) |
| AI-driven RAN Automation Lowering OPEX | +0.4% | APAC core; spill-over to North America and Europe | Medium term (2-4 years) |
| Source: Mordor Intelligence | |||
Adoption of 5G Stand-Alone Core Networks
The transition to 5G standalone (SA) architecture signifies a shift from network function virtualization to cloud-native implementations, enabling network slicing and edge computing. Unlike non-standalone setups that rely on 4G infrastructure, SA networks operate independently, delivering ultra-low latency of under 1 millisecond for critical applications. This advancement allows operators to monetize use cases such as autonomous vehicle communication, industrial IoT, and augmented reality. In 2024, Verizon's 5G SA deployment across 100 cities improved network efficiency by 40% and generated USD 2.3 billion in enterprise revenues. [2]Verizon Communications Inc., “Annual Report 2024,” verizon.com The 3GPP Release 17 specifications standardized network slicing protocols, enabling operators to create dedicated virtual networks while maintaining service level agreements across customer segments.
Explosive Growth in Video Streaming and Immersive Media Traffic
Streaming services now account for over 70% of peak-hour mobile data usage in major cities, driven by the rise of 4K and 8K content, as well as virtual reality applications. This surge in bandwidth demand poses a challenge to traditional network capacity planning. In 2024, Netflix reported that mobile streaming accounted for 25% of its global viewing hours, up from 15% in 2022. [3]Netflix Inc., “Annual Report 2024,” netflix.net Meanwhile, TikTok generates over 1 exabyte of mobile traffic per month. Traffic spikes, especially during live events, can increase by up to 300% of baseline consumption. To address this, operators are adopting dynamic spectrum allocation and edge caching to manage demand and maintain quality of experience.
Mobile Network Energy-Efficiency Mandates
Regulatory frameworks in Europe and North America are enforcing strict energy consumption limits on telecommunications infrastructure, driving operators to redesign networks for sustainability compliance. The European Union's Green Deal mandates a 45% reduction in energy consumption by 2030 from 2020 levels, while maintaining service quality. [4]European Commission, “European Green Deal,” europa.eu This has accelerated the adoption of AI-driven network optimization, renewable energy integration, and equipment consolidation to lower costs and carbon footprints. In 2024, Deutsche Telekom reduced energy consumption by 25% through the implementation of intelligent sleep modes for base stations during low-traffic periods, thereby aligning compliance with cost efficiency. Additionally, carbon reporting and sustainability certifications now influence licensing and spectrum allocation decisions.
Rural Fixed-Wireless Access Subsidies
Government initiatives are driving the deployment of rural broadband through fixed-wireless access (FWA) technologies, which leverage existing mobile infrastructure. In the U.S., the Rural Digital Opportunity Fund allocated USD 20.4 billion for rural connectivity, with a significant focus on 5G-based FWA solutions offering fiber-like speeds. This subsidy model enables mobile operators to expand into previously unviable markets while generating revenue from underserved communities. In 2024, T-Mobile extended its rural FWA services to 2.1 million locations, supported by federal subsidies that reduced deployment costs by 60% compared to fiber installations. These programs, requiring multi-year commitments and performance guarantees, ensure stable revenue for operators while addressing the digital divide.
Restraints Impact Analysis*
| Restraint | (~) % Impact on CAGR Forecast | Geographic Relevance | Impact Timeline |
|---|---|---|---|
| High Spectrum Acquisition and Renewal Costs | -1.4% | Global; most acute in developed markets | Short term (≤ 2 years) |
| Fiber Back-haul Bottlenecks in Emerging Markets | -0.9% | APAC emerging, Africa, Latin America | Medium term (2-4 years) |
| Geopolitical Export‐control Restrictions on 5G Equipment | -0.7% | Europe and APAC | Long term (≥ 4 years) |
| Rising Cyber-security Compliance Burden (Zero-Trust, NIS2) | -0.5% | Europe and North America | Medium term (2-4 years) |
| Source: Mordor Intelligence | |||
High Spectrum Acquisition and Renewal Costs
Spectrum auction prices have surged as operators compete for mid-band frequencies critical to 5G deployment, with some markets seeing cost increases of over 400% compared to previous cycles. Germany's 2024 5G spectrum auction generated EUR 8.2 billion, about 15% of participating operators' annual capital expenditure budgets. These high costs challenge smaller regional operators, driving market consolidation and reducing competition. From 2021 to 2024, Verizon invested USD 53 billion in spectrum, accounting for 23% of its total revenue, which highlights the financial strain on operational flexibility. Additionally, spectrum renewals often include performance obligations and coverage mandates, resulting in ongoing financial burdens that extend beyond initial acquisition costs.
Fiber Back-haul Bottlenecks in Emerging Markets
Emerging markets face significant challenges in deploying high-capacity fiber optic infrastructure due to geographic barriers, regulatory hurdles, and limited capital, resulting in connectivity gaps between mobile base stations and core networks. In rural India, only 35% of mobile tower sites are fiber-connected, resulting in a reliance on microwave and satellite backhaul, which limits 5G performance. Insufficient backhaul connectivity limits the quality and capacity of mobile broadband, with fiber installation costs exceeding USD 50,000 per kilometer in remote or mountainous areas. Additionally, inefficient right-of-way processes in many emerging markets delay fiber deployment and increase uncertainty for mobile operators.
*Our forecasts treat driver/restraint impacts as directional, not additive. The impact forecasts reflect baseline growth, mix effects, and variable interactions.
Segment Analysis
By Technology: 5G Drives Network Transformation
5G accounted for 37.64% of the mobile broadband market share in 2024, well ahead of LTE-Advanced Pro upgrades and Wi-Fi offload options. The segment is posting a robust 15.38% CAGR to 2030, signifying operators’ pivot toward ultra-low-latency service monetization. This thrust boosts the mobile broadband market as modular radios allow swap-out upgrades instead of full rip-and-replace cycles. 4G maintains relevance through LTE-Advanced carrier aggregation that extends investment life and supports mobile broadband industry roaming resiliency. Vendors such as Qualcomm now ship chipsets featuring integrated sub-6 GHz and mmWave modems, which shrink device costs and drive consumer adoption.
The migration pace remains uneven. North American and European players fast-track standalone cores, whereas price-sensitive APAC carriers invest in non-standalone overlays to preserve earlier spectrum buys. Network equipment suppliers offer software-defined radios supporting 3G through 5G in a single shelf, easing rural extension in Africa and Latin America. Edge-computing nodes co-located at cell sites strengthen content-delivery economics, which reinforces 5G’s ascendancy within the overall mobile broadband market.


By Service Type: Data Plans Dominate Revenue
Mobile data plans delivered 74.55% of 2024 earnings and are growing at 8.19% CAGR. Unlimited tiers and video-first consumption patterns underpin stickier average revenue per user, underscoring how core connectivity remains the fulcrum of the mobile broadband market size. Voice-over-LTE now rides on data pipes, trimming spectrum waste and reallocating capacity for OTT voice and gaming. Hotspot add-ons flourish among remote workers who chain laptops and IoT devices to cellular links, reinforcing data-centric revenue streams.
Operators bundle streaming allowances and cloud-storage bonuses to enhance loyalty. Verizon reported a USD 55.10 average monthly spend in 2024 after migrating customers to premium plans. Transparent throttling thresholds mandated by net-neutrality rules restrain anti-competitive prioritization, making network quality the decisive differentiation lever. As traffic metrics escalate, carriers refine AI-driven usage analytics to preempt congestion and target upsell offers, further entrenching the revenue command of data plans.
By End-User: Enterprise Acceleration Outpaces Consumer Growth
Consumers still accounted for 72.91% of revenue in 2024, but enterprises are racing ahead at a 10.06% CAGR through 2030, thereby expanding the mobile broadband market. Corporates procure dedicated slices, deterministic latency, and zero-trust security packages required for factory robotics, telemedicine, and autonomous logistics. AT&T logged USD 8.4 billion enterprise mobility earnings in 2024, a 14% jump year-on-year.
While handset saturation tempers new consumer additions, operators cross-sell subscription video, cybersecurity, and cloud gaming to lift lifetime value. Enterprise buyers, conversely, sign multi-year managed-service contracts, stabilizing cash flows and anchoring private-network partnerships. In the emerging APAC region, small-business digitization programs expand the addressable enterprise pools, elevating service-level agreement revenue as a share of the total mobile broadband market.
By Application: Entertainment Leads, E-commerce Accelerates
Entertainment and media captured 39.94% of the 2024 turnover and continue to dominate peak load patterns, validating their prime influence on network dimensioning in the mobile broadband market. Rising 4K mobile gaming adoption and social media live commerce reinforce sustained traffic growth. Amazon disclosed that 72% of its 2024 sales originated from handsets, highlighting e-commerce’s 10.14% CAGR leadership.
Social platforms merge messaging, shopping, and short-video streaming, generating compound data bursts per user session. Healthcare and education apps experienced pandemic-era momentum that is now institutionalized through insurance-reimbursed telehealth and hybrid learning mandates, expanding the mobile broadband industry's use-case canvas. Operators respond with hierarchical quality-of-service tiers to balance latency-sensitive video consults against bulk file downloads.

By Spectrum Band: Mid-Band Dominance Continues
Mid-band (1-6 GHz) accounted for 56.67% of 2024 traffic value and is expected to rise at an 8.19% CAGR, confirming its optimal capacity-coverage balance. The segment anchors most urban 5G projects, powering consumer broadband and enterprise slices. Low-band sub-1 GHz remains critical for rural propagation and indoor penetration, enabling operators to fulfill their universal-service obligations. High-band mmWave, though limited in coverage, underpins arena-grade multi-gigabit offerings and enterprise campus hotspots, complementing the broader mobile broadband market.
C-band clearances in the United States will allow carriers to double their mid-band holdings in 2024, unlocking contiguous 100 MHz channels for nationwide deployment. International Telecommunication Union harmonization reduces device costs through scale economies, and dynamic spectrum-sharing software enables 5G to utilize underutilized 4G blocks during off-peak windows, thereby amplifying spectral efficiency.
Geography Analysis
The Asia Pacific region held 44.73% of the global revenue in 2024, representing the largest regional share of the mobile broadband market. China has fielded 3.2 million 5G base stations and surpassed 700 million 5G subscribers, maintaining its leadership in traffic volume. India’s UPI mobile payment ecosystem has crossed 100 billion annual transactions, showcasing the centrality of smartphones in daily commerce. Government mandates for rural coverage subsidies in India and Indonesia expand addressable customer bases, while Japan and South Korea channel R&D expenditures into 6G pilots, underscoring the APAC’s innovation momentum.
North America ranks second in value, driven by a high average revenue per user and early 5G standalone rollouts. Federal rural-broadband grants accelerate fixed-wireless access to low-density communities, expanding the mobile broadband market size at the national level. Enterprise adoption drives private-network deals in manufacturing and healthcare, while spectrum repacking from legacy microwave to fiber backhaul enhances urban throughput.
Europe’s strategic lens centers on sustainability compliance and cross-border roaming optimization under the Digital Decade agenda. Energy-efficiency targets shape RAN upgrade cycles, and coordinated auctions facilitate the acquisition of contiguous blocks for low-latency services. The Middle East and Africa present high-growth potential, as mobile remains the primary means of access. Regulatory reforms around infrastructure sharing and tower sale-leaseback deals unlock capital for coverage expansion. Latin America witnesses escalating 5G license awards, yet fiber backhaul lags restrict realized speeds, making microwave and satellite bridging indispensable in the near term.
Mordor Intelligence provides coverage of the mobile broadband market across other key regional markets, including North America, Middle East, South America, Africa, Europe, and Asia, each with their regulatory frameworks and demand patterns.


Competitive Landscape
Incumbent operators wield scale in spectrum portfolios, back-haul, and subscriber bases, yielding natural entry barriers. Verizon, AT&T, China Mobile, and Vodafone command extensive mid-band holdings and pursue edge-cloud alliances with hyperscalers to co-create low-latency applications. T-Mobile’s early 600 MHz roll-out has granted coverage advantages that are now being repurposed for nationwide standalone service.
Strategic direction shifts from price discounting toward differentiated service bundles, such as cloud storage, cybersecurity, and XR content passes, aimed at elevating the average revenue per user. RAN automation projects lower opex, freeing funds for incremental spectrum purchases. Rural fixed-wireless access remains an under-penetrated pocket where capital-light expansion can yield first-mover advantages.
Vendor ecosystems are equally dynamic. Ericsson and Nokia integrate AI orchestration into radios, while Qualcomm’s new chipset generation supports tri-band 5G to shrink handset bill-of-materials. Satellite entrants, such as Starlink and OneWeb, partner with mobile operators for hybrid backhaul, pressuring terrestrial incumbents to accelerate rural fiber deployment. Private-network integrators carve specialist niches for campus deployments, particularly in manufacturing and logistics corridors, adding competitive nuance to the global mobile broadband market.
Mobile Broadband Industry Leaders
Verizon Communications Inc.
AT&T Inc.
Vodafone Group Plc
China Mobile Limited
T-Mobile US, Inc.
- *Disclaimer: Major Players sorted in no particular order

Recent Industry Developments
- October 2025: AT&T completed nationwide 5G standalone activation; Verizon nears final rollout, and T-Mobile prepares to sunset 4G spectrum for refarming.
- June 2025: Vodafone finalized its merger with Three UK, creating Britain’s largest mobile operator valued at more than USD 35 billion, targeting capex synergies and accelerated 5G coverage.


Global Mobile Broadband Market Report Scope
The mobile broadband market encompasses the provision of high-speed internet services via mobile networks, including 4G, LTE, and 5G technologies. It covers both urban and rural areas, with a focus on improving connectivity and data speeds for a growing base of mobile users. The market scope includes service providers, infrastructure developers, device manufacturers, and technology enablers, all contributing to the expansion of mobile broadband access globally.
The Mobile Broadband Market is segmented by technology (4G, 5G, LTE, wi-fi, and other technology), service type (mobile data, voice over LTE (VoLTE), mobile hotspot), end-user (individual consumers, businesses/enterprises, government and public sector), application (entertainment and media (streaming, gaming), e-commerce and retail, social media and communication, healthcare and education, and other applications), and geography (North America, Europe, Asia Pacific, Latin America, Middle East and Africa). The market sizes and forecasts are provided in terms of value (USD) for all the above segments.
| 4G |
| 5G (NSA and SA) |
| LTE-Advanced Pro |
| Wi-Fi |
| Other Technologies (NB-IoT, LoRaWAN, etc.) |
| Mobile Data Plans |
| Voice-over-LTE (VoLTE) |
| Mobile Hotspot / Tethering |
| Consumers |
| Businesses/Enterprises |
| Entertainment and Media (Streaming, Gaming) |
| E-commerce and Retail |
| Social Media and Communication |
| Healthcare and Education |
| Other Applications |
| Sub-1 GHz (Coverage bands) |
| 1–6 GHz (Mid-band) |
| >6 GHz mmWave and Terahertz |
| North America | United States |
| Canada | |
| Mexico | |
| South America | Brazil |
| Argentina | |
| Chile | |
| Rest of South America | |
| Europe | Germany |
| United Kingdom | |
| France | |
| Italy | |
| Spain | |
| Russia | |
| Rest of Europe | |
| Asia Pacific | China |
| India | |
| Japan | |
| South Korea | |
| Australia and New Zealand | |
| Rest of Asia Pacific | |
| Middle East and Africa | Saudi Arabia |
| United Arab Emirates | |
| Turkey | |
| South Africa | |
| Nigeria | |
| Rest of Middle East and Africa |
| By Technology | 4G | |
| 5G (NSA and SA) | ||
| LTE-Advanced Pro | ||
| Wi-Fi | ||
| Other Technologies (NB-IoT, LoRaWAN, etc.) | ||
| By Service Type | Mobile Data Plans | |
| Voice-over-LTE (VoLTE) | ||
| Mobile Hotspot / Tethering | ||
| By End-User | Consumers | |
| Businesses/Enterprises | ||
| By Application | Entertainment and Media (Streaming, Gaming) | |
| E-commerce and Retail | ||
| Social Media and Communication | ||
| Healthcare and Education | ||
| Other Applications | ||
| By Spectrum Band | Sub-1 GHz (Coverage bands) | |
| 1–6 GHz (Mid-band) | ||
| >6 GHz mmWave and Terahertz | ||
| By Geography | North America | United States |
| Canada | ||
| Mexico | ||
| South America | Brazil | |
| Argentina | ||
| Chile | ||
| Rest of South America | ||
| Europe | Germany | |
| United Kingdom | ||
| France | ||
| Italy | ||
| Spain | ||
| Russia | ||
| Rest of Europe | ||
| Asia Pacific | China | |
| India | ||
| Japan | ||
| South Korea | ||
| Australia and New Zealand | ||
| Rest of Asia Pacific | ||
| Middle East and Africa | Saudi Arabia | |
| United Arab Emirates | ||
| Turkey | ||
| South Africa | ||
| Nigeria | ||
| Rest of Middle East and Africa | ||


Key Questions Answered in the Report
What is the current value of the mobile broadband market?
It is valued at USD 0.95 trillion in 2025.
How fast is the market expected to grow?
The sector is projected to expand at a 6.58% CAGR through 2030.
Which region holds the largest revenue share?
Asia Pacific leads with 44.73% in 2024 and continues to outpace other regions.
Why are operators focusing on mid-band spectrum?
Mid-band offers the best coverage-capacity balance, holding 56.67% market share in 2024.
What is driving enterprise demand for mobile broadband?
Corporate digitization and the need for secure, low-latency connectivity are lifting enterprise segment CAGR to 10.06%.
How are high spectrum costs affecting operators?
Elevated auction prices consume capital budgets, potentially delaying network expansion in cost-sensitive markets.
Page last updated on:


