Network Slicing Market Size and Share
Market Overview
| Study Period | 2020 - 2031 |
|---|---|
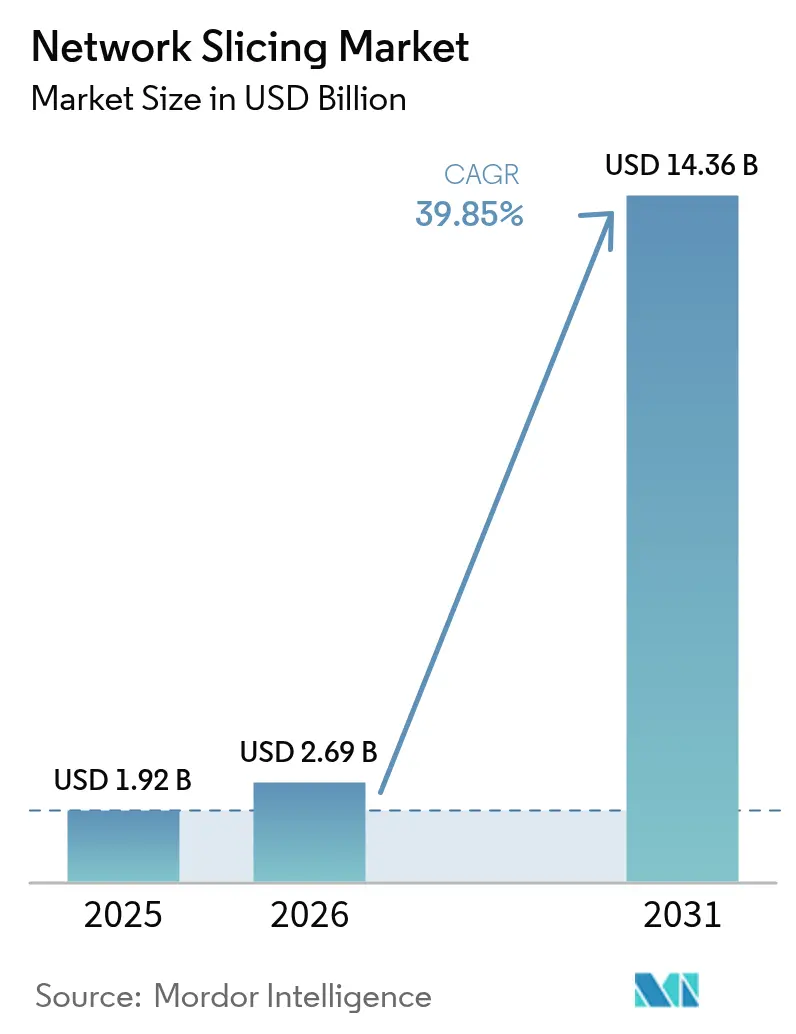
| Market Size (2026) | USD 2.69 Billion |
| Market Size (2031) | USD 14.36 Billion |
| Growth Rate (2026 - 2031) | 39.85% CAGR |
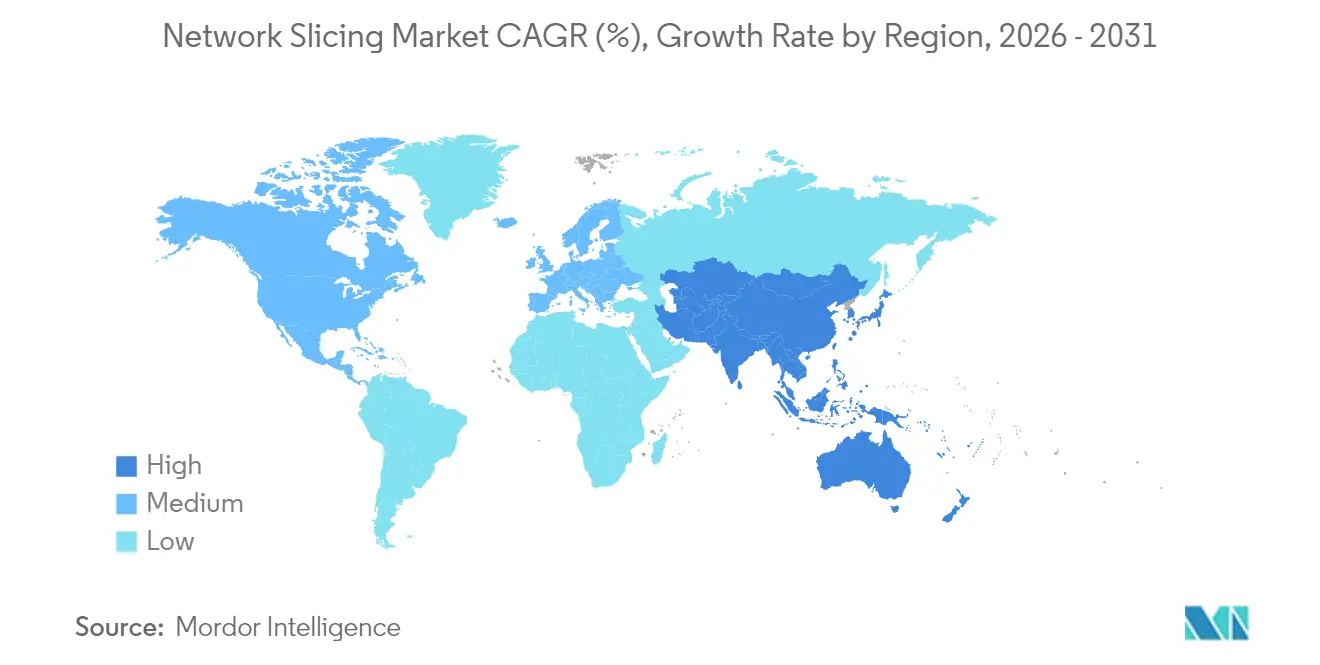
| Fastest Growing Market | Asia Pacific |
| Largest Market | North America |
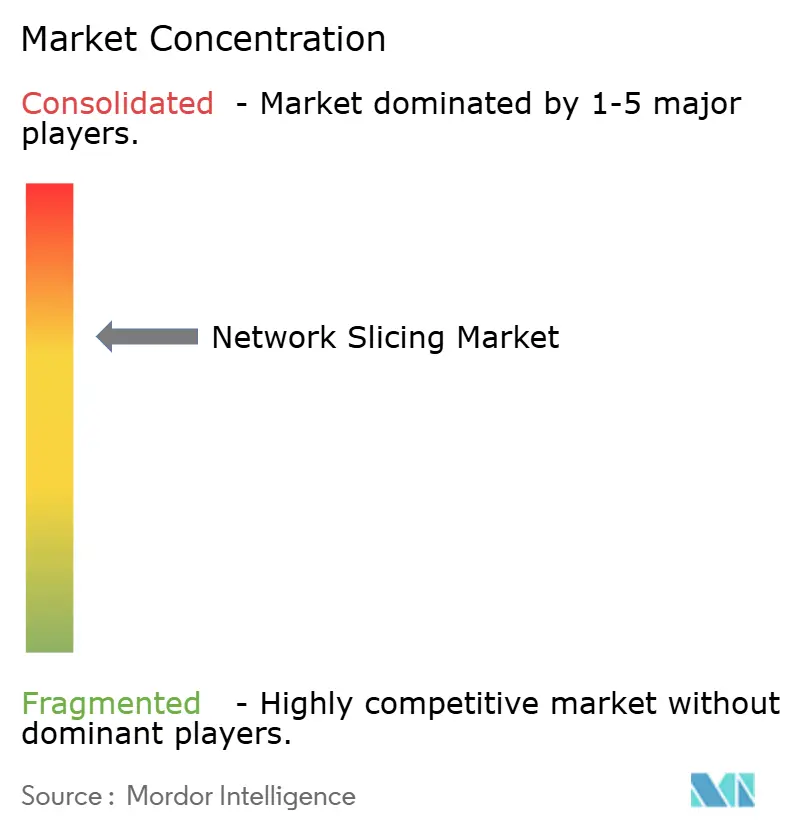
| Market Concentration | Medium |
Major Players *Disclaimer: Major Players sorted in no particular order Image © Mordor Intelligence. Reuse requires attribution under CC BY 4.0. | |
Network Slicing Market Analysis by Mordor Intelligence
The Network Slicing market size is expected to grow from USD 1.92 billion in 2025 to USD 2.69 billion in 2026 and is forecast to reach USD 14.36 billion by 2031 at 39.85% CAGR over 2026-2031.
The shift from best-effort connections to programmable, service-differentiated networks is the prime catalyst, enabling communication service providers (CSPs) to monetize 5G standalone (SA) investments through virtual network segments with guaranteed service levels. Rapid 5G SA roll-outs, the need for ultra-reliable low-latency communication (URLLC) in Industry 4.0 plants, and the appeal of slice-as-a-service models are accelerating adoption. Competitive intensity is rising as infrastructure vendors, cloud-native software specialists, and hyperscalers race to deliver orchestration platforms that automate slice life-cycle management. Supply-chain constraints persist, notably 56-week semiconductor lead times, yet operators continue to prioritize software investments to capture developer-led revenue streams through network-as-code APIs.
Key Report Takeaways
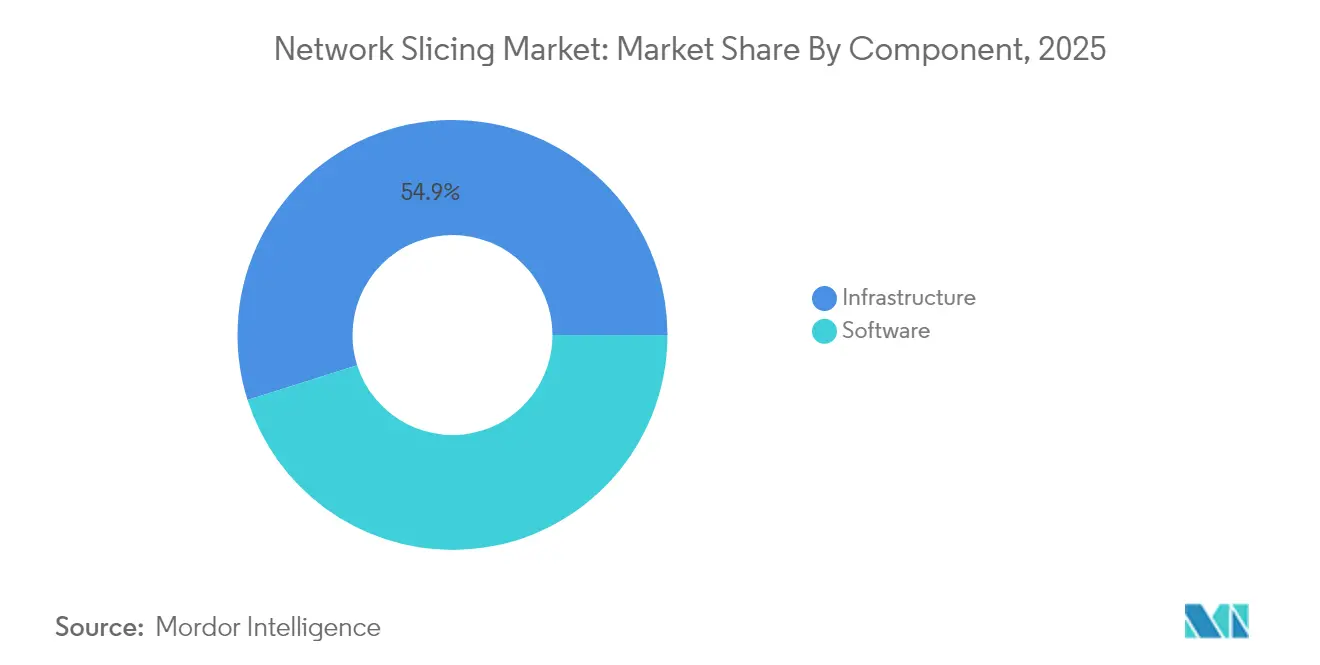
- By component, software captured 45.12% of the network slicing market share in 2025; infrastructure software is advancing at a 42.9% CAGR through 2031.
- By service model, managed services commanded a 54.68% share of the network slicing market size in 2025, while network-as-a-service exhibits a 41.3% CAGR to 2031.
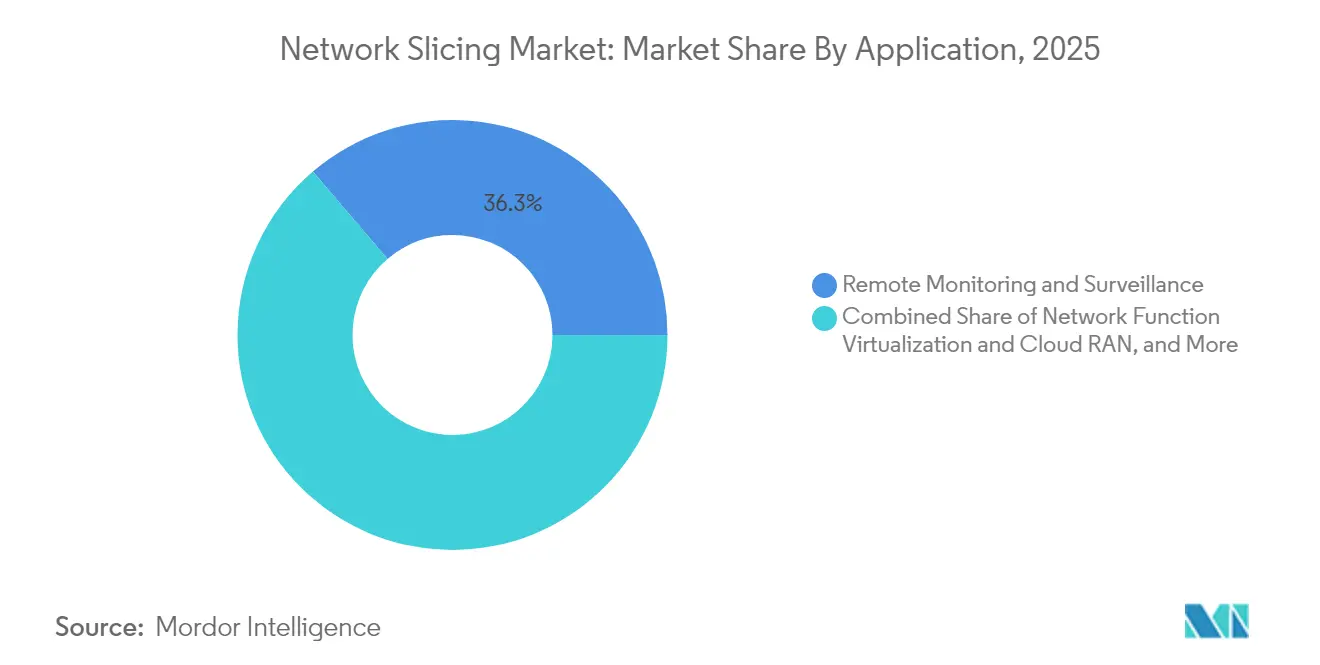
- By application, remote monitoring held 36.25% of the network slicing market in 2025; mobile cloud gaming is projected to grow at a 43.1% CAGR through 2031.
- By end-user industry, automotive & transportation led with 27.85% of network slicing market share in 2025; media & entertainment is expanding at a 41.95% CAGR through 2031.
- By geography, North America accounted for 34.30% of the network slicing market in 2025, whereas Asia Pacific is forecast to post a 41.1% CAGR over 2026-2031.
Note: Market size and forecast figures in this report are generated using Mordor Intelligence’s proprietary estimation framework, updated with the latest available data and insights as of 2026.
Global Network Slicing Market Trends and Insights
Drivers Impact Analysis*
| Driver | (~) % Impact on CAGR Forecast | Geographic Relevance | Impact Timeline |
|---|---|---|---|
| 5G SA roll-outs accelerating CSP demand shift | +12.5% | Global, with North America and China leading | Medium term (2-4 years) |
| Enterprise private-network demand for URLLC & eMBB slices | +10.2% | North America & EU, expanding to APAC | Short term (≤ 2 years) |
| Edge-cloud convergence enabling dynamic slice orchestration | +8.7% | Global, concentrated in urban markets | Medium term (2-4 years) |
| CSP monetization urgency amid ARPU stagnation | +6.8% | Global, particularly acute in mature markets | Short term (≤ 2 years) |
| Network-as-Code APIs catalysing developer-led slice uptake | +5.3% | North America & EU initially, global expansion | Long term (≥ 4 years) |
| Rights-based remote broadcasting packages | +3.2% | Global, event-driven deployment | Short term (≤ 2 years) |
| Source: Mordor Intelligence | |||
5G SA Roll-Outs Accelerating CSP Demand Shift
Standalone 5G architecture unlocks full network slicing capabilities, letting operators spin up isolated logical networks with guaranteed service levels that legacy cores cannot provide. Japan reached 98% 5G base-station coverage in designated areas by April 2024, spurring SA upgrades and signaling a global pivot toward slicing-ready infrastructure. Ericsson’s alliance with 12 tier-one operators targets a USD 30 billion network-API market by 2030, relying on slicing as the foundation for programmability[1]Akanksha Paliwal, “Telecom operators, vendors eye USD 30 billion network API opportunity,” reuters.com. T-Mobile’s hybrid private-5G-plus-slicing deployment for emergency medical data shows how differentiated connectivity can be commercialized quickly.
Enterprise Private-Network Demand for URLLC & eMBB Slices
Industrial companies view slicing as the most economical route to deterministic connectivity. In Italy, Ericsson, TIM, and Comau synchronized robots with digital twins using sub-10 ms slices, proving operational gains in predictive maintenance and remote AR support. South Korea allocated private 5G spectrum to 56 sites by February 2024, illustrating regulator support for enterprise-run infrastructure that relies on slice isolation.
Edge-Cloud Convergence Enabling Dynamic Slice Orchestration
AI-driven orchestration platforms now instantiate slices on demand, optimizing radio, transport, and core resources. VMware’s Telco Cloud Automation exemplifies 3GPP-compliant management that merges edge clusters with central clouds. Research shows deep-reinforcement learning cuts end-to-end latency by 25%, hinting at predictive slice management in dense deployments. Malaysia’s first 5G live sports broadcast leveraged an edge-enabled slice to secure bandwidth and sub-25 ms latency for real-time production.
CSP Monetization Urgency Amid ARPU Stagnation
As voice and data commoditize, CSPs treat slicing as a premium upsell path. Asia-Pacific 5G revenue is projected to surpass USD 130 billion by 2030, a milestone reachable only if operators commercialize differentiated latency tiers and network APIs. Verizon’s Frontline Network Slice for public safety, launched in 2025, demonstrates a willingness to pay for dedicated resources[2]Mike Dano, “Verizon turns on Frontline network slice in LA, Chicago,” lightreading.com. Singtel extended consumer slices with enhanced security to 1.5 million subscribers in 2024, proving mass-market addressability.
Restraints Impact Analysis*
| Restraint | (~) % Impact on CAGR Forecast | Geographic Relevance | Impact Timeline |
|---|---|---|---|
| Low 5G penetration & device readiness in emerging economies | -8.4% | APAC emerging markets, MEA, Latin America | Medium term (2-4 years) |
| Multi-domain orchestration complexity, OPEX burden | -6.7% | Global, particularly affecting smaller operators | Short term (≤ 2 years) |
| Fragmented slice-SLA security certification standards | -4.2% | Global, with regional variations | Long term (≥ 4 years) |
| Regulatory uncertainty over spectrum-sharing for dynamic slices | -3.8% | EU, North America regulatory jurisdictions | Medium term (2-4 years) |
| Source: Mordor Intelligence | |||
Low 5G Penetration and Device Readiness in Emerging Economies
Network slicing demands widespread SA coverage plus handsets able to select slices, yet Europe had only 2% SA coverage versus China’s 80% at end-2024. Delays in Indonesia’s 5G auctions illustrate how policy gaps can slow roll-outs, reducing operator incentive to invest in slice platforms.
Multi-Domain Orchestration Complexity and OPEX Burden
Only 15% of operators have an operational slicing platform because cross-vendor integration drives OPEX 30-50% higher than legacy management. Smaller carriers face capex pressure to modernize OSS/BSS stacks with open APIs, prompting a tilt toward managed-service partners able to shoulder orchestration workload.
*Our forecasts treat driver/restraint impacts as directional, not additive. The impact forecasts reflect baseline growth, mix effects, and variable interactions.
Segment Analysis
By Component: Software Dominance Drives Automation
Software held a 45.12% share of the network slicing market in 2025 and is growing at a 42.9% CAGR, thanks to operator focus on orchestration, assurance, and security tooling. The network slicing market size derived from software platforms is projected to exceed USD 6.55 billion by 2031 alongside radio-agnostic control logic. Vendors differentiate through intent-based policy engines that adjust slice bandwidth in real time. Security modules that isolate tenant traffic and validate slice integrity are now baked into catalogues rather than sold as add-ons, lowering time to market and supporting multitenant monetization. Infrastructure hardware remains essential for 5G SA cores, yet its growth lags as CSPs sweat existing RAN assets while directing new funds to automated slice management. Transport upgrades continue, spurred by the need to guarantee deterministic latency across microwave, fiber, and IP/MPLS links.
Operators evaluating total cost of ownership favor disaggregated infrastructure with open interfaces, allowing cloud-native network functions to reside on commodity servers. This pivot moderates capex peaks and accelerates software uptake, reinforcing the central role of automation in the network slicing market. Multi-access edge computing (MEC) nodes embedded in metro data centers further extend software’s reach, enabling localized slice instantiation for latency-sensitive workloads.


By Service: Managed Services Lead Enterprise Adoption
Managed services controlled 54.68% of the network slicing market share in 2025 and should post a 41.3% CAGR, reflecting enterprise preference for turnkey slice-as-a-service offerings. Vendor-operated portals now let IT managers request slices on demand, set quality-of-service tiers, and receive usage-based billing. The network slicing market size tied to managed services will likely surpass USD 7.75 billion by 2031 as CSPs bundle security and edge compute with connectivity. Network-as-a-service (NaaS) variants appeal to mid-market firms lacking in-house spectrum expertise, while government agencies adopt managed slices for public-safety footage, benefiting from sovereign data-hosting guarantees.
Professional services, including consulting, integration, and testing, serve as on-ramps for complex adoption cycles. Systems integrators align slice orchestration with enterprise SD-WAN, ERP, and IoT platforms, de-risking deployment. Proof-of-concept labs validate throughput and latency targets before commercial cut-over, reducing uncertainty for mission-critical use cases such as surgical robotics or real-time quality inspection.
By Application: Gaming Disrupts Traditional Monitoring Leadership
Remote monitoring maintained a 36.25% share of the network slicing market in 2025, driven by smart-factory cameras and utility-grid sensors that need deterministic uplink capacity. Isolated slices keep telemetry flowing even during network congestion, avoiding production halts. Meanwhile, mobile cloud gaming is rising at a 43.1% CAGR; enthusiasts demand 60 fps gameplay at 1080p with sub-50 ms round-trip latency, conditions that slices guarantee. During BT trials, players on Nvidia GeForce NOW sustained 25 Mbps with no visible jitter, validating consumer-grade slice viability.
Network function virtualization and cloud RAN orchestration also harness slices to segment test-beds from live traffic, trimming new-service roll-out cycles. Industrial automation continues to push deterministic latency boundaries, justifying premium slice tiers that map to robotic safety protocols and time-sensitive networking frameworks.
By End-User Industry: Media & Entertainment Accelerates Past Automotive
Automotive and transportation led with 27.85% of network slicing market share in 2025 as carmakers integrated vehicle-to-everything (V2X) modules requiring URLLC slices for collision avoidance. Fleet operators exploit enhanced mobile broadband slices to stream predictive maintenance data, cutting downtime across logistics corridors. Conversely, media & entertainment is forecast to grow 41.95% annually through 2031, overtaking automotive in slice spending. Private SA networks at stadiums already carry 4K wireless camera feeds, eliminating cable runs and enabling agile production. Ericsson and RTL Deutschland achieved 500 Mbps uplink with less than 25 ms latency during the 2024 European Football Championship, proving live event economics.
Healthcare adopts slices for telesurgery and ambulance telemetry, while power utilities secure grid-automation traffic against cyber threats via isolated VPN overlays. Aviation authorities test slices for baggage tracking and augmented reality wayfinding, foreshadowing broader airport digitization.
Geography Analysis
North America held a 34.30% share of the network slicing market in 2025, anchored by early 5G SA launches and permissive spectrum policies. CSPs such as T-Mobile expose slice order APIs nationwide, letting enterprises stitch private coverage into public footprints. Verizon’s Frontline Network Slice caters to first responders in Los Angeles and Chicago, generating incremental revenue via premium SLA tiers. Venture capital flows into orchestration start-ups, reinforcing an innovation loop that favors cloud-native design. Semiconductor shortages have lengthened radio unit lead times to 56 weeks, yet operators remain on schedule thanks to multi-vendor sourcing.
Asia Pacific is projected to deliver a 41.1% CAGR, the fastest regional pace, as China surpasses 2.28 million 5G sites and regulators expedite enterprise slice pilots. Japan’s Ministry of Internal Affairs and Communications issues local 5 G licenses that let factories self-deploy SA networks; 72 demonstration projects now span smart ports, logistics hubs, and stadiums. South Korea allocates dedicated spectrum to 35 conglomerates, stimulating a supplier ecosystem around slice-aware devices and RAN automation.
Europe lags on SA coverage at 2%, constraining near-term slice revenues, yet policy is shifting. Seven nations opened the 26 GHz band for local 5G, and six permit up to 100 MHz in the 3.4-3.8 GHz band, enabling campus networks for manufacturing and research. The USD 20.28 billion Vodafone-Three UK merger pledges USD 14.86 billion in network upgrades by 2035, which should accelerate SA and slicing adoption. In the Middle East, European vendors pilot transport-network slicing with regional operators, validating architectures that may backfill Europe once spectrum and investment converge.

Regulatory Landscape
Network slicing regulation is taking shape around how differentiated, SLA-backed connectivity fits with open internet and net neutrality principles, especially the boundary between internet access services and specialized services. In June 2026, BEREC approved draft Further Guidance on 5G Network Slicing (BoR (26) 84) for public consultation, adding emphasis on transparency and non-discrimination expectations for slices offered by European operators.
Standard-setting and cross-border alignment also continue through intergovernmental processes and EU policy consolidation. ITU-T approved Recommendations Y.3168 and Y.3189 in December 2025, extending formal guidance for digital-twin-enabled network slicing and satellite-terrestrial slicing integration, while the European Commission proposed a Digital Networks Act in 2026 to simplify and consolidate connectivity rules that intersect with slice commercialization across member states.
Value Chain Analysis
The network slicing value chain begins with standards and templates that codify slice attributes and life-cycle controls, then moves through RAN, transport, and 5G SA core enablement, before reaching orchestration and assurance software and, ultimately, managed-service delivery by CSPs and partners. 3GPP SA5 slice management specifications, including TS 28.541, and the GSMA Generic Slice Template (GST) define the shared language for service level specifications, while core functions such as the Network Slice Selection Function (NSSF) and exposure capabilities via Network Exposure Function (NEF) link slice intent to provisioning and network-as-code APIs.
Execution is shaped by multi-vendor integration and cloud infrastructure that can host cloud-native network functions and automate policy across domains. Recent collaborations show vendors moving deeper into orchestration and automation layers, including Nokia integrating intent-based, agentic AI slicing with Amazon Bedrock (demonstrated with du and Orange in February 2026), and BT expanding its partnership with Ericsson in March 2026 to introduce NSSF and NEF for dynamic, application-aware slicing in the UK. End-to-end orchestration across RAN, transport, and core remains a practical bottleneck, and the resulting operational complexity continues to push smaller operators toward managed services for slice life-cycle management.
Competitive Landscape
Competition is moderately fragmented. Ericsson tops the Frost Radar for 5G infrastructure four years running and supplies end-to-end slicing from RAN to core, giving it an incumbency edge when CSPs pursue single-vendor accountability. Nokia controls roughly 55% of private-wireless contracts, positioning it to convert existing LTE campuses to 5G SA slices with minimal disruption. Samsung, Apple, and Qualcomm file slice-selection patents, embedding control logic into devices and expanding influence beyond modems.
Strategic alliances remake market boundaries. Ericsson’s 2024 joint venture with 12 global operators bundles network APIs, targeting USD 30 billion in revenue by 2030 and lowering entry barriers for software developers. Cloud hyperscalers partner with telcos to host 5G cores on distributed compute fabrics, offering latency guarantees through integrated slice orchestration. AI-native start-ups focus on intent-based engines that predict congestion and pre-allocate spectrum, achieving 25% latency gains in field tests. Over time, vendors that deliver multivendor automation and open APIs are likely to capture an outsized share as enterprises demand frictionless provisioning.
Network Slicing Industry Leaders
Ericsson Inc.
Huawei Technologies Co. Ltd
Cisco Systems Inc.
BT Group PLC
NTT DOCOMO Inc.
- *Disclaimer: Major Players sorted in no particular order

Market Opportunities and Future Outlook
Commercial whitespace is emerging where operators can turn 5G SA coverage into site-specific, SLA-backed offerings that combine connectivity with orchestration, security, and exposure APIs. Vodafone Business launched 5G+ Local Slicing in the UK in April 2026, packaging dedicated performance for enterprise sites such as stadiums, logistics hubs, and campuses, and illustrating how slicing trials can translate into repeatable service catalogs. In the Middle East, e& deployed commercial 5G network slicing for enterprise customers in the UAE in May 2025, which supports near-term demand for slice-as-a-service tied to managed services and edge compute.
Monetization roadmaps are also narrowing as standards progress from baseline slicing toward 5G-Advanced capabilities that strengthen admission control and automation. 3GPP Release 19 work is underway, and ETSI TS 129.536 (Network Slice Admission Control) reached version 19.3.0 by February 2026, enabling more deterministic onboarding and policy enforcement for high-consequence use cases. Validation is broadening beyond enterprise-only deployments, with Ericsson, China Mobile, and OPPO completing differentiated-connectivity field verification for consumer-oriented slicing on a live 5G SA network in May 2026, while US Department of Homeland Security activity on resilient communications for first responders is pointing to public-sector exploration (March 2026).
Recent Industry Developments
- July 2026: Nokia and Taiwan Mobile signed a 5G expansion agreement focused on AI-driven network management that supports the introduction of network slicing capabilities. The agreement strengthens the operator-vendor pathway for bringing intent-based automation into commercial slice operations and reduces integration friction across network domains.
- June 2025: Verizon launched its Frontline Network Slice for public safety in Los Angeles and Chicago. The launch operationalized premium, SLA-backed connectivity for first responders, reinforcing a monetization template that links slicing to mission-critical service assurance.
- October 2024: Singtel extended 5G SA slicing to 1.5 million consumers via its 5G+ service. This expansion moved slicing beyond pilots into mass-market usage, highlighting how device readiness, OSS integration, and product packaging support scaling consumer-grade differentiated connectivity.


Research Methodology Framework and Report Scope
Market Definition and Coverage
This market covers revenues earned from delivering 5G network slices that are provisioned end to end across RAN, core, and transport, and are sold with defined performance and SLA outcomes to enterprises and service-provider customers.
Scope exclusions: It excludes legacy 2G/3G managed services, private campus Wi-Fi, and hardware sold for non-slice-aware 5G deployments.
Segmentation Overview
- By Component
- Infrastructure (RAN, Core, Transport)
- Software (MANO, Analytics, Security)
- By Service
- Professional (Consulting, Integration, Testing)
- Managed (Network-as-a-Service, Slice-as-a-Service)
- By Application
- Remote Monitoring and Surveillance
- Network Function Virtualization and Cloud RAN
- Mobile Cloud Gaming and Media Streaming
- Remote Industrial Automation (IIoT)
- By End-User Industry
- Healthcare
- Automotive and Transportation
- Power and Energy
- Aviation and Aerospace
- Media and Entertainment
- By Geography
- North America
- United States
- Canada
- Mexico
- Europe
- United Kingdom
- Germany
- France
- Spain
- Rest of Europe
- Asia-Pacific
- China
- Japan
- India
- South Korea
- Rest of Asia-Pacific
- Middle East and Africa
- United Arab Emirates
- Saudi Arabia
- South Africa
- Rest of Middle East and Africa
- South America
- Brazil
- Argentina
- Rest of South America
- North America
Data Sources, Market Sizing, and Validation
Desk Research
Desk research was used to set the factual base for the model, and then to sanity-check that our assumptions stayed aligned with the pace of 5G Standalone rollouts and slicing readiness. We relied on public datasets and standards sources such as ITU indicators, the GSMA library, 3GPP releases, and regulator publications like the FCC and the European Commission, which helped confirm timelines, coverage expansion, and policy direction.
We also reviewed operator and supplier disclosures through annual reports, earnings decks, and product notes, along with reputable press coverage on commercial slicing launches and partnerships. Where it helped clarify company positioning and revenue exposure, paid subscriptions for company financials and intelligence, news and financials, and patent databases were used to validate timelines and key capability areas. The desk sources mentioned here are illustrative only, since many other public and paid references were also used for data collection, validation, and clarification.
Primary Interviews and Surveys
Primary work focused on confirming what is being monetized as a slice (and what is still in trial), and on checking pricing logic, adoption pace, and procurement triggers across telecom operators, system integrators, and enterprise network teams. We also used calls to validate regional rollout differences and the split between standalone slicing, managed slice offers, and adjacent 5G core enablement that can be mistakenly counted as slicing revenue.
Distribution of primary research fieldwork respondents
| Company type | Respondent position | Region |
|---|---|---|
| Top tier: 27% | CXOs: 18% | APAC: 45% |
| Mid tier: 53% | Functional/Unit leaders: 29% | EMEA: 31% |
| Smaller Players: 20% | Managers: 53% | Americas: 24% |
Market-Sizing & Forecasting
The sizing model starts with a top-down build where 5G Standalone readiness, commercial slicing launches, and slice-capable domain coverage are used to reconstruct the addressable revenue pool by region. From there, expected monetization is applied using inputs such as the number of slicing deployments moving from pilot to paid, slice lifecycle management uptake, the share of traffic and use cases needing guaranteed SLA, and typical contract durations for enterprise connectivity.
To keep the totals realistic, we corroborate them with selective bottom-up approximations, such as sampled price points for managed slice offers, channel checks on the attach rate of slice orchestration software, and supplier-side workload signals for integration and operations. Where hard numbers are not disclosed, gaps are handled with bounded assumptions that are rechecked in interviews, and then tightened using operator capex and opex direction, 5G core upgrade timing, and regional rollout cadence.
For forecasting, scenario analysis is used because adoption depends on a few step-change events, like broader 5G SA coverage, more mature orchestration, and enterprise proof points. The scenarios are anchored to the same operating variables, and then adjusted using consensus from primary respondents on how quickly slicing converts from early contracts to repeatable revenue.
Data Validation & Update Cycle
Validation is done through cross-checking the model against independent signals, including the count and maturity of commercial slicing announcements, 5G SA coverage expansion, and the timing of core and transport modernization needed to support slices. Any large variance by region or year is reviewed by a second analyst, and the input assumptions are re-checked before sign-off so that a single optimistic input does not pull the total too far.
The report is refreshed annually, and interim updates are made when material events occur, such as major policy shifts, large commercial wins, or a clear change in rollout pace. Before delivery, the model is re-opened for a final pass so clients receive the latest updated view rather than an older snapshot.
Mordor Intelligence's Network Slicing Market Size Compared Against Other Published Estimates
Published market values for network slicing can look far apart because firms do not always count the same revenue items, and they also pick different points for when a slice is considered commercial. Differences in whether the scope is limited to 5G Standalone slicing, how enabling software and services are treated, and how currency timing is handled can all move the final number.
Evidence from verified commercial 5G SA slice launches, cross-checked with operator readiness signals across RAN, core, and transport, is what ties Mordor Intelligence to a narrower revenue definition that excludes non-slice-aware 5G hardware and legacy managed services, which tends to keep the 2025 figure below broader 5G monetization totals.
Benchmark comparison
| Source | Market Size | Gaps in Research Methodology |
|---|---|---|
| Mordor Intelligence | USD 1.92 B (2025) | |
| Global Advisory B | USD 6.10 B (2025) | Uses a broader 5G network slicing lens that spans enterprise and consumer revenue, which can blend slicing with wider 5G monetization and inflate the counted demand pool. |
| Industry Research Group C | USD 0.66 B (2024) | Starts from a 2024 base year and may apply narrower commercial-only criteria and early-stage adoption assumptions, which can undercount rollouts that are already moving from trials to paid contracts. |
The spread across the three figures is mainly explained by what is counted as slicing revenue and when a deployment is treated as commercial. Using clear inclusion rules, and then checking them against rollout and readiness evidence, keeps the estimate traceable to repeatable inputs rather than to a single aggressive adoption assumption.


Key Questions Answered in the Report
What is driving the explosive growth of the network slicing market?
Rapid 5G SA deployments, enterprise demand for URLLC and enhanced mobile broadband, and CSP urgency to monetize stagnant ARPU underpin the 39.85% CAGR forecast.
Which component segment leads spending today?
Software accounts for 45.12% of 2025 revenue thanks to orchestration and analytics platforms that automate slice life-cycle management.
How big is the opportunity for managed slice-as-a-service models?
Managed services hold 54.68% share and are on pace to surpass USD 7.75 billion by 2031, reflecting enterprise preference for turnkey offerings.
Which region will grow the fastest through 2031?
Asia Pacific is projected to post a 41.1% CAGR, propelled by China’s large-scale 5G roll-outs and supportive spectrum policies in Japan and South Korea.
How are CSPs monetizing slices today?
Operators bundle premium SLAs for public-safety video, cloud gaming, and hybrid private-public campus networks, often exposing APIs for developer-led services.
What technical hurdle most constrains adoption?
Multi-domain orchestration complexity raises OPEX and slows time to market, especially for smaller carriers lacking cloud-native OSS/BSS platforms.
Page last updated on:


