Wireless Connectivity Market Size and Share
Market Overview
| Study Period | 2020 - 2031 |
|---|---|
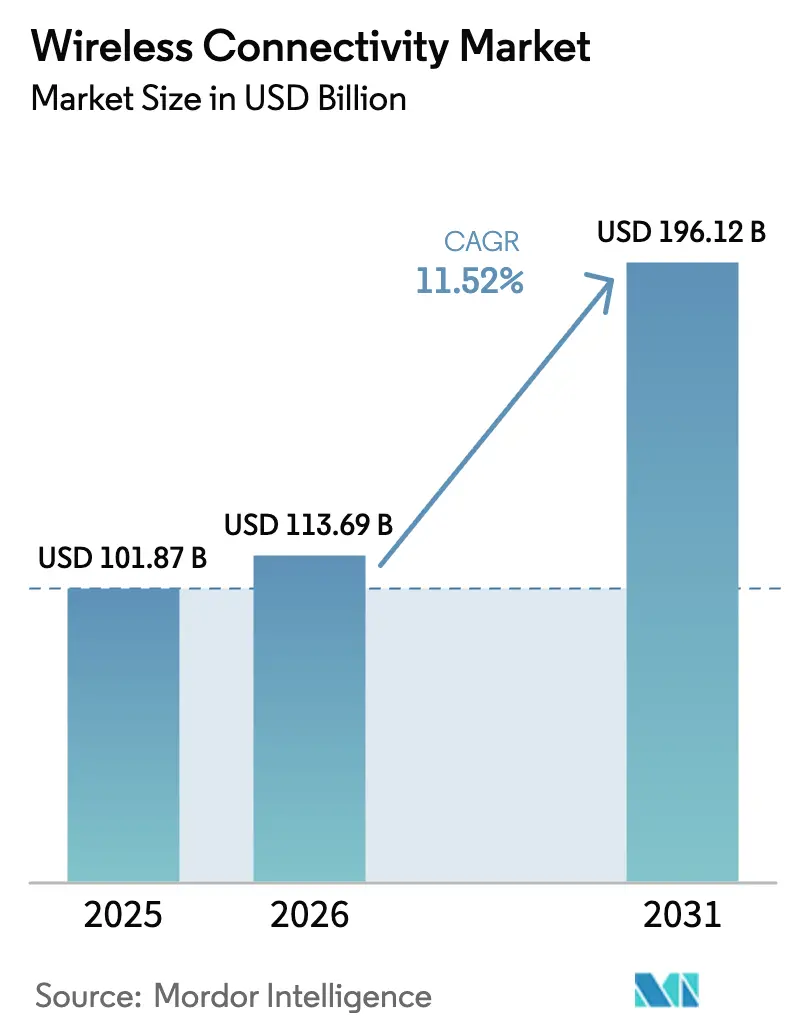
| Market Size (2026) | USD 113.69 Billion |
| Market Size (2031) | USD 196.12 Billion |
| Growth Rate (2026 - 2031) | 11.52% CAGR |
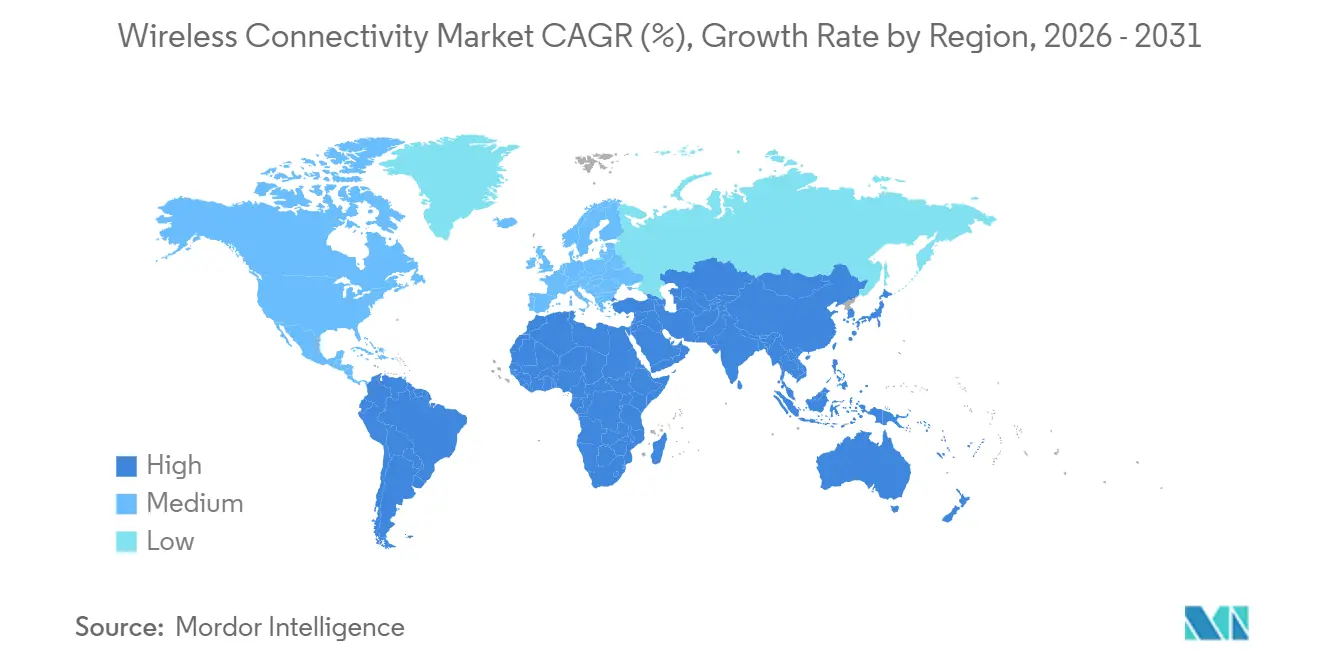
| Fastest Growing Market | Middle East |
| Largest Market | Asia Pacific |
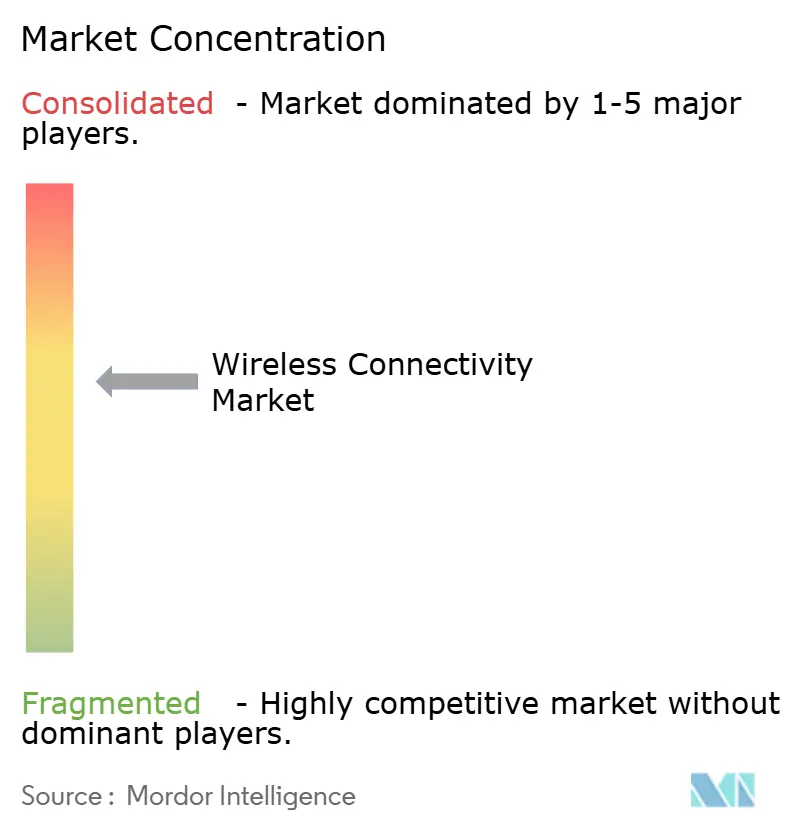
| Market Concentration | Medium |
Major Players *Disclaimer: Major Players sorted in no particular order Image © Mordor Intelligence. Reuse requires attribution under CC BY 4.0. | |
Wireless Connectivity Market Analysis by Mordor Intelligence
The wireless connectivity market size is projected to be USD 101.87 billion in 2025, USD 113.69 billion in 2026, and reach USD 196.12 billion by 2031, growing at a CAGR of 11.52% from 2026 to 2031. This growth emerges from a rapid pivot toward multi-radio architectures that blend Wi-Fi 7, private 5G, and ultra-wideband in a single module, shrinking board area, trimming power budgets, and opening new design headroom for automotive and industrial OEMs. Spectrum liberalization, notably the full 6 GHz release in North America, improves deterministic latency while simultaneously pressuring vendors to carry region-specific SKUs where policy remains restrictive. Foundry constraints at 3 nm and 5 nm nodes amplify bill-of-materials volatility, nudging Tier-2 module suppliers toward vertical integration or contract-manufacturing partnerships to secure wafer starts. Demand hot spots continue to migrate, Asia Pacific factories retrofit with private 5G gateways, while the Middle East pushes 5G fixed-wireless access for smart-city backhaul, underscoring clear geographic divergence inside the wireless connectivity market.
Key Report Takeaways
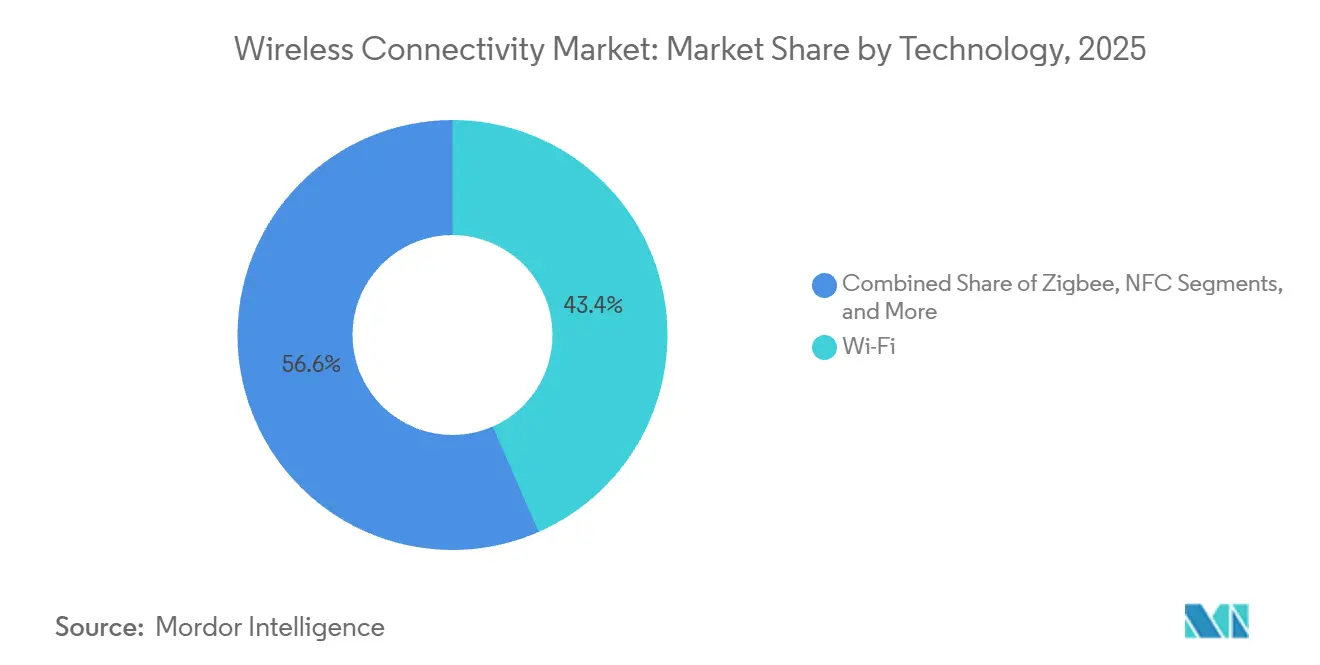
- By technology, Wi-Fi led with 43.43% revenue share in 2025, whereas ultra-wideband is projected to advance at a 12.46% CAGR through 2031.
- By end-user industry, consumer electronics accounted for 37.23% of 2025 spending, while automotive is forecast to expand at an 11.72% CAGR through 2031.
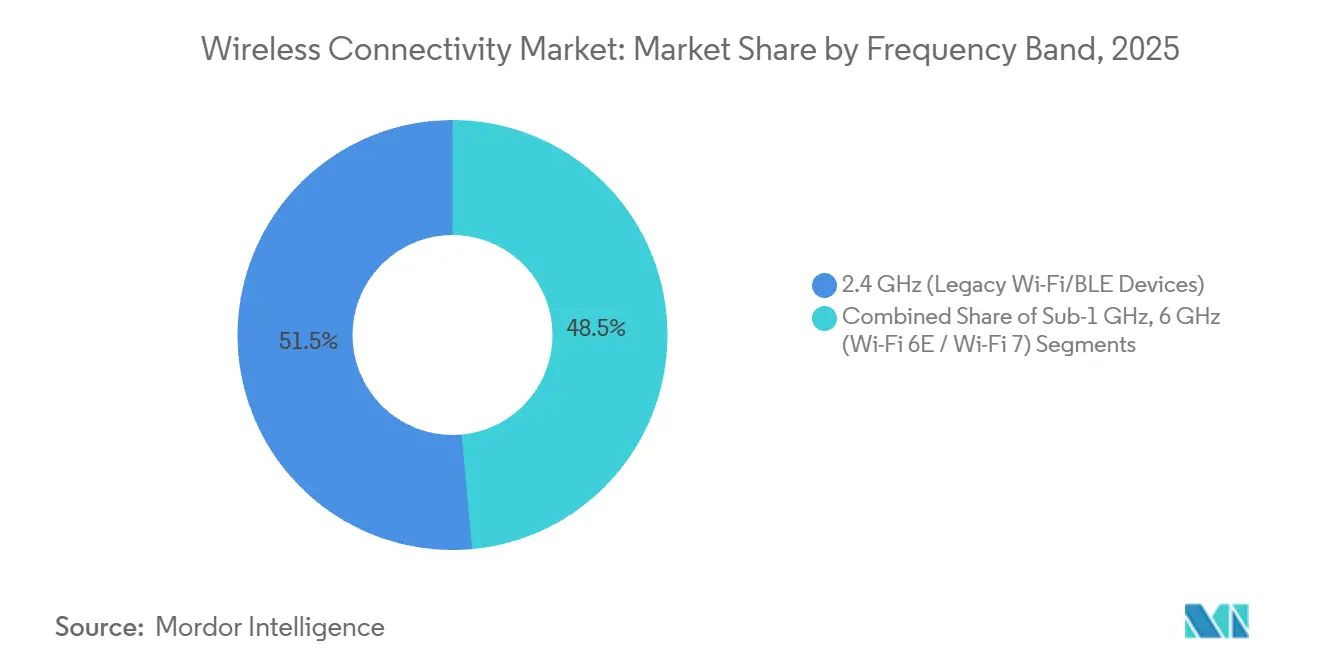
- By frequency band, the 2.4 GHz segment contributed 51.46% of 2025 sales; conversely, the 6 GHz band is on track for a 12.83% CAGR through 2031.
- By device type, smartphones and tablets held 46.13% of 2025 receipts, yet wearables are poised for an 11.84% CAGR during 2026-2031.
- By geography, Asia Pacific captured 34.51% of 2025 revenue, while the Middle East is forecast to post a 12.02% CAGR over the same horizon.
Note: Market size and forecast figures in this report are generated using Mordor Intelligence’s proprietary estimation framework, updated with the latest available data and insights as of January 2026.
Global Wireless Connectivity Market Trends and Insights
Drivers Impact Analysis*
| Driver | (~) % Impact on CAGR Forecast | Geographic Relevance | Impact Timeline |
|---|---|---|---|
| Surge of Wi-Fi 6/6E/7 chipsets in consumer and industrial IoT | +2.8% | Global, early enterprise uptake in North America and Europe | Medium term (2-4 years) |
| Expansion of LPWAN modules for smart-meter roll-outs | +1.9% | Europe, Asia Pacific (UK, Germany, India, China) | Long term (≥ 4 years) |
| Private 5G and Wi-Fi co-existence driving multi-radio gateways | +2.1% | North America and Europe industrial corridors, APAC manufacturing hubs | Medium term (2-4 years) |
| Government-funded open-roaming city networks | +1.2% | North America, Europe, Middle East smart cities | Medium term (2-4 years) |
| AI-driven self-optimizing wireless networks in factories | +1.6% | APAC manufacturing zones, North America and Europe automotive plants | Short term (≤ 2 years) |
| Millimeter-wave backhaul for rural FWA programs | +1.3% | North America rural corridors, Middle East, Africa, South America | Long term (≥ 4 years) |
| Source: Mordor Intelligence | |||
Surge of Wi-Fi 6/6E/7 Chipsets in Consumer and Industrial IoT
Enterprise shipments of Wi-Fi 7 access points reached 12% of new WLAN units in Q1 2025, although headline 46 Gbps throughput remains aspirational because most client devices still lack 320 MHz support. Multi-link operation lets a factory sensor send time-critical packets over 6 GHz while placing bulk data on 5 GHz, holding jitter below 5 ms in congested rooms. Broadcom shipped 18 million Wi-Fi 7 combo chips during 2025, with industrial gateways driving half of that volume. The shift from star to mesh-plus-gateway topologies forces legacy PLC makers to redesign backplanes, creating a 24-month refresh cycle that sustains double-digit chipset growth into 2027. Module suppliers that layer AI-based interference mitigation into firmware are securing long-term supply agreements, insulating margins even as silicon prices wobble due to node scarcity. Consequently, the wireless connectivity market finds Wi-Fi 7 adoption gating many factory-automation upgrades.
Expansion of LPWAN Modules for Smart-Meter Roll-Outs
European utilities accelerated meter digitization in 2025 after regulators mandated 15-minute interval data. Severn Trent deployed 1 million LoRaWAN meters across the Midlands and slashed truck-roll costs by 40%. Yorkshire Water opted for NB-IoT, rolling out 1.3 million units that piggy-back on existing cellular towers, eliminating gateway capex. The resulting bifurcation unlicensed LoRa for rural districts versus carrier-grade NB-IoT in dense metros creates parallel ecosystems where single-protocol strategies now look risky. Semtech’s LoRa Edge, which combines sub-GHz, GNSS, and Wi-Fi sniffing, allowed German and French construction firms to tag 200 000 high-value assets during 2025, hinting at cross-vertical reuse. Utilities and rental fleets alike converge on ultra-low-power radios, boosting module ASPs even as volumes scale. For the wireless connectivity market, LPWAN roll-outs reinforce the sector’s long-tail, high-volume profile.
Private 5G and Wi-Fi Co-Existence Driving Multi-Radio Gateways
Factories pursuing lights-out automation mount both private 5G and Wi-Fi 6E to split OT and IT traffic. Ericsson’s industrial 5G kit at Cummins and Airbus pairs a 3.5 GHz base station with Wi-Fi 6E APs in one console, cutting go-live timelines to eight weeks.[1]Ericsson, “Industrial 5G Deployments,” ericsson.com Qualcomm’s QCS8550 processor embeds Wi-Fi 7 and 5G on a single die so OEMs can toggle bandwidth by application priority. Asia Pacific leads actual deployments as Foxconn and BYD retrofit legacy plants. Multi-radio gateways satisfy 99.999% uptime SLAs by rerouting around local interference, ratcheting up attach rates for quality-of-service software. Over 2026-2028, industrial corridors are expected to refresh wired PLC islands with converged gateways, reinforcing double-digit momentum for the wireless connectivity market.
Government-Funded Open-Roaming City Networks
Municipal Wi-Fi projects now favor open-roaming frameworks so devices authenticate seamlessly across public and private SSIDs. New York City’s LinkNYC 2.0 and Dubai’s Smart City Wi-Fi both employ Passpoint to automate credential exchange, raising session-start rates by 35%. City planners see the network as foundational public infrastructure, akin to street lighting. Capital outlays are typically amortized through advertising and tower-lease revenue, rendering projects budget-neutral within five years. Because networks lean on Wi-Fi 6E backhaul and millimeter-wave mesh, chipset vendors realize incremental sales without courting consumer devices. Adoption is most aggressive in tourist districts where seamless roaming anchors smart-tourism applications, supplying another growth vein inside the wireless connectivity market.
Restraints Impact Analysis*
| Restraint | (~) % Impact on CAGR Forecast | Geographic Relevance | Impact Timeline |
|---|---|---|---|
| Fragmented global spectrum policy slowing Wi-Fi 7 adoption | −1.8% | Global, acute in Asia Pacific and Europe | Medium term (2-4 years) |
| Persistent Bluetooth security exploits in medical wearables | −1.1% | Global, concentrated in North America and Europe healthcare systems | Short term (≤ 2 years) |
| Rising silicon costs due to advanced-node scarcity | −1.4% | Global, supply concentrated in Taiwan and South Korea | Medium term (2-4 years) |
| EMC compliance hurdles for UWB in automotive cabins | −0.9% | Europe and Asia Pacific automotive markets | Short term (≤ 2 years) |
| Source: Mordor Intelligence | |||
Fragmented Global Spectrum Policy Slowing Wi-Fi 7 Adoption
The United States and Canada opened 1200 MHz of 6 GHz spectrum, yet Europe caps indoor use at 500 MHz and China bars the band entirely, obliging vendors to field regional SKUs that inflate inventory by 18%.[2]Federal Communications Commission, “Unlicensed Use of the 6 GHz Band,” fcc.gov Broadcom’s BCM6726 slipped nine months while engineers retuned power amps to meet disparate EIRP ceilings, illustrating hidden time-to-market penalties. Such fragmentation causes enterprises in Shanghai and Shenzhen to delay WLAN refresh plans in favor of legacy 5 GHz upgrades, muting near-term hardware demand. In Europe, automated frequency coordination requirements add certification fees that squeeze small integrators. Consequently, the wireless connectivity market faces a patchwork adoption curve rather than a synchronized global ramp.
Persistent Bluetooth Security Exploits in Medical Wearables
BLUFFS and Sweyntooth remain unpatched in roughly 40% of medical wearables shipped before 2024, leaving hospitals with a risk-acceptance dilemma. The U.S. Food and Drug Administration issued 2024 guidance for cryptographic agility, yet legacy devices still lack over-the-air update paths. Abbott’s FreeStyle Libre 3 meets Bluetooth 5.4 standards but suffers interoperability gaps with older phones, complicating patient enrollment. Healthcare CIOs either require smartphone upgrades or absorb security liability, delaying bulk procurement. As a result, the wireless connectivity market contends with slower certification cycles in regulated healthcare.
*Our forecasts treat driver/restraint impacts as directional, not additive. The impact forecasts reflect baseline growth, mix effects, and variable interactions.
Segment Analysis
By Technology: Ultra-Wideband Disrupts Legacy Proximity Protocols
Ultra-wideband revenue is rising at a 12.46% CAGR, outpacing all rival technologies as BMW and Volkswagen embed digital keys in mainstream models, while industrial operators demand centimeter-grade positioning for asset tracking. Wi-Fi still anchored 43.43% of 2025 receipts, buoyed by enterprise AP refresh cycles, yet its share erodes as 6 GHz channel caps outside North America stall upgrades. Bluetooth rides 2.8 billion annual device shipments, but its margin pool narrows as SoC vendors bundle radios without extra cost. Zigbee and Thread, now converged under the Matter protocol, shipped 340 certified products in 2025, opening fresh smart-home adjacencies. LPWAN variants such as LoRa and NB-IoT carve out long-range, low-data sensor niches, solidifying the wireless connectivity market’s barbell pattern, bleeding-edge multi-gig extensions at one end and ultra-low-power metering on the other.
Hybrid integration defines current roadmaps. Espressif’s ESP32-C6, for instance, hosts Wi-Fi 6, Bluetooth 5.3, Zigbee, and Thread on one die, letting firmware switch protocols as device states shift, support high-rate Wi-Fi firmware updates, and enable low-rate sensor bursts on Zigbee. IEEE 802.15.4z secure ranging is now mandatory for Digital Key 3.0, ensuring interoperability across OEMs. Power-accuracy trade-offs remain stark: ultra-wideband drains a coin cell in six months, so adoption clusters around mains-powered door locks and infotainment hubs. Meanwhile, Wi-Fi 7’s 2 W draw confines it to devices with robust thermal budgets. This performance matrix guarantees diverse silicon demand profiles, keeping the wireless connectivity market resilient to single-protocol downturns.


By End-User Industry: Automotive Outpaces Consumer Electronics
Automotive connectivity outstrips all peers at an 11.72% CAGR as regulators mandate cellular vehicle-to-everything and insurers discount ultra-wideband digital keys that defeat relay attacks. General Motors will embed Qualcomm Snapdragon Ride with integrated ultra-wideband in all 2027 models, locking in multi-radio baselines. Consumer electronics still contributed 37.23% of 2025 revenue, yet smartphone refresh cycles expanded to 3.2 years, trimming unit upside. Industrial automation leans on private 5G and Wi-Fi 6E to orchestrate autonomous robots and machine-vision systems, but the capex cadence aligns with five-year PLC refreshes. Healthcare transitions from proprietary radios to Bluetooth Low Energy 5.4, but regulatory approval extends commercialization by 18-36 months. Utility metering continues its pivot to NB-IoT and LoRa, making the wireless connectivity market a tapestry of asynchronic demand curves.
Value creation in automotive is shifting from discrete telematics boxes to integrated domain controllers that aggregate cellular, Wi-Fi, Bluetooth, and ultra-wideband, chopping BOMs by 20%. Consumer electronics splits into premium devices sporting Wi-Fi 7 and ultra-wideband, and value tiers staying on Wi-Fi 5. Industrial OEMs demand extended temperature and IP67 ratings, an area mainstream enterprise WLAN vendors currently under-serve. Healthcare firms adopt Bluetooth 5.4 once FDA cybersecurity rules clarify certification templates, bolstering pipeline visibility for 2027-2028. These cross-sector rhythms distribute risk and opportunity, underpinning steady expansion in the wireless connectivity market.
By Frequency Band: 6 GHz Gains Where Regulators Allow
The 2.4 GHz band still delivers 51.46% of 2025 receipts thanks to 15 billion installed devices, yet throughput collapse in dense apartments pushes enterprises toward 6 GHz Wi-Fi 6E and Wi-Fi 7. Markets that opened the full 1200 MHz allocation - the United States, Canada, and South Korea - experience 12.83% CAGR on 6 GHz equipment, contrasting sharply with Europe’s indoor-only stance. Sub-1 GHz remains a staple for LoRa and Sigfox in agriculture and utilities, valued for 10-km range and deep penetration. Chip vendors now embed GPS receivers to detect geolocation and disable unlawful bands, adding USD 2 to USD 4 to BOMs. The wireless connectivity market faces higher certification overhead but also commands premium pricing where spectrum is plentiful.
Software-defined radios mediate regional disparity. Qualcomm FastConnect 7900 toggles bands based on location, while Cisco cites 22% of 2025 North American enterprise AP sales as 6 GHz capable versus 8% in Europe. Outdoor coverage gaps still force warehouses to retain 5 GHz for yard logistics. Sub-1 GHz allocations vary - 915 MHz in the Americas and 868 MHz in Europe - forcing multi-SKU inventory that favors global vendors with scale. This complex spectrum chessboard ensures persistent innovation and stratified growth inside the wireless connectivity market.
By Device Type: Wearables Surge on Medical and Fitness Demand
Wearables chart an 11.84% CAGR through 2031 as continuous glucose monitors and ECG patches migrate to Bluetooth Low Energy 5.4 with encrypted advertisements, satisfying cybersecurity mandates. Smartphones and tablets still accounted for 46.13% of 2025 revenue, though shipments slipped 3% year-on-year as consumers stretched upgrade cycles. Industrial IoT sensors drop wired 4-20 mA loops in favor of wireless mesh networks, slicing retrofit labor by 60-70%. Smart-home devices consolidate around Matter, boosting silicon complexity but easing user onboarding.[3]Connectivity Standards Alliance, “Matter Certified Product List,” csa-iot.org Automotive cabins now house cellular modems for telematics, Wi-Fi for over-the-air updates, Bluetooth for infotainment, and ultra-wideband for keys, stacking to USD 80 to USD 120 of connectivity silicon per vehicle.
Wearables can be divided into medical-grade and wellness devices. Abbott shipped 8 million FreeStyle Libre 3 units in 2025, reflecting momentum from class II clearance. Industrial sensors wrestle with battery life; a Bluetooth vibration probe transmitting once per minute depletes a CR2032 in 18 months, encouraging energy-harvesting designs. Smart-home fragmentation persists despite Matter; Apple’s HomePod requires Thread border routers, adding setup friction. Automotive domain-controller consolidation, showcased by Tesla Hardware 4, trims wiring weight by 12 kg. Across form factors, the wireless connectivity market benefits from an ever-widening array of radio attach points.
Geography Analysis
Asia Pacific retained 34.51% of 2025 spending, propelled by China’s 5G roll-out, India’s smart-city program, and Japan’s Society 5.0 initiative. China mandated NB-IoT in all new utility meters starting 2024, seeding a 400 million-unit addressable base. India allocated INR 480 billion (USD 5.8 billion) for digital infrastructure, underpinning city-wide Wi-Fi and IoT sensor nets. Toyota equipped 12 plants with Ericsson private 5G in 2025 to guide autonomous vehicles, reinforcing factory demand. Southeast Asia adds LoRaWAN networks for ag-tech, connecting 2.4 million soil-moisture probes by 2025.
The Middle East shows the fastest trajectory at 12.02% CAGR, as Saudi Arabia’s Public Investment Fund committed USD 20 billion to NEOM’s converged fiber-wireless grid, blending 5G, Wi-Fi 6E, and millimeter-wave backhaul. The UAE auctioned 6 GHz licenses in 2025, allowing du and Etisalat to deploy Wi-Fi 7 fixed-wireless access in Dubai. Turkey approved indoor 6 GHz use, catalyzing enterprise Wi-Fi 6E in Istanbul. Africa clusters around NB-IoT, with MTN Group installing 1.2 million smart meters in South Africa during 2025.
North America and Europe log 8-9% CAGR as mature fleets limit new installs. Yet U.S. early 6 GHz liberalization spurs continual WLAN refresh; Cisco’s 6 GHz AP penetration already tops 20%. Mexico’s 2025 approval harmonized North American rules, easing SKU counts. Europe’s patchwork slows momentum, indoor-only 6 GHz, varying ultra-wideband power caps, and country-specific NB-IoT frequencies pose compliance drag. Germany issued 450 private 5G licenses by 2025, largely to automotive and chemical sites. The UK opened the whole 6 GHz indoor band in 2024, accelerating Wi-Fi 7 uptake in London. Brazil’s spectrum consultation remains unresolved, delaying 6 GHz WLAN there. Overall, geography-specific policy shapes a multi-speed wireless connectivity market that rewards vendors agile enough to handle regulatory heterogeneity.

Competitive Landscape
The top five chipset suppliers, Qualcomm, Broadcom, MediaTek, Intel, and NXP, held roughly 62% of 2025 revenue, confirming moderate consolidation. Qualcomm’s FastConnect 7900 packs Wi-Fi 7, Bluetooth 5.4, and ultra-wideband in a 6 mm × 6 mm die, cutting board space by 30% and pressuring rivals to match integration. Broadcom answered with the BCM6726 tri-band Wi-Fi 7 AP chip, bundling automated frequency coordination for European compliance. MediaTek’s 2024 purchase of Airoha added TWS audio IP, tightening vertical control of BT earbuds. NXP filed 47 ultra-wideband patents over 2024-2025, guarding secure ranging IP that underpins its automotive beachhead.
Smaller specialists hunt niches. Nordic Semiconductor and Silicon Labs pre-load Matter stacks in ROM, saving 200-400 kB flash on battery IoT nodes. Espressif’s ESP32-C6 undercuts incumbents by 30-40%, grabbing cost-sensitive smart-home sockets. Ruggedized industrial Wi-Fi 6E APs rated for -40 °C to 85 °C remain underserved, luring automotive Tier-1 suppliers into enterprise turf.
Software now differentiates. Vendors sell AI-driven channel allocation and predictive roaming as subscriptions, extending lifetime value beyond silicon. Patent filings echo this shift, Qualcomm emphasizes multi-link latency algorithms, while NXP protects multi-anchor ultra-wideband positioning. Competitive intensity peaks in smartphones where 12-month design windows force yearly spec leaps. Conversely, industrial and utility verticals grant longer cycles but demand extreme reliability, shaking out suppliers lacking field-support heft. Consequently, the wireless connectivity market balances concentrated silicon share with fragmented software and vertical-service layers.
Wireless Connectivity Industry Leaders
Qualcomm Incorporated
Intel Corporation
Texas Instruments Inc.
NXP Semiconductors N.V.
Microchip Technology Inc.
- *Disclaimer: Major Players sorted in no particular order

Recent Industry Developments
- December 2025: Qualcomm unveiled FastConnect 7900, a Wi-Fi 7, Bluetooth, and ultra-wideband combo chip that achieves sub-2 ms latency in flagship phones and vehicles.
- November 2025: Broadcom launched BCM6726 tri-band Wi-Fi 7 chipset for enterprise APs, integrating automated frequency coordination for Europe.
- October 2025: NXP added the Trimension SR250 ultra-wideband part offering 5-degree angle-of-arrival for automotive keys.
- September 2025: MediaTek introduced Filogic 880 Wi-Fi 7 silicon, winning TP-Link and Netgear designs for 2026 routers.


Research Methodology Framework and Report Scope
Market Definitions and Key Coverage
Our study defines the wireless connectivity market as the total annual revenue generated from integrated radio chipsets, modules, and embedded SoCs that enable untethered data transfer over Wi-Fi, Bluetooth, Zigbee, NFC, ultra-wideband, LPWAN families (LoRa, NB-IoT, Sigfox), and licensed cellular standards up to 5G. Purely service-based connectivity fees are left outside the scope; this is where Mordor Intelligence keeps the boundary clear.
Scope Exclusion: Passive RFID tags and wired back-haul equipment are excluded.
Segmentation Overview
- By Technology
- Wi-Fi
- Bluetooth
- Zigbee
- NFC
- Cellular (4G/5G)
- LPWAN (LoRa, NB-IoT, Sigfox)
- UWB
- Other Technologies
- By End-User Industry
- Consumer Electronics
- Automotive
- Industrial and Manufacturing
- Healthcare and Medical Devices
- Energy and Utilities
- Smart Infrastructure and Buildings
- Other End-User Industries
- By Frequency Band
- Sub-1 GHz
- 2.4 GHz (Legacy Wi-Fi/BLE Devices)
- 6 GHz (Wi-Fi 6E / Wi-Fi 7)
- By Device Type
- Smartphones and Tablets
- Industrial IoT Sensors
- Wearables
- Smart Home Devices
- Automotive Systems
- Healthcare Devices
- By Geography
- North America
- United States
- Canada
- Mexico
- Europe
- Germany
- United Kingdom
- France
- Italy
- Spain
- Russia
- Rest of Europe
- Asia Pacific
- China
- Japan
- India
- South Korea
- ASEAN
- Australia and New Zealand
- Rest of Asia Pacific
- South America
- Brazil
- Argentina
- Rest of South America
- Middle East
- Saudi Arabia
- Saudi Arabia
- United Arab Emirates
- UAE
- Turkey
- Turkey
- Rest of Middle East
- Rest of Middle East
- Africa
- South Africa
- South Africa
- Nigeria
- Nigeria
- Kenya
- Rest of Africa
- Rest of Africa
- North America
Detailed Research Methodology and Data Validation
Primary Research
Mordor analysts spoke with chipset vendors, IoT gateway OEM engineers, mobile-network planners, and facility IT heads across North America, Asia-Pacific, and Europe. These conversations validated penetration assumptions for Wi-Fi 6E routers, 5G RedCap modules, and dual-band smart-meter roll-outs, and they flagged region-specific subsidy impacts that raw desk data misses.
Desk Research
We begin by scraping trusted open datasets from the International Telecommunication Union, GSMA Intelligence, FCC, Eurostat, China's MIIT, and peer-reviewed IEEE papers to size connected-device pools and spectrum allocations. Company 10-Ks, investor decks, and trade-association dashboards (WBA, Bluetooth SIG) help our analysts track average selling prices and node transitions. Subscription resources such as D&B Hoovers and Dow Jones Factiva then let us cross-check vendor revenue splits, while import-export leads from Volza reveal LPWAN module flows into utility roll-outs. The items named here illustrate our desk inputs; several additional sources were also tapped for confirmation.
Market-Sizing & Forecasting
A top-down build starts with installed device bases, mobile-subscription counts, and semiconductor content per node. These volumes are married with sampled ASPs to create revenue pools, which are then sanity-checked through supplier roll-ups and channel checks. Key variables include 6 GHz spectrum adoption rates, LPWAN meter deployments, smartphone replacement cycles, macroeconomic GDP outlooks, and IoT endpoint growth curves. Multivariate regression combined with scenario analysis produces five-year forecasts, while gap pockets in bottom-up samples are bridged with weighted averages from adjacent geographies.
Data Validation & Update Cycle
Every draft model passes two independent analyst reviews, variance thresholds trigger re-contacts with earlier respondents, and macro indicators are refreshed quarterly. We refresh the full dataset annually and release interim flashes if spectrum policy or chipset pricing shifts materially.
Why Our Wireless Connectivity Baseline Commands Reliability
Published estimates often diverge because firms pick different inclusion rules, price stacks, and refresh cadences.
Key gap drivers include whether modules inside consumer devices are counted separately, how aggressively future ASP erosion is assumed, and if infrastructure spending is blended with component sales.
Benchmark comparison
| Market Size | Anonymized source | Primary gap driver |
|---|---|---|
| USD 101.84 B | Mordor Intelligence | - |
| USD 141.10 B | Global Consultancy A | Combines connectivity services and hardware, uses 2020-weighted ASP curve |
| USD 154.08 B | Research Publisher B | Adds carrier capex plus Wi-Fi CPE, older currency conversion |
| USD 111.14 B | Trade Journal C | Counts only chipsets; leaves out finished modules |
Third-party publications place the 2025 market between USD 111 B and USD 154 B, yet those figures sit on broader or narrower scopes than ours. This comparison shows how Mordor's disciplined boundary setting, annual refresh, and dual-lens validation give decision-makers a balanced, repeatable baseline they can trust.


Key Questions Answered in the Report
What is the projected valuation of the wireless connectivity market by 2031?
It is forecast to reach USD 196.12 billion by 2031, growing at an 11.52% CAGR during 2026-2031.
Which technology segment is expected to grow the fastest through 2031?
Ultra-wideband, driven by automotive digital keys and industrial positioning, is forecast to expand at a 12.46% CAGR.
Why is Asia Pacific the largest regional contributor?
Massive 5G infrastructure builds in China, India’s smart-city projects, and Japan’s private 5G factory upgrades together account for 34.51% of 2025 revenue and maintain momentum through 2031.
How will spectrum policy affect Wi-Fi 7 adoption?
Full 6 GHz availability in North America accelerates upgrades, while Europe’s indoor-only limits and China’s absence slow deployments, creating a multi-speed roll-out.
What are the main security concerns in medical wearables?
Legacy Bluetooth Low Energy devices remain vulnerable to BLUFFS and Sweyntooth exploits, prompting new FDA guidance that favors Bluetooth 5.4 with encrypted advertising.
Which end-user industry shows the highest CAGR?
Automotive connectivity is projected to grow at 11.72% annually as cellular V2X and ultra-wideband keys become standard features.
Page last updated on:


