6G Market Size and Share
Market Overview
| Study Period | 2019 - 2030 |
|---|---|
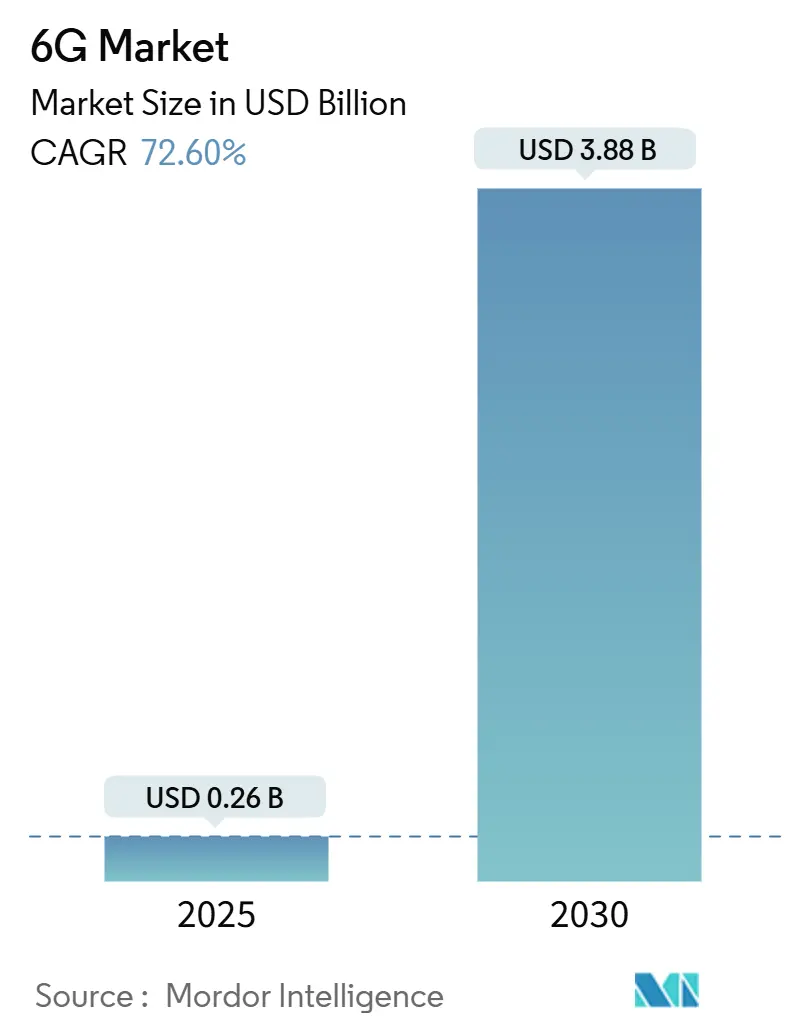
| Market Size (2025) | USD 0.26 Billion |
| Market Size (2030) | USD 3.88 Billion |
| Growth Rate (2025 - 2030) | 72.60% CAGR |
| Fastest Growing Market | Asia Pacific |
| Largest Market | Asia Pacific |
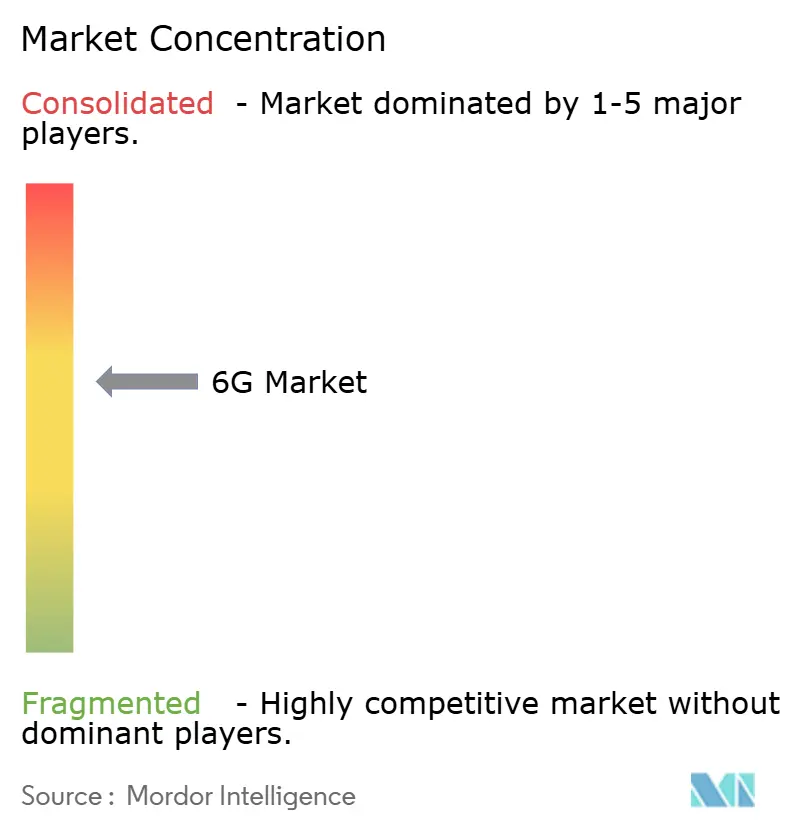
| Market Concentration | Medium |
Major Players *Disclaimer: Major Players sorted in no particular order Image © Mordor Intelligence. Reuse requires attribution under CC BY 4.0. | |
6G Market Analysis by Mordor Intelligence
The 6G market is valued at USD 0.26 billion in 2025 and is projected to reach USD 3.88 billion by 2030, reflecting a compound annual growth rate (CAGR) of 72.6%.[1]IEEE Staff, “Terahertz Communications for 6G,” IEEE Xplore, ieeexplore.ieee.org The surge is propelled by terahertz-band spectrum, artificial intelligence (AI) integration across the network stack, and the early commercialisation of non-terrestrial networks that extend coverage beyond traditional cell sites. Demand centres on three core requirements: sub-millisecond latency for real-time applications, seamless connectivity for a massive base of distributed IoT devices, and government-funded research programmes that accelerate technical maturity. Competitive dynamics are changing as software-defined networking and AI-native optimisation begin to eclipse traditional hardware advantages, opening space for new entrants that specialise in algorithmic performance. Capital-intensive back-haul investments and spectrum-allocation uncertainty remain the main barriers, but government subsidies and spectrum-sharing policies are narrowing the risk window.
Key Report Takeaways
- By device type, mobile devices led with 46% of 6G market share in 2024, while IoT and edge devices are expanding at a 73.22% CAGR through 2030.
- By component, hardware captured 54% of the 6G market size in 2024; the software segment is projected to grow at 77.10% CAGR between 2025 and 2030.
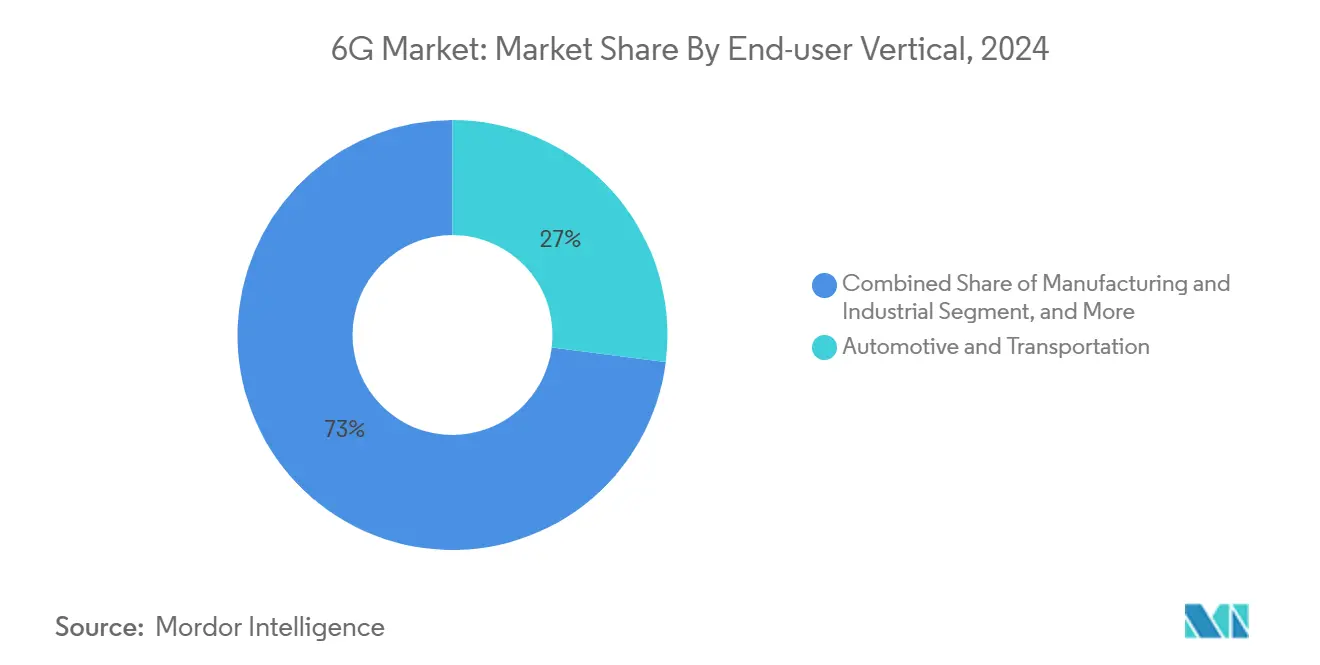
- By end-user vertical, automotive and transportation held 27% of 6G market share in 2024, whereas healthcare applications are advancing at a 72.45% CAGR.
- By frequency band, sub-terahertz (100–300 GHz) deployments accounted for 71% of the 6G market size in 2024; terahertz bands above 300 GHz are forecast to increase at 76.15% CAGR.
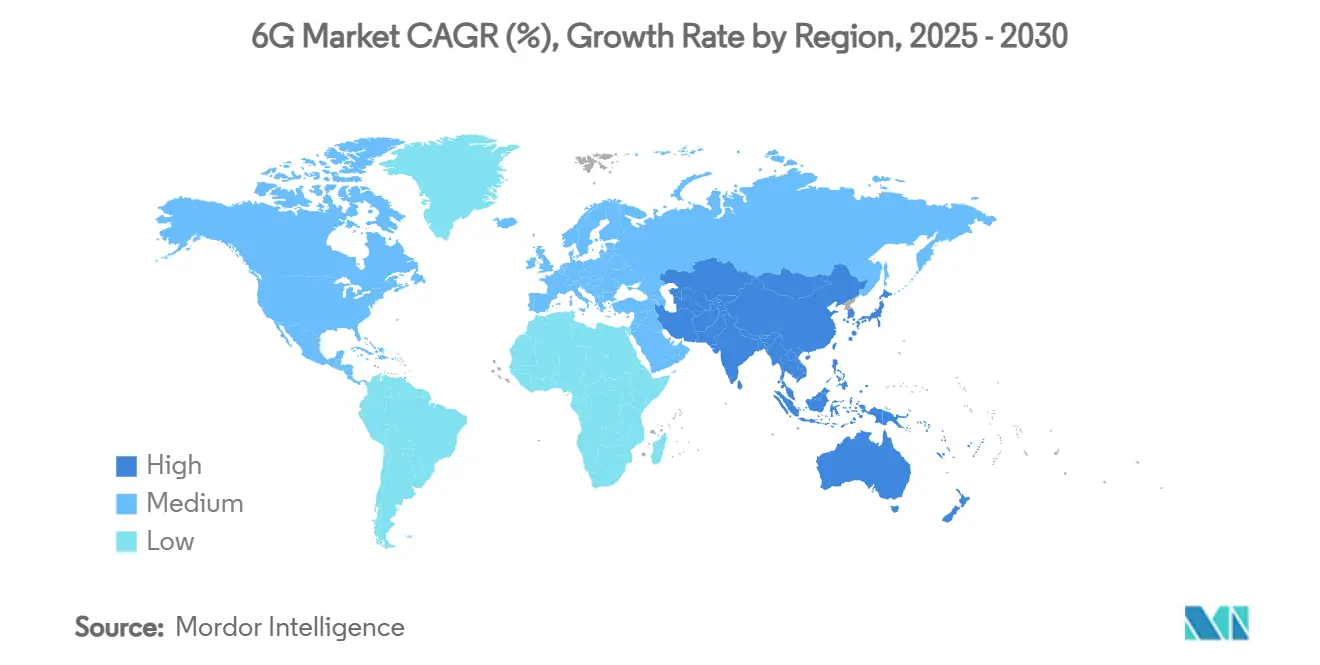
- By geography, Asia-Pacific commanded 36% revenue share in 2024 and is growing at a 74.08% CAGR to 2030.
Note: Market size and forecast figures in this report are generated using Mordor Intelligence’s proprietary estimation framework, updated with the latest available data and insights as of January 2026.
Global 6G Market Trends and Insights
Drivers Impact Analysis*
| Driver | (~) % Impact on CAGR Forecast | Geographic Relevance | Impact Timeline |
|---|---|---|---|
| Exploding data demand and ultra-low latency use-cases | +18.5% | Global, led by Asia-Pacific | Medium term (2–4 years) |
| Proliferation of AI-enabled edge and IoT devices | +16.2% | North America and EU, expanding to Asia-Pacific | Short term (≤ 2 years) |
| Government R&D grants and early spectrum policies | +12.8% | Developed markets worldwide | Long term (≥ 4 years) |
| Integration with non-terrestrial / satellite networks | +11.3% | Global | Medium term (2–4 years) |
| Programmable Reconfigurable Intelligent Surfaces (RIS) deployment | +8.7% | Asia-Pacific core, spill-over to North America | Long term (≥ 4 years) |
| Green communications mandates for energy-harvesting THz radios | +6.9% | EU leading, global adoption following | Long term (≥ 4 years) |
| Source: Mordor Intelligence | |||
Exploding Data Demand and Ultra-Low Latency Use-Cases
Terabit-class extended-reality workloads now exceed 100 Gbps, forcing operators to redesign back-haul and fronthaul topologies.[2]University of Adelaide Researchers, “280 Gbps Terahertz Link Demonstration,” Adelaide.edu.au, adelaide.edu.au NTT DOCOMO’s 2024 lab trials delivered 280 Gbps in the terahertz band, validating spectral maturity for industrial digital twins and holographic conferencing. In manufacturing, John Deere’s low-latency private network improved predictive maintenance cycles and robotic coordination, setting a benchmark for 6G in Industry 4.0 settings. Healthcare demands are equally stringent; telesurgery demos over 5G at a 99-millisecond round-trip have already shaped the performance baseline for 6G medical links. AI model training at the edge compounds throughput pressure because large parameter updates must synchronise across thousands of nodes in real time, making deterministic latency a pre-requisite for distributed learning.
AI-Enabled Edge and IoT Device Proliferation
NVIDIA’s AI Aerial platform brings real-time machine-learning inference into the radio layer, driving a network-wide shift toward distributed intelligence.[3]NVIDIA Corporation, “AI Aerial Platform Overview,” Nvidia.com, nvidia.coM Lightweight transformer models now generate 5–12 tokens per second on Raspberry Pi clusters, underscoring the feasibility of local inference without cloud dependency. As global IoT endpoints approach 75 billion by 2030, energy-harvesting radios using ambient RF are essential for battery-free operation, underpinning continuous connectivity models ResearchGate. Edge computing cuts long-haul traffic but heightens reliability needs, since millions of autonomous devices must reach consensus in microseconds to collaborate safely in real-world environments.
Government R&D Grants and Early Spectrum Policies
Public funding reduces commercial risk and speeds standards convergence. The U.S. Public Wireless Supply Chain Innovation Fund awarded USD 420 million to advance open RAN and AI-based spectrum management.[4]NTIA Team, “Public Wireless Supply Chain Innovation Fund Awards,” U.S. Department of Commerce, ntia.govThe European Union matched that ambition with EUR 500 million (USD 565 million) for 6G research via the Smart Networks and Services Joint Undertaking. Globally, regulators are aligning on the ITU IMT-2030 framework, which earmarks contiguous blocks in the sub-THz and THz ranges for harmonised licensing. Defence agencies add momentum: the U.S. Air Force Research Lab is prototyping distributed sensor fusion that depends on 6G-grade bandwidth and security layers.
Integration with Non-Terrestrial / Satellite Networks
Satellite-augmented 6G promises continuous global coverage. China’s February 2024 test satellite validated multi-band payloads that bridge LEO and terrestrial radios. The upcoming 6GStarLab CubeSat mission will evaluate optical-to-RF hand-offs crucial for in-orbit back-haul arXiv. Direct-to-device links circumvent tower build-outs in remote regions, enabling smart-farming fleets and maritime IoT. John Deere’s tie-up with SpaceX illustrates how precision agriculture benefits from always-on orbital connectivity. Multi-layer constellations that mix LEO with GEO satellites spread risk and improve resilience during terrestrial outages MDPI.com
Restraints Impact Analysis*
| Restraint | (~) % Impact on CAGR Forecast | Geographic Relevance | Impact Timeline |
|---|---|---|---|
| Multi-billion-dollar THz infrastructure and back-haul CAPEX | -15.3% | Global, acute in developing markets | Short term (≤ 2 years) |
| Spectrum allocation uncertainty in sub-THz and THz bands | -12.7% | Worldwide regulatory challenge | Medium term (2–4 years) |
| Public-health pushback on continuous THz exposure | -8.4% | EU and North America | Long term (≥ 4 years) |
| Compound-semiconductor (InP, GaN) supply-chain bottlenecks | -11.9% | Global, concentrated in Asia-Pacific | Short term (≤ 2 years) |
| Source: Mordor Intelligence | |||
Multi-Billion-Dollar THz Infrastructure and Back-Haul CAPE
Capital intensity is the primary headwind. Operators are trimming spend after heavy 5G roll-outs, prioritising software overlays before green-lighting dense THz small-cell grids. Terahertz propagation limits demand more base stations per square kilometre than 5G, pushing site-acquisition and power costs upward. Open RAN reduces vendor lock-in yet raises integration complexity, delaying return on investment MDPI. Cloud-native cores spread cost over time by shifting from capital expenditure to consumption-based models, but the financial benefit only materialises once adoption scales.
Spectrum Allocation Uncertainty in Sub-THz and THz Bands
Sub-THz and THz bands are still under regional review, creating planning risk for equipment makers and operators. The U.S. National Spectrum Strategy promotes dynamic sharing, but final power-flux limits remain unsettled. Differences across ITU regions complicate device certification, raising production costs and prolonging time-to-market. Without predictable licensing frameworks, vendors hesitate to commit silicon roadmaps for the 300-GHz class, which in turn slows economies of scale for end-user devices.
*Our forecasts treat driver/restraint impacts as directional, not additive. The impact forecasts reflect baseline growth, mix effects, and variable interactions.
Segment Analysis
By Devices: IoT Edge Drives Growth
The mobile segment commanded 46% of 6G market share in 2024 on the back of smartphone dominance, but IoT and edge devices are expanding at a sector-leading 73.22% CAGR, underscoring a shift toward machine-centric traffic patterns. Rising shipments of fixed wireless access units enable rural households to achieve fibre-like speeds, creating an interim revenue stream for operators before handheld mass adoption.
Edge devices embed local AI chips that prune data at the source, improving spectral efficiency without sacrificing insight accuracy. X-MIMO prototypes in the 7 GHz band from Samsung demonstrate how handset antenna innovations will offset high-frequency path loss in urban canyons. Meanwhile, ruggedised industrial sensors and vehicle communication modules add resilience features such as built-in energy harvesters, widening use-case diversity.
The proliferation of autonomous drones, agricultural robots, and AR headsets increases node density by orders of magnitude, driving incremental infrastructure requirements. Enterprise demand for private 6G networks, often anchored by IoT gateways, positions device diversity as both a technical challenge and a revenue multiplier for service providers. As AI workloads migrate to the edge, firmware updates and security patches will account for a growing share of traffic, reinforcing the primacy of zero-touch device-management platforms.


By Component: Software Acceleration Dominates
Hardware still represented 54% of the 6G market size in 2024, covering radio front-ends, phased-array antennas, and compound-semiconductor chipsets. However, the software stack is scaling at 77.10% CAGR as operators deploy cloud-native cores and AI-driven orchestration that permit over-the-air feature activation without hardware swaps.
Open RAN splits baseband and radio functions, allowing software vendors to iterate on scheduling, beamforming, and network slicing. NVIDIA’s AI Aerial suite illustrates how real-time reinforcement-learning agents optimise cell throughput in milliseconds by tuning modulation schemes on the fly. Service segments—covering planning, integration, and lifecycle management—benefit from recurring revenue as carriers move to subscription pricing for network functions.
Compound-semiconductor advances remain critical for power efficiency in terahertz power amplifiers. Yet value is tilting toward algorithmic control that extracts more capacity from each hertz. Consequently, vendor differentiation hinges on update velocity, not silicon lead-time, reconfiguring ecosystem alliances among traditional equipment makers, hyperscalers and software start-ups.
By End-User Vertical: Healthcare Emerges as Growth Leader
Automotive and transportation held 27% of 6G market share in 2024 thanks to maturing vehicle-to-everything stacks and regulatory tailwinds on advanced driver-assistance systems. Ultra-reliable low-latency links enable cooperative manoeuvres, intersection-collision avoidance and tele-operation for logistics fleets.
In contrast, healthcare applications are forecast to grow at 72.45% CAGR through 2030 as hospitals migrate from proof-of-concept remote surgeries over 5G to full holographic telepresence. High-resolution imaging and haptic feedback demand deterministic latency below 1 ms, making them flagship showcases for the 6G market. Smart factories trail close behind, harnessing digital twins for predictive quality control, while agriculture leverages orbital coverage to automate fields beyond terrestrial reach.
Public-safety agencies adopt network slicing to prioritise first-responder traffic during crises, extending advanced coverage to underground or high-rise locations that stump legacy systems. Media and entertainment studios experiment with volumetric capture, streaming photorealistic avatars to consumers in real time. Each vertical amplifies the business case for multi-tenant architectures that monetise the same physical infrastructure across divergent service-level agreements.
By Frequency Band: Terahertz Future Potential
Sub-terahertz bands between 100 GHz and 300 GHz secured 71% of deployments in 2024 as they strike a balance between bandwidth and manageable propagation. Early equipment leverages legacy E-band design expertise, accelerating time-to-market while fulfilling gigabit user-experience targets.
Terahertz bands above 300 GHz promise 10× capacity gains and native sensing use-cases, from indoor positioning to material analysis, and are projected to grow at 76.15% CAGR. Samsung Research highlights the 7–24 GHz “upper mid-band” as a bridge spectrum that yields both wide-area coverage and ample bandwidth, ideal for first wave commercialisation.
Regulators are harmonising allocations under the ITU IMT-2030 blueprint, fostering global roaming and lowering device costs through unified front-end designs. Still, atmospheric attenuation and line-of-sight constraints mean terahertz deployment will concentrate in dense hotspots, complemented by sub-THz macro-layer coverage. Vendors are therefore engineering hybrid radios capable of seamless band-hopping, ensuring service continuity as users traverse varying propagation environments.
Geography Analysis
Asia-Pacific led with 36% of the 6G market in 2024 and is scaling fastest at a 74.08% CAGR through 2030. China launched the first 6G test satellite in 2024, while South Korea’s public-private roadmap aims for commercial 6G in 2028. Japan’s Beyond 5G Promotion Consortium has already demonstrated terahertz transmissions above 100 Gbps, underscoring the region’s integrated device-fabrication and field-trial ecosystem. Dense urban clusters reduce per-capita infrastructure cost and create early-adopter revenue pools that further accelerate investment cycles.
North America benefits from substantial federal grants and cloud-native leadership. The USD 420 million federal innovation fund catalyses open-source RAN deployments, giving domestic vendors a seat at the standards table. Silicon Valley’s AI leadership positions U.S. firms to define network-intelligence frameworks, though reliance on imported gallium and indium phosphide chips remains a supply-chain weak spot. Cross-border spectrum alignment with Canada and Mexico narrows roaming gaps and enlarges the addressable subscriber base.
Europe channels policy energy into sustainability and harmonised regulation. The Smart Networks and Services Joint Undertaking deploys EUR 500 million to nurture green radios and energy-harvesting devices. Germany and the United Kingdom spearhead testbeds for satellite-terrestrial networks, while France and Italy exploit aerospace expertise to refine optical inter-satellite links. Fragmented national rules slow pan-European roll-outs, yet common research agendas and roaming directives mitigate divergence. The Middle East and Africa, though smaller today, rely on LEO satellite back-haul to leapfrog fibre gaps, positioning those regions for rapid catch-up once handset prices fall below mass-market thresholds.

Competitive Landscape
The 6G market is moderately fragmented, split between incumbent equipment makers and AI-native insurgents. Ericsson, Nokia, and Samsung capitalise on 5G installed bases, monetising upgrade paths that reuse existing sites and backhaul. Their patent troves and systems-integration scale underpin multi-year supply agreements with global operators.
Disruptors such as NVIDIA, bolstered by partnerships with T-Mobile and Cisco, inject AI accelerators directly into baseband cards, turning packet scheduling into a machine-learning challenge. These alliances blur the line between telecoms and cloud, with hyperscalers hosting carrier-grade cores to offer network-as-a-service. Patent filings for extended-reality codecs and intelligent reconfigurable surfaces are rising sharply, signalling a future battlefront around immersive content delivery.
Start-ups occupy niches in reconfigurable intelligent surfaces, energy-harvesting sensor nodes, and satellite-edge gateways. Their agility attracts incumbents seeking bolt-on innovation without rebuilding R&D pipelines. Semiconductor suppliers such as Qualcomm, Broadcom, and MediaTek race to sample prototype chipsets on gallium nitride substrates, emphasising power efficiency for battery-sensitive devices. Test-equipment vendors Keysight Technologies and Rohde & Schwarz validate terahertz links, shortening certification cycles and lowering entry barriers for newcomers.
6G Industry Leaders
AT&T
Broadcom
Cisco
Ericsson
Google
- *Disclaimer: Major Players sorted in no particular order

Recent Industry Developments
- June 2025: Ericsson and Google Cloud introduced a carrier-grade 5G Core-as-a-Service platform with AI optimisation.
- March 2025: NVIDIA partnered with T-Mobile, MITRE and Cisco to build AI-native wireless networks for 6G.
- March 2025: Samsung Electronics and KT Corporation signed an MoU to co-develop X-MIMO technology in the 7 GHz band.
- March 2025: Ericsson and SoftBank formed an alliance to integrate AI across future network layers.


Research Methodology Framework and Report Scope
Market Definitions and Key Coverage
Our study defines the global 6G market as revenues generated from the sale of hardware, software, and related services that enable sixth-generation wireless connectivity at sub-THz and THz frequencies for mobile devices, IoT and edge devices, fixed-wireless CPE, and network infrastructure. The baseline year is 2025, before the first commercial rollouts, and the forecast horizon extends to 2030.
Scope exclusion: Experimental research grants and pure academic prototypes that never enter commercial supply chains have been left out.
Segmentation Overview
- By Devices
- Mobile Devices
- IoT and Edge Devices
- Fixed Wireless Access CPE
- Network Infrastructure Equipment
- Other Devices
- By Component
- Hardware
- Software
- Services
- By End-user Vertical
- Automotive and Transportation
- Manufacturing and Industrial
- Healthcare and Life Sciences
- Agriculture and Smart Farming
- Government and Public Safety
- Media and Entertainment
- Other Verticals
- By Frequency Band
- Sub-terahertz (sub-THz) (100-300 GHz)
- Terahertz (above 300 GHz)
- By Geography
- North America
- United States
- Canada
- Mexico
- South America
- Brazil
- Argentina
- Rest of South America
- Europe
- Germany
- United Kingdom
- France
- Italy
- Spain
- Russia
- Rest of Europe
- Asia Pacific
- China
- Japan
- South Korea
- India
- Australia
- Rest of Asia Pacific
- Middle East and Africa
- Saudi Arabia
- United Arab Emirates
- South Africa
- Rest of Middle East and Africa
- North America
Detailed Research Methodology and Data Validation
Primary Research
Mordor analysts interviewed chipset architects, satellite back-haul providers, and strategy leads at Tier-1 operators across North America, Asia Pacific, and Europe. Structured surveys with emerging-market regulators and automotive OEM connectivity teams validated assumed adoption curves, latency targets, and likely average selling prices.
Desk Research
We started with public datasets from bodies such as the ITU, ETSI, 3GPP releases, and national regulators, which quantify spectrum allocations and pilot licensing. Patent analytics from Questel and import-export shipment counts from Volza helped us gauge early hardware volumes. Analyst teams layered insights from white papers released by leading telecom associations, filings to the FCC and the European Commission, and quarterly presentations of network equipment vendors. Company 10-Ks, investor days, and reputable media archives accessed through Dow Jones Factiva supplied cost benchmarks and R&D timelines. The sources cited here are illustrative, not exhaustive; many others informed data collection, cross-checks, and clarification.
Market-Sizing & Forecasting
A blended top-down build that reconstructs addressable demand from mobile subscription counts, connected-device penetration, and spectrum auction outlays anchors the 2025 base. Results are corroborated through selective bottom-up checks on pilot site counts, sampled ASP × unit volumes, and edge-cloud capacity roll ups. Key variables include sub-THz base-station cost declines, government R&D spend, non-terrestrial network launch schedules, spectrum pricing, and expected device replacement cycles. A multivariate regression with ARIMA overlays projects 2026-2030 values; expert panels review each driver weight. Where supplier roll-ups show gaps, interpolation uses regional averages adjusted for purchasing-power parity before final reconciliation.
Data Validation & Update Cycle
Outputs pass anomaly checks against independent indicators such as patent filings, chipset tape-outs, and satellite payload bookings. Senior reviewers sign off after variance analysis. The database refreshes annually, and mid-cycle updates follow material events like spectrum auctions; before release, an analyst performs a fresh sense-check so clients receive the latest view.
Why Mordor's 6G Baseline Deserves Stakeholder Confidence
Published estimates often differ because each firm sets unique scope boundaries, adoption assumptions, and currency conversions.
Key gap drivers include whether pre-commercial prototypes are counted, if device ASP erosion is linear or stepwise, and how aggressively non-terrestrial revenues are baked in. Mordor reports only commercializable units, applies moderated ASP compression informed by operator capex guidance, and refreshes the model yearly; others may project from R&D spend, lock a static exchange rate, or skip validation interviews.
Benchmark comparison
| Market Size | Anonymized source | Primary gap driver |
|---|---|---|
| USD 0.26 B | Mordor Intelligence | - |
| USD 7.99 B | Global Consultancy A | Includes government R&D grants and interim lab prototypes |
| USD 8.30 B | Trade Journal B | Uses unverified device ASPs and omits currency realignment |
| USD 9.48 B | Industry Association C | Counts satellite launch services and forward projects to 2025 without rollout discount |
In summary, our disciplined scope, transparent variables, and annual refresh cadence give decision-makers a balanced baseline that can be traced back to verifiable signals and reproduced with clear, repeatable steps.


Key Questions Answered in the Report
What is the projected value of the 6G market in 2030?
The 6G market is forecast to reach USD 3.88 billion by 2030, growing at a 72.6% CAGR from 2025.
Which region leads current 6G adoption?
Asia-Pacific holds 36% of global revenue in 2024 and is expanding fastest at a 74.08% CAGR through 2030.
Why is software growing faster than hardware in the 6G ecosystem?
AI-native orchestration and cloud-native cores let operators add new features via software updates, driving a 77.10% CAGR for the software segment versus slower growth for hardware.
How will satellite networks influence 6G deployment?
Non-terrestrial networks extend coverage to remote areas, enable direct-to-device connectivity and provide redundancy during terrestrial outages, adding +11.3% to the forecast CAGR.
Which end-user vertical is expected to grow quickest?
Healthcare applications lead growth at a 72.45% CAGR owing to latency-sensitive use-cases like remote robotic surgery and high-resolution medical imaging.
What are the key barriers to widespread 6G rollout?
High terahertz infrastructure costs and unresolved spectrum policies in the sub-THz and THz ranges remain the main obstacles, imposing negative impacts of 15.3% and 12.7% on the forecast CAGR, respectively.
Page last updated on:


