
Technology, Media and Telecom
5th MayPricing Strategy for Semiconductor Components
3 Min Read
The Telecom Services Market Report is Segmented by Service Type (Voice Services [Wired and Wireless], Data and Messaging Services [Mobile Data Services and Fixed Data Services], and Pay TV Services and Over-The-Top [OTT] Services), Transmission (Wired and Wireless), End-User (Consumer and Business [Manufacturing, Energy and Utilities, Transportation and Logistics, Public Sector, and More]), and Geography.
Market Overview
| Study Period | 2019 - 2030 |
|---|---|
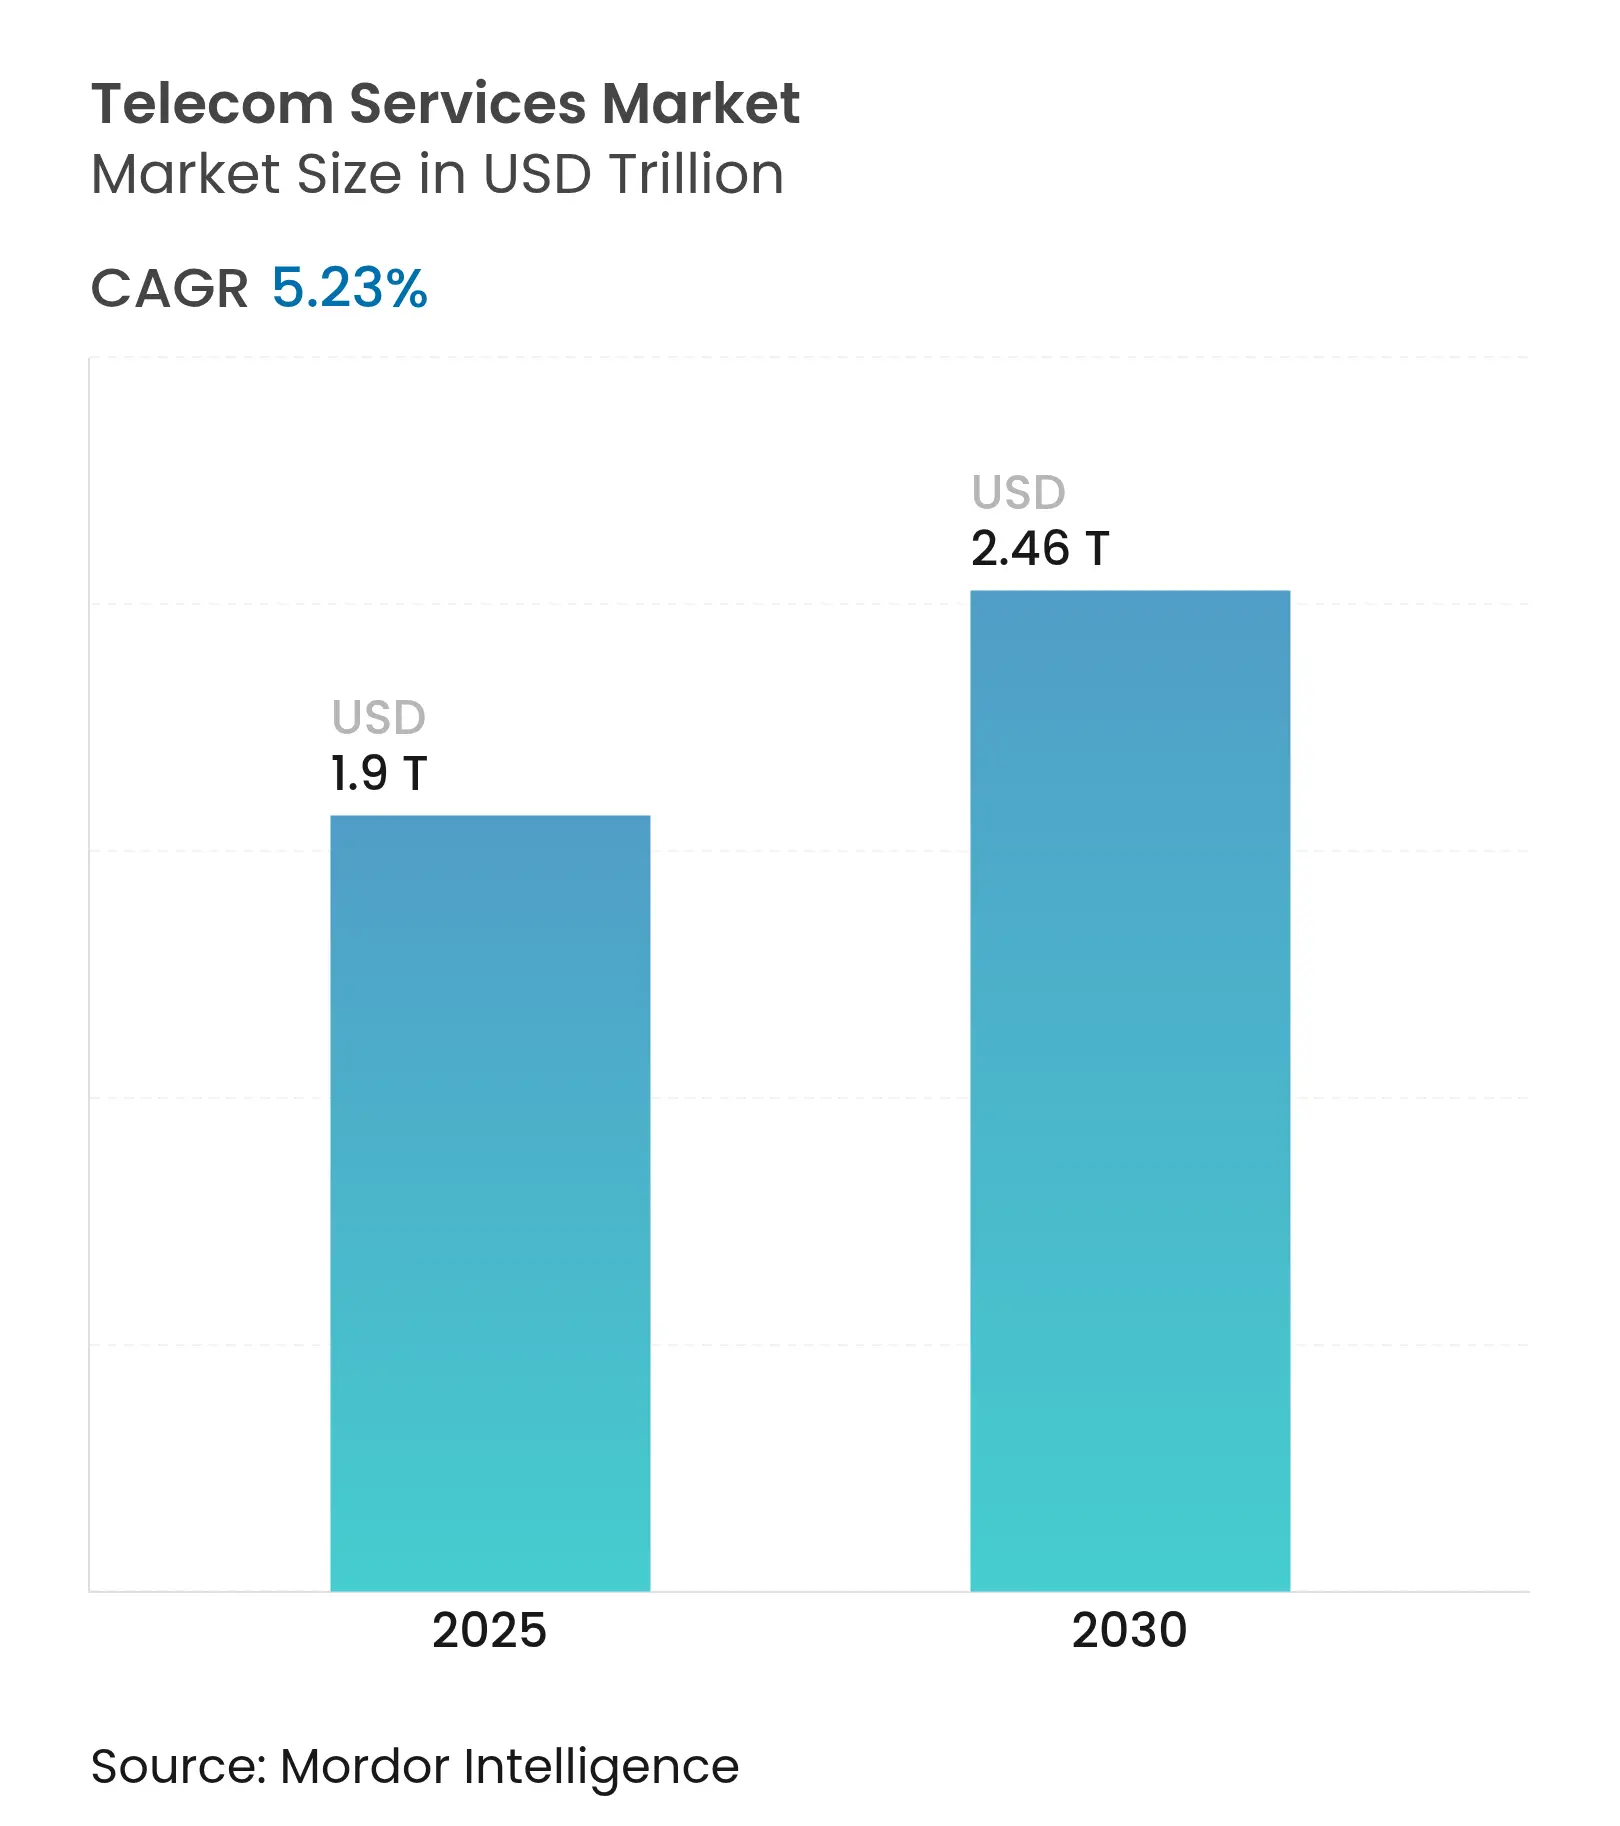
| Market Size (2025) | USD 1.9 Trillion |
| Market Size (2030) | USD 2.46 Trillion |
| Growth Rate (2025 - 2030) | 5.23 % CAGR |
| Fastest Growing Market | Asia Pacific |
| Largest Market | Asia Pacific |
| Market Concentration | Medium |
Major Players *Disclaimer: Major Players sorted in no particular order. Image © Mordor Intelligence. Reuse requires attribution under CC BY 4.0. |
Operators are widening revenue streams beyond connectivity by commercializing AI-optimized network slicing and private 5G solutions for enterprise digitization. Demand for industrial-grade private 5G from automakers such as Toyota and BMW underpins the market’s resilience, while hyperscale investments in subsea “express” fiber corridors support rising AI and edge-computing traffic. Asia-Pacific leads with 40.18% market share and the highest regional CAGR at 6.66%, propelled by aggressive 5G rollouts and rapid IoT adoption. Wireless voice remains the largest service type at 51.74% share, but fixed data services are expanding fastest at 7.30% CAGR as enterprises pivot to fiber-based connectivity. Competition has intensified as cloud providers extend edge offerings, pushing operators to differentiate through AI-enhanced capabilities that Ericsson values at USD 200 billion in incremental revenue potential.
Key Report Takeaways
Drivers Impact Analysis
| Driver | (~) % Impact on CAGR Forecast | Geographic Relevance | Impact Timeline | |||
|---|---|---|---|---|---|---|
Mobile-internet and smartphone penetration surge Mobile-internet and smartphone penetration surge | +1.20% | Global, strongest in Asia-Pacific, and Africa | Medium term (2-4 years) | (~) % Impact on CAGR Forecast:+1.20% | Geographic Relevance:Global, strongest in Asia-Pacific, and Africa | Impact Timeline:Medium term (2-4 years) |
Rapid 5G/FWA rollouts lifting ARPU Rapid 5G/FWA rollouts lifting ARPU | +1.80% | North America, Europe, Asia-Pacific | Short term (≤ 2 years) | |||
Enterprise digitization and IoT connectivity demand Enterprise digitization and IoT connectivity demand | +1.50% | Global, led by North America and Europe | Long term (≥ 4 years) | |||
Industrial-campus private 5G uptake Industrial-campus private 5G uptake | +0.90% | North America, Europe, Japan, South Korea | Medium term (2-4 years) | |||
| Source: Mordor Intelligence | ||||||
Mobile-Internet and Smartphone Penetration Surge
Average monthly mobile data usage in the Gulf Cooperation Council reached 30 GB per device in 2024, underscoring how rising smartphone adoption reshapes consumption profiles. The GSMA projects 2.1 billion unique mobile subscribers in Asia-Pacific by 2030, with mobile technologies adding USD 880 billion to regional GDP[1]GSMA, “The Mobile Economy Asia Pacific 2024,” gsma.com. Rapid penetration stimulates a multiplier effect as each new subscriber consumes voice, data, and value-added services, accelerating revenue growth in emerging markets.
Rapid 5G/FWA Rollouts Lifting ARPU
Ericsson estimates that under-utilized spectrum still exceeds 80% in many operator portfolios, enabling Fixed Wireless Access (FWA) to monetize idle assets while raising blended ARPU. T-Mobile’s commercial FWA offering illustrates momentum, having added hundreds of thousands of subscribers quarterly and targeting 7–8 million customers by 2025. In spectrum-constrained India, FWA growth complements limited fixed broadband coverage, widening addressable revenue pools for operators.
Enterprise Digitization and IoT Connectivity Demand
Private 5G deployments at Cummins and Tesla showcase how ultra-reliable connectivity supports autonomous vehicles and predictive maintenance on factory floors. Enterprises increasingly demand integrated connectivity, edge computing,Wired and AI analytics, lifting the business segment’s 8.23% CAGR. Verizon’s alliance with NVIDIA demonstrates operators’ shift from connectivity resellers to full-stack technology enablers.
Industrial-Campus Private-5G Uptake
BMW’s dedicated networks deliver microsecond latency for real-time quality control, highlighting the operational advantage of private 5G. Falling equipment costs and standardized architectures from vendors such as Ericsson and Nokia accelerate adoption, aligning with broader Industry 4.0 initiatives that integrate robotics, sensors, and analytics over ultra-reliable low-latency links.
Restraints Impact Analysis
| Restraint | (~) % Impact on CAGR Forecast | Geographic Relevance | Impact Timeline | |||
|---|---|---|---|---|---|---|
Intense price wars and SIM-only churn Intense price wars and SIM-only churn | -1.40% | Global, acute in mature markets | Short term (≤ 2 years) | (~) % Impact on CAGR Forecast:-1.40% | Geographic Relevance:Global, acute in mature markets | Impact Timeline:Short term (≤ 2 years) |
Rising spectrum auction and renewal costs Rising spectrum auction and renewal costs | -0.80% | Europe and North America | Medium term (2-4 years) | |||
| Source: Mordor Intelligence | ||||||
Intense Price Wars and SIM-Only Churn
The completion of the GBP 16 billion Vodafone–Three UK merger signals consolidation to counter aggressive pricing that erodes margins. SIM-only plans weaken upgrade cycles and accelerate churn, particularly in India, where Reliance Jio’s low tariffs pressure rivals. Operators respond with convergence strategies; Verizon’s planned integration of Frontier’s fiber assets aims to lower churn through bundled offers.
Rising Spectrum Auction and Renewal Costs
Global spectrum auctions surpassed USD 80 billion in 2024, creating mounting debt burdens for operators[2]Canadian Radio-television and Telecommunications Commission, “Communications Monitoring Report 2025,” crtc.gc.ca. AT&T’s USD 1 billion spectrum acquisition from UScellular illustrates how renewal costs trigger industry consolidation. High license fees divert capital from 5G stand-alone upgrades, slowing innovation and lengthening payback periods on new network investments.
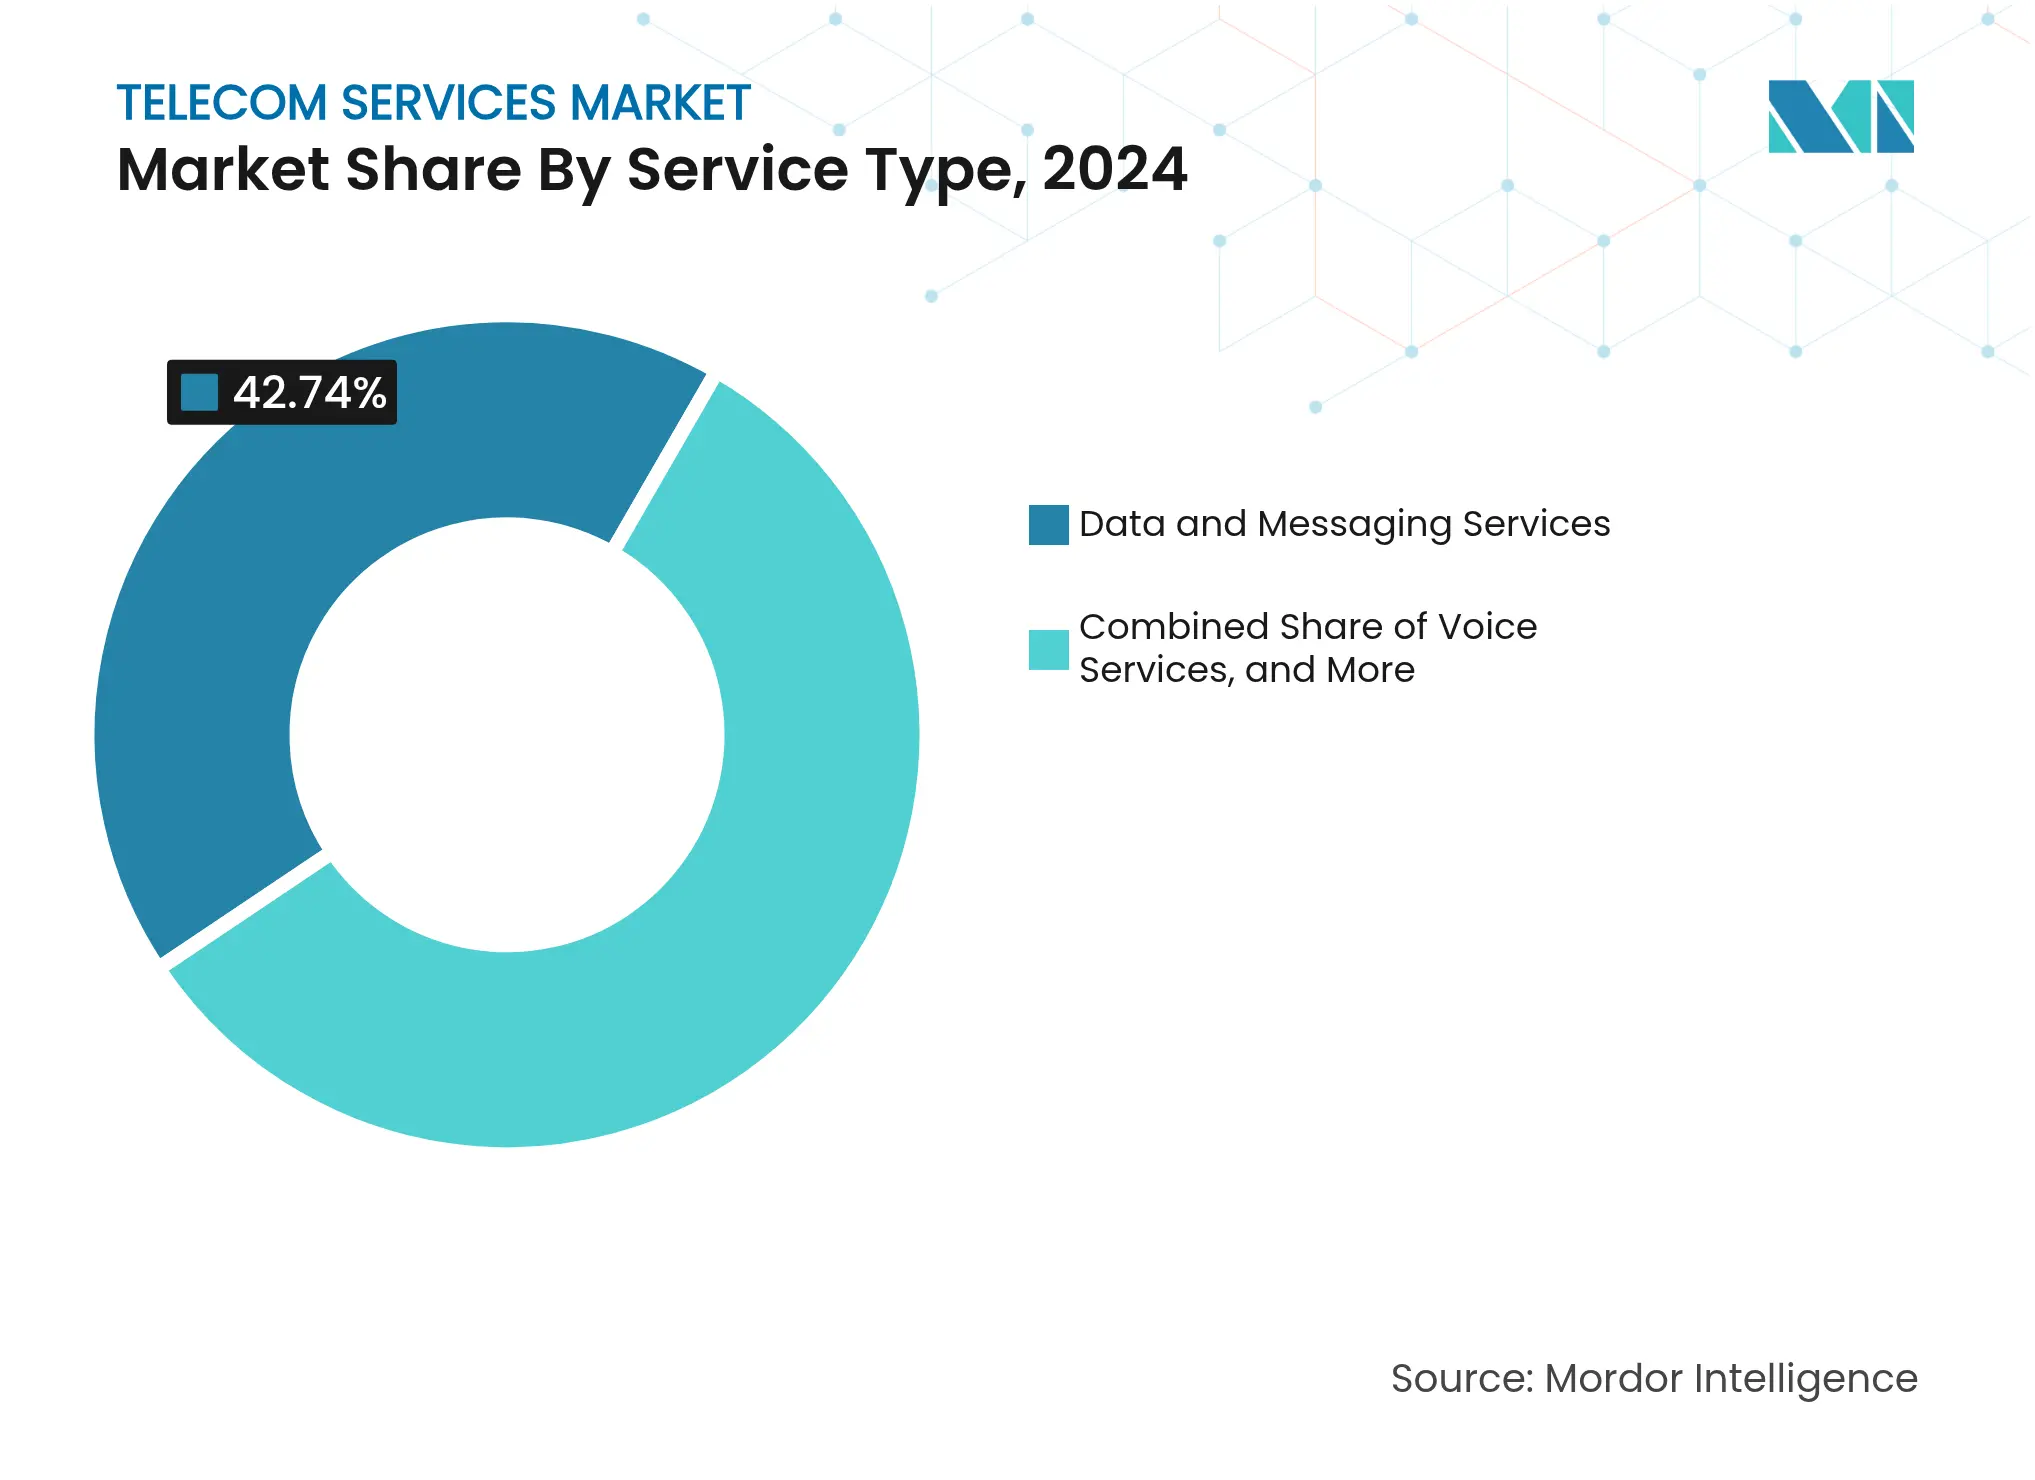
By Service Type: Voice Services Face Structural Decline
Data and Messaging services accounted for 42.74% of the telecom services market share in 2024. Pay TV and Over-the-Top (OTT) services are expanding at a 7.30% CAGR through 2030 as mobile data growth accelerates with 5G-enabled applications that demand higher throughput.
Traditional voice revenue erosion is deepening as unified communications platforms integrate voice, video, and messaging over IP at lower cost and with added analytics. Operators are countering by embedding voice into application programming interfaces (APIs) for developers, preserving relevance even as standalone voice minutes shrink. Pay-TV continues to lose share to direct-to-consumer streaming, prompting operators to reposition video as an aggregated service within converged bundles that combine broadband, mobility, and entertainment.
Note: Segment shares of all individual segments available upon report purchase
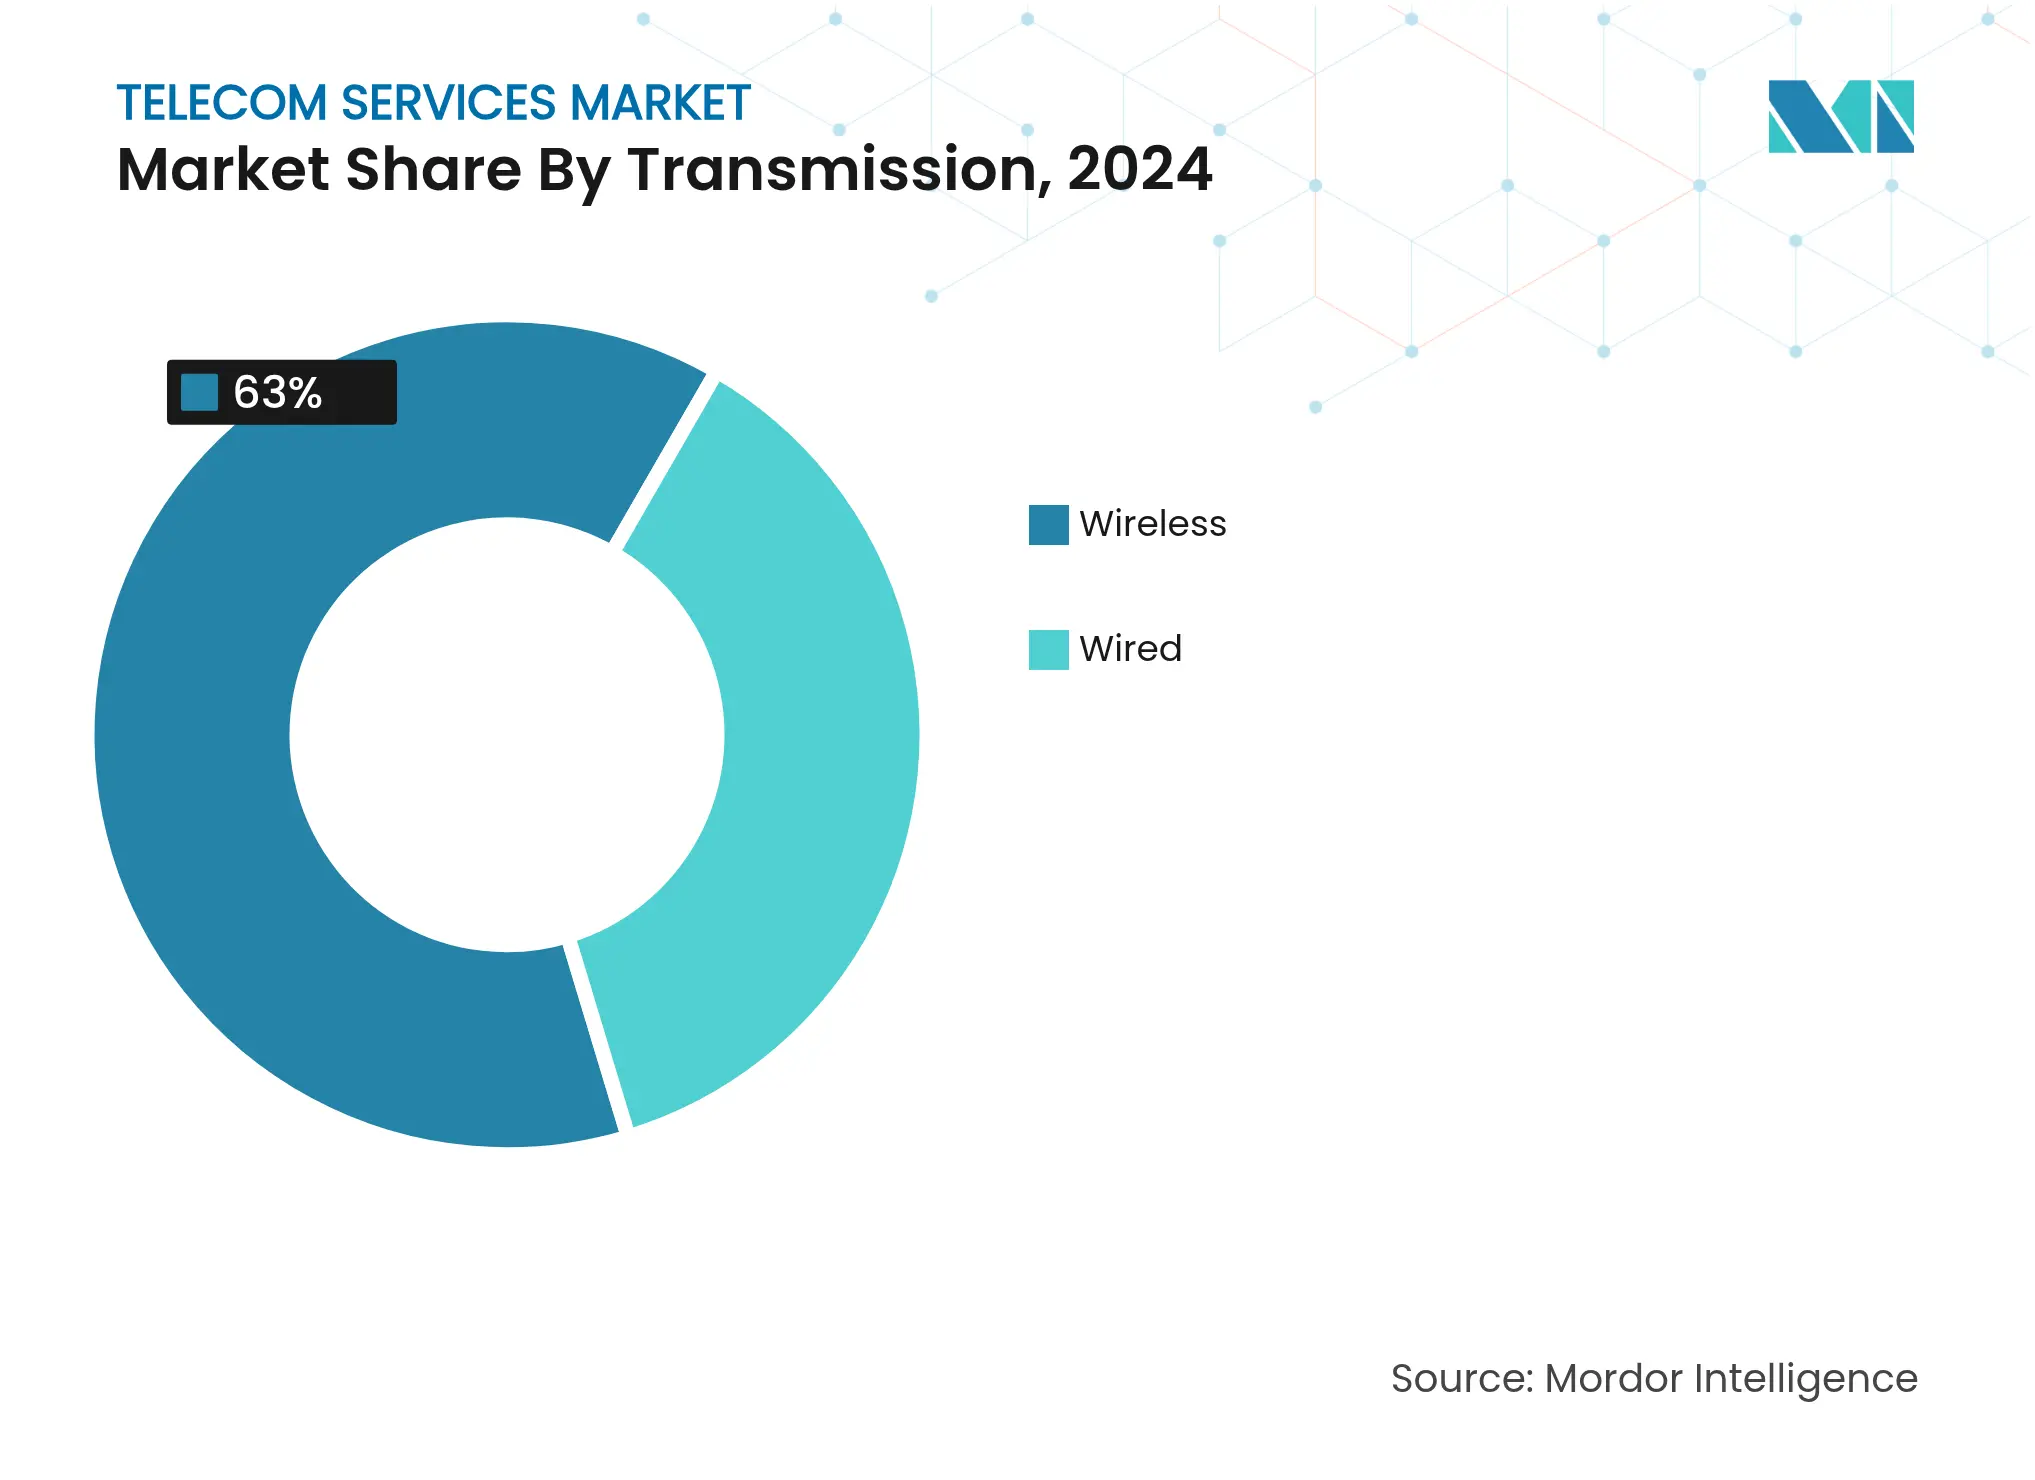
By Transmission: Fiber Optic Networks Drive Infrastructure Investment
Wireless transmission held 63% share of the telecom services market in 2024, buoyed by 5G rollouts and FWA household adoption. Fiber, however, posts the fastest expansion at 6.25% CAGR because enterprises and hyperscalers require symmetrical bandwidth and millisecond-class latency for AI training and cloud interconnects.
Operators are accelerating fiber rollouts both for consumer broadband and for 5G backhaul. Verizon’s USD 20 billion agreement to acquire Frontier adds 2.2 million fiber premises, underscoring the strategic pivot toward converged fixed-mobile propositions. Satellite connectivity is beginning to complement terrestrial networks as a resilience layer for remote sites, yet the investment priority remains squarely on fiber because of its virtually unlimited capacity and superior cost-per-bit economics.
By End-User: Business Segment Drives Premium Revenue Growth
Consumer services represented 33.12% of the telecom services market share in 2024, but incremental growth is limited in saturated markets. The business segment is on an 8.23% CAGR trajectory as enterprises seek guaranteed performance through managed private 5G, edge computing, and security services.
Manufacturing tops demand for private networks to automate production and enable predictive maintenance. Healthcare is deploying IoT sensors for remote monitoring, while utilities use dedicated spectra for smart-grid control. These mission-critical applications justify premium pricing, lifting average revenue per account and lengthening contract terms. Operators are bundling connectivity with cloud and analytics, pivoting from volume-driven consumer models to value-centric enterprise partnerships.
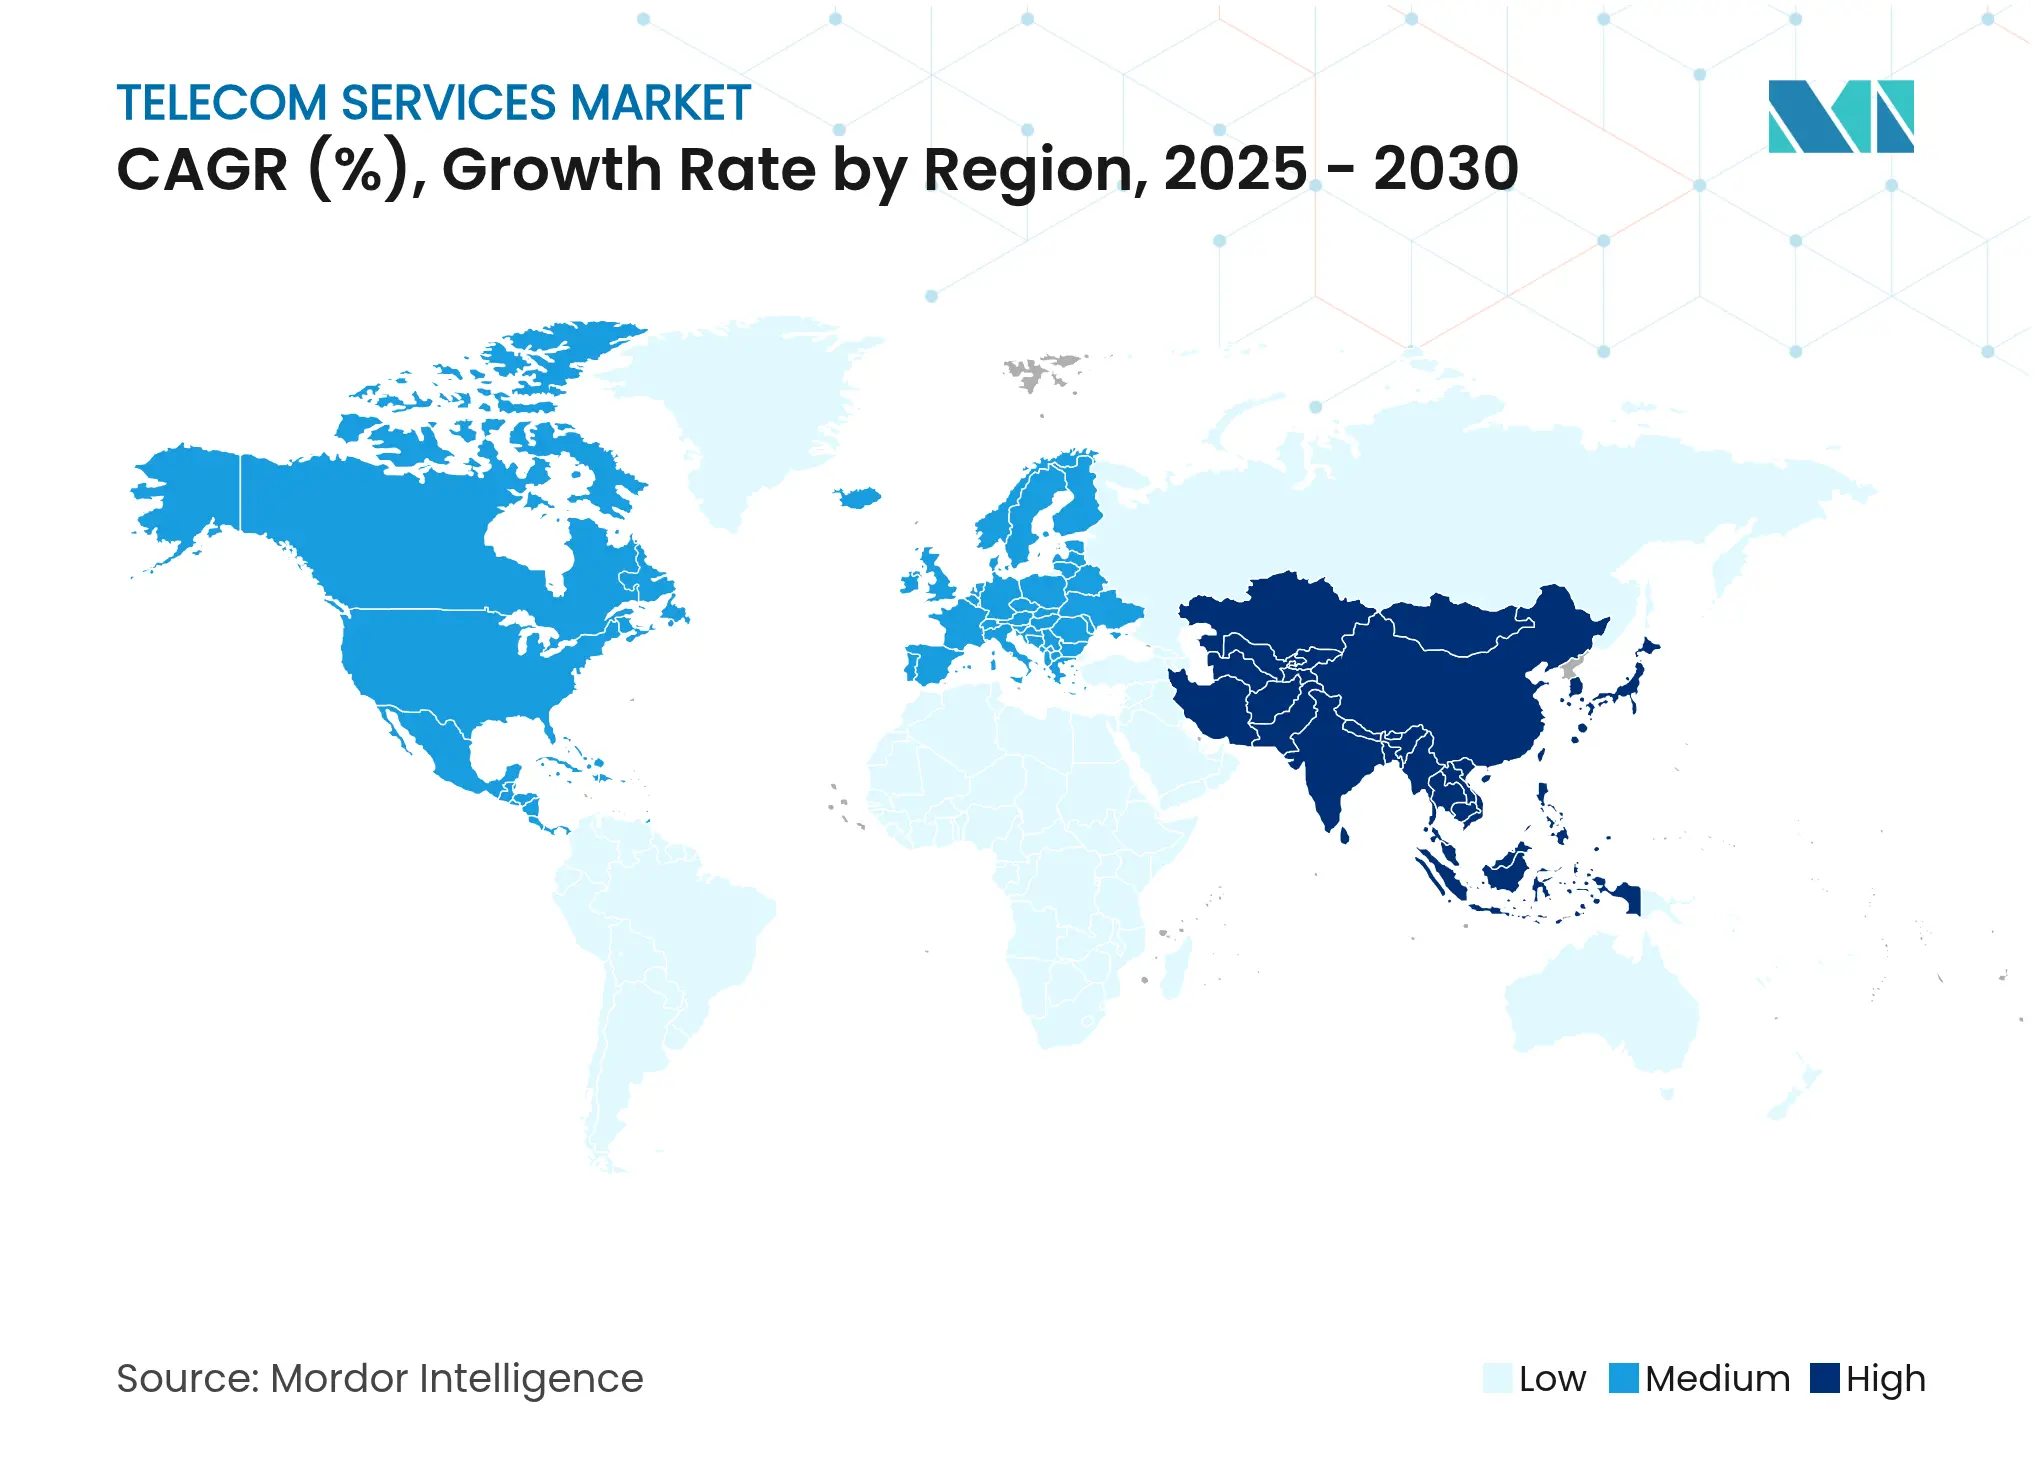
Asia-Pacific dominated the telecom services market with 40.18% share in 2024 and is growing at 6.66% CAGR to 2030, driven by China, India, and Southeast Asia adopting 5G and IoT at scale. GSMA counts 2.1 billion unique mobile subscribers by 2030 and credits mobile technologies with contributing USD 880 billion to regional GDP. Aggressive spectrum allocations and supportive infrastructure-sharing policies foster cost-efficient rollouts. China expects 88% of mobile subscriptions on 5G by 2028, while India’s FWA market is expanding rapidly in areas lacking fixed broadband, unlocking new revenue for operators.
North America exhibits mature dynamics yet continues to post solid growth through fiber expansion and enterprise 5G uptake. Verizon’s Frontier acquisition and T-Mobile’s planned UScellular deal reflect a convergence push that combines wireless and fixed assets to stabilize churn and raise ARPU. Fixed Wireless Access could top 20 million subscribers by 2028, but spectrum capacity ceilings will influence long-term momentum. Regulatory focus centers on consumer protection and security, with the FCC enforcing stricter robocall prevention and network resiliency measures.
Europe faces investment inefficiencies due to market fragmentation, hosting more than 40 mobile network operators that struggle to achieve scale economies. The connectivity sector contributes 4.7% to regional GDP, yet telecom investment declined 2% in 2023 for the first time in seven years. The completed Vodafone–Three UK merger targets GBP 700 million in yearly synergies and signals a broader consolidation wave meant to boost capital returns. Sustainability remains a priority; Deutsche Telekom and Google Cloud cut network energy use by 30% through AI-driven optimization. Latin America and the Middle East & Africa are emerging growth pockets, supported by América Movil’s USD 7.7 billion Brazilian investment plan and Gulf operators earmarking 61% of capex for 5G-related projects.
Market Concentration
The telecom services market is moderately consolidated. Operators pursue vertical integration to counter hyperscale competition and diversify earnings. Large network owners are buying fiber wholesalers and tower portfolios to create converged offerings that improve customer retention. Verizon’s Frontier deal and T-Mobile’s regional fiber acquisitions exemplify this trend.
Monetizing AI-optimized network slicing is a priority. Ericsson forecasts USD 200 billion in new revenue as operators create dedicated virtual networks tailored to enterprise latency and security requirements. Collaboration is increasing; Deutsche Telekom, SK Telecom, e&, Singtel, and SoftBank formed the Global Telco AI Alliance to co-develop use-cases, share data sets, and pool capex. Meanwhile, hyperscalers expand edge clouds adjacent to operator points of presence, pressuring incumbents to open their networks through standardized APIs.
Open Radio Access Network (Open RAN) adoption is another axis for competition. Disaggregated architecture promises vendor diversity and lower total cost of ownership, but it introduces integration complexity that favors experienced system integrators. Operators are therefore forming multivendor test beds to validate performance ahead of nationwide rollouts. Satellite LEO constellations create further disruption, offering low-latency global coverage and forcing terrestrial operators to evaluate partnership versus competition strategies.

*Disclaimer: Major Players sorted in no particular order
1. INTRODUCTION
2. RESEARCH METHODOLOGY
3. EXECUTIVE SUMMARY
4. MARKET LANDSCAPE
5. MARKET SIZE AND GROWTH FORECASTS (VALUE)
6. Competitive Landscape
7. MARKET OPPORTUNITIES AND FUTURE OUTLOOK
Market Definitions and Key Coverage
Our study defines the telecom services market as the revenue generated when licensed operators deliver voice, messaging, data, and value-added media services across fixed and wireless networks to consumer and business users worldwide.
Scope Exclusions: Equipment sales, unlicensed over-the-top apps, and in-house enterprise networks fall outside this definition.
Segmentation Overview
Detailed Research Methodology and Data Validation
Primary Research
Mordor analysts conduct structured interviews with operator finance heads, wholesale bandwidth resellers, network equipment integrators, and regional regulators across North America, Europe, Asia-Pacific, the Middle East and Africa, and Latin America. These conversations validate hidden drivers, such as 5G fixed-wireless substitution rates or enterprise private-network pricing, and clarify assumptions where published statistics diverge.
Desk Research
We begin by mapping the regulatory, demand, and technology landscape through publicly available tier-one sources such as ITU subscription registers, GSMA Mobile Economy datasets, FCC and OFCOM spectrum filings, World Bank broadband indicators, and OECD telecom price baskets. Company 10-Ks, operator investor decks, major trade association releases, and news curated in Dow Jones Factiva supplement these baselines. A second sweep extracts historical traffic volumes, ARPU trends, and spectrum auction proceeds to ground our penetration and price curves. The examples cited are illustrative; many additional documents inform the desk phase.
Market-Sizing and Forecasting
A top-down model starts with each country's service-revenue ledger (voice, messaging, data, pay-TV) and reconstructs totals using subscriber counts, blended ARPUs, and local currency conversions before being further filtered through consumption elasticity flags. Selected bottom-up roll-ups, sampled operator revenue disclosures and channel checks on wholesale IP transit, act as reasonableness gates. Key variables include mobile-data traffic per SIM, fiber household-pass ratios, 5G spectrum cost amortization, enterprise cloud-connect circuits, and inflation-adjusted ARPU evolution. We project these inputs with multivariate regression and scenario analysis that blends macro GDP growth with adoption milestones agreed to during primary interviews. Gaps from thin bottom-up coverage are bridged by proxy ratios, such as post-paid share to total mobile revenue, tested against three-year historical ranges.
Data Validation and Update Cycle
Outputs move through two analyst reviews, anomaly sweeps against ITU and operator filings, and leadership sign-off. Models refresh annually, with interim updates triggered by merger closures, spectrum auctions, or disruptive tariff changes to ensure clients receive the latest calibrated view.
Why Mordor's Telecom Services Baseline Commands Reliability
Benchmark comparison
Published figures can vary widely because firms choose differing service baskets, currency years, and refresh cadences.
Key gap drivers include whether machine-to-machine traffic is counted as a stand-alone stream, how aggressively post-paid ARPUs are deflated, and if pay-TV is bundled into telecom revenue. Our study reports a balanced base case while certain publishers index on aggressive 5G monetization or, conversely, exclude non-core media add-ons, tilting their totals.
| Market Size | Anonymized source | Primary gap driver | ||
|---|---|---|---|---|
USD 1.9 trillion (2025) | Mordor Intelligence | - | Anonymized source:Mordor Intelligence | Primary gap driver:- |
USD 1.983 trillion (2024) | Global Consultancy A | Counts pay-TV plus IoT hardware leasing, inflating scope | ||
USD 2.0 trillion (2024) | Industry Publisher B | Uses constant 2020 exchange rates, ignoring recent currency swings | ||
USD 1.79 trillion (2024) | Research Firm C | Excludes wholesale carrier-carrier traffic and bundles only mobile data |
Pricing Strategy for Semiconductor Components
3 Min Read
Accelerating Additive Manufacturing Adoption in India
3 Min Read
Unlocking Saudi Arabia’s Regional Tourism Growth Potential
5 Min Read
When decisions matter, industry leaders turn to our analysts. Let’s talk.