5G Services Market Size and Share
Market Overview
| Study Period | 2020 - 2031 |
|---|---|
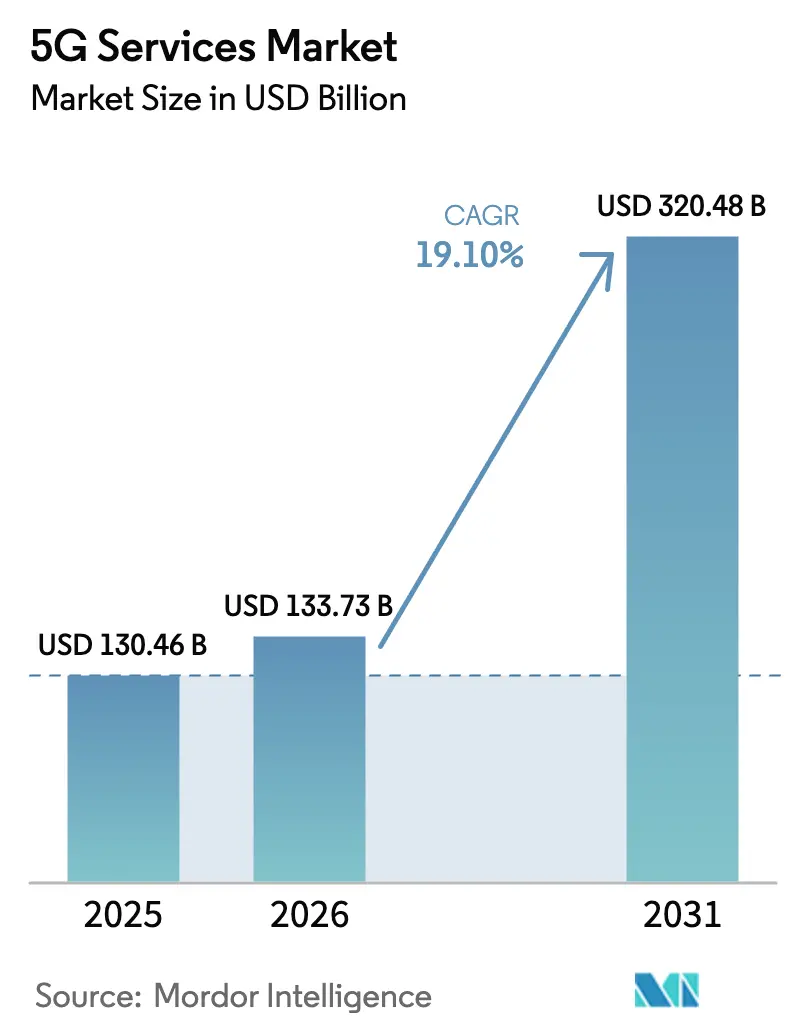
| Market Size (2026) | USD 133.73 Billion |
| Market Size (2031) | USD 320.48 Billion |
| Growth Rate (2026 - 2031) | 19.10% CAGR |
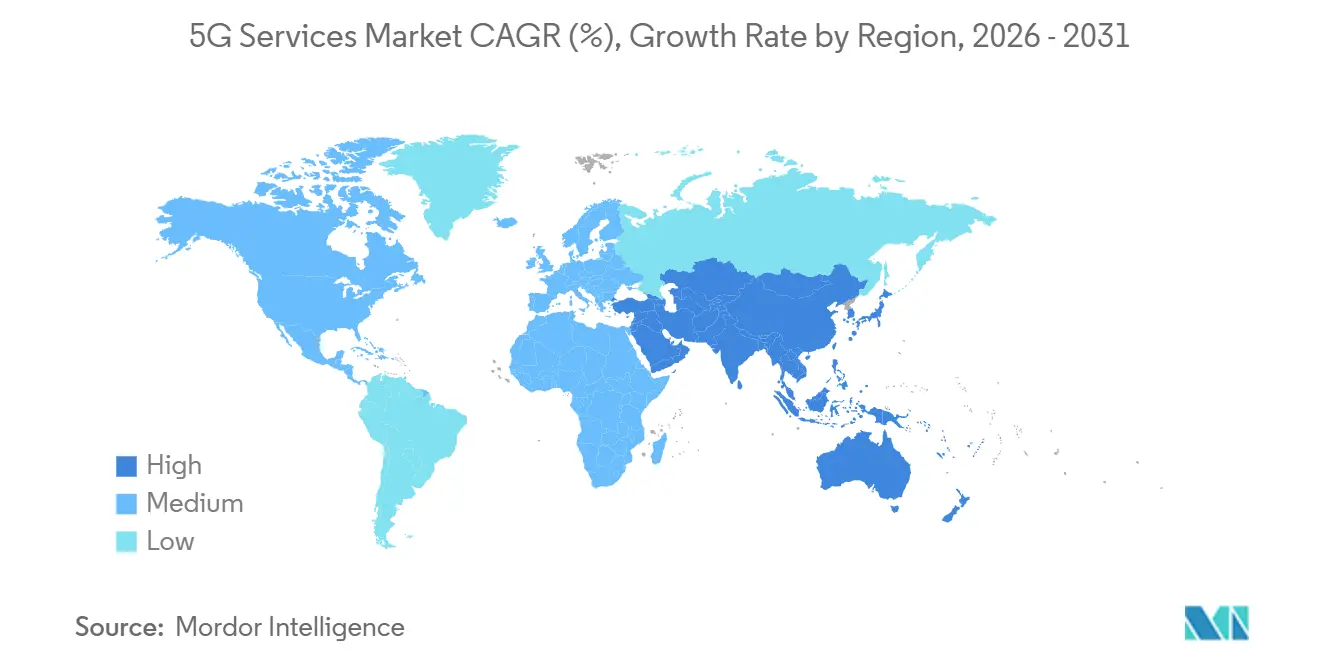
| Fastest Growing Market | Middle East |
| Largest Market | Asia Pacific |
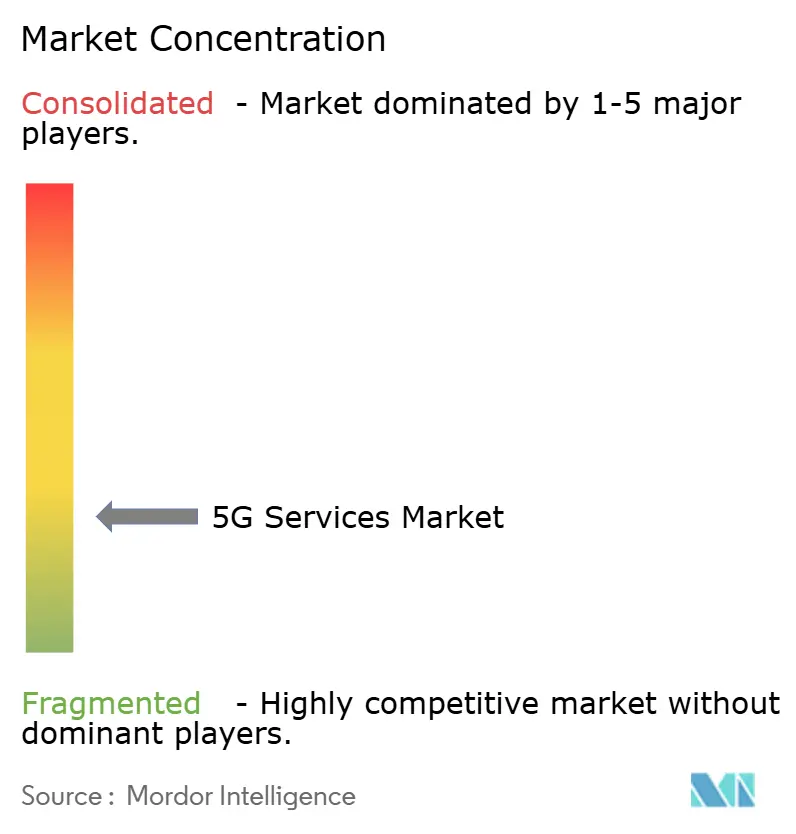
| Market Concentration | Low |
Major Players *Disclaimer: Major Players sorted in no particular order Image © Mordor Intelligence. Reuse requires attribution under CC BY 4.0. | |
5G Services Market Analysis by Mordor Intelligence
The 5G services market size is expected to increase from USD 130.46 billion in 2025 to USD 133.73 billion in 2026 and reach USD 320.48 billion by 2031, growing at a CAGR of 19.1% over 2026-2031. Robust network-slicing monetization, expanding private-network adoption, and the scale-out of fixed-wireless access are widening revenue pools beyond traditional consumer plans. Operators are prioritizing mid-band densification to balance coverage and capacity, while hyperscale cloud alliances are compressing connectivity margins and accelerating vertical-specific solution launches. Policy momentum around spectrum, together with Release 18 upgrades, is pulling forward enterprise demand for ultra-reliable low-latency connectivity.
Key Report Takeaways
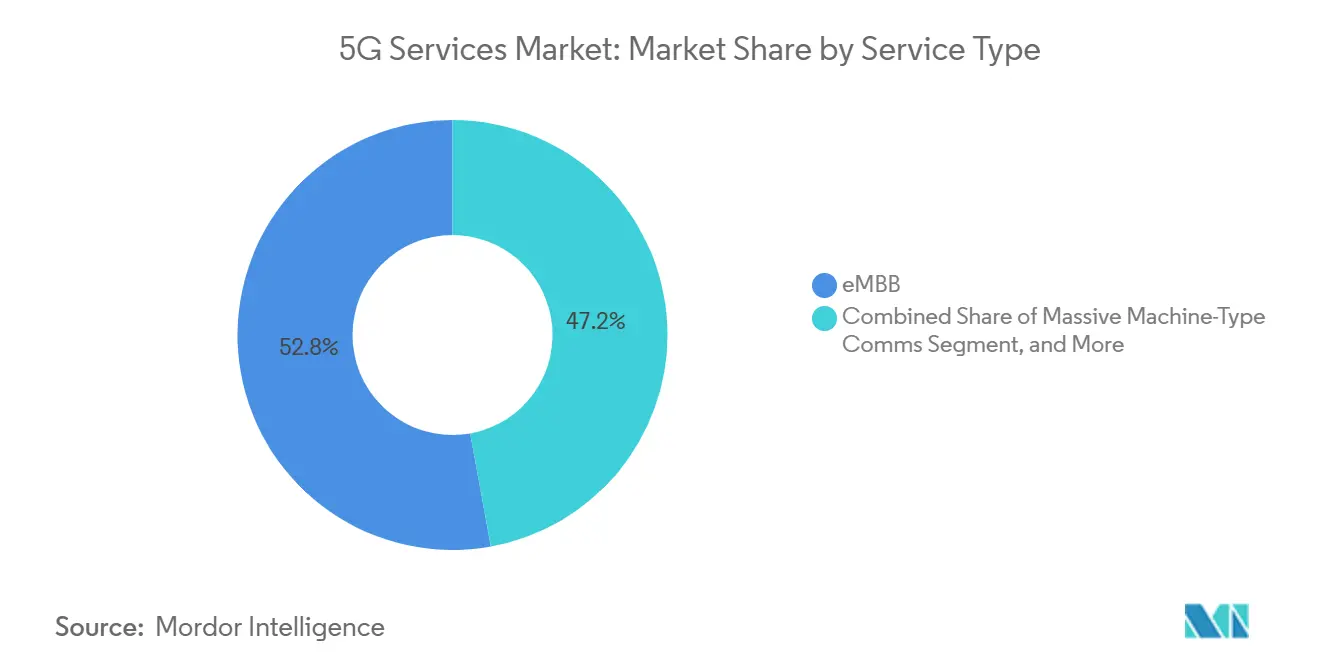
- By service type, Enhanced Mobile Broadband led with 52.84% of the 5G services market share in 2025, while Massive Machine-Type Communications is forecast to expand at a 19.21% CAGR to 2031.
- By network architecture, Non-Standalone deployments captured 63.72% share of the 5G services market size in 2025, whereas Standalone cores are advancing at a 19.53% CAGR through 2031.
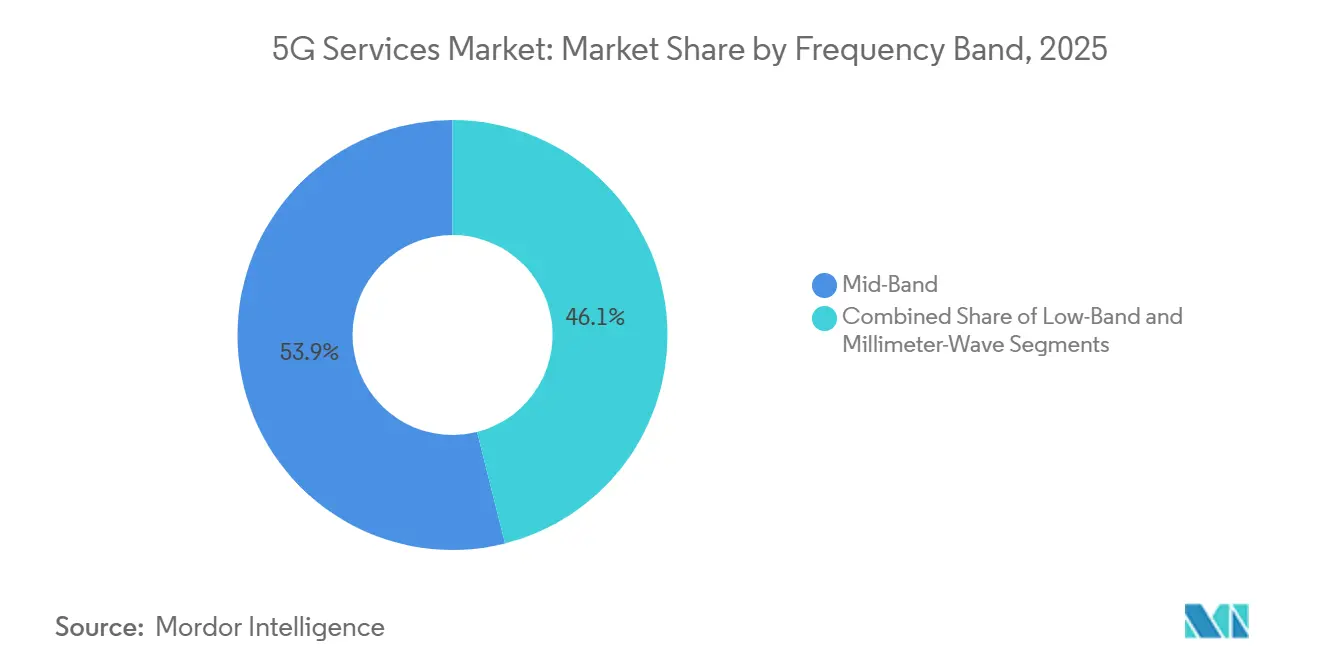
- By frequency band, mid-band assets commanded 53.92% of the 5G services market size in 2025 and are projected to grow at a 19.14% pace up to 2031.
- By end-user industry, the IT and telecom segment held 29.63% revenue share in 2025; manufacturing is the fastest riser, climbing at a 20.07% CAGR to 2031.
- By geography, Asia Pacific accounted for 40.92% of 2025 revenue; the Middle East is the fastest-growing region, with a 20.01% CAGR through 2031.
Note: Market size and forecast figures in this report are generated using Mordor Intelligence’s proprietary estimation framework, updated with the latest available data and insights as of January 2026.
Global 5G Services Market Trends and Insights
Drivers Impact Analysis*
| Driver | (~) % Impact on CAGR Forecast | Geographic Relevance | Impact Timeline |
|---|---|---|---|
| Exploding mobile data traffic | +8.5% | Global, with highest impact in Asia Pacific and North America | Medium term (2-4 years) |
| High consumer demand for eMBB services | +6.2% | Global, led by developed markets in North America and Europe | Short term (≤ 2 years) |
| Enterprise digital-transformation use-cases | +12.8% | Global, with early adoption in manufacturing hubs across Asia Pacific and Europe | Long term (≥ 4 years) |
| Government spectrum-release initiatives | +7.1% | Regional, concentrated in North America, Europe, and select Asia Pacific markets | Medium term (2-4 years) |
| Private-5G uptake in CBRS and local-licence bands | +5.4% | North America and Europe, with emerging adoption in Asia Pacific | Long term (≥ 4 years) |
| Monetisation via network slicing and SLA tiers | +9.8% | Global, with advanced implementations in Asia Pacific and select European markets | Long term (≥ 4 years) |
| Source: Mordor Intelligence | |||
Exploding Mobile Data Traffic
Monthly traffic rose from 141 exabytes in 2025 to an estimated 400 exabytes by 2031, straining suburban macro layers and triggering extra mid-band cell splits. Fixed-wireless lines doubled year-on-year in North America, diverting capacity from mobility channels and validating the economics of millimeter-wave small cells. Ultra-HD video now represents 72% of downlink volumes, while cloud gaming introduces bursty uplink peaks that require dynamic spectrum sharing. Always-connected wearables and automotive telematics diversify session profiles, pushing carriers toward AI-driven traffic steering that sustains quality of experience during congestion events.
High Consumer Demand for eMBB Services
Unlimited gigabit plans account for 52.84% of total 5G revenue, and U.S. operators report average revenue per user uplifts of USD 4.20 from plan migration. South Korean carriers bundled cloud storage and streaming perks, boosting premium-tier adoption to more than 38% within 6 months. Smartphone-based 8K capture creates symmetrical traffic bursts, forcing investment in uplink carrier aggregation and supplemental spectrum blocks. Operators monetize handset upgrades through zero-interest financing that shortens replacement cycles and locks subscribers into higher-margin tiers.
Enterprise Digital-Transformation Use Cases
Private networks in factories, logistics hubs, and hospitals demand sub-10 millisecond latency and 99.999% reliability. A German electronics plant cut downtime 18% by shifting to a standalone slice that supports predictive maintenance.[1]Siemens, “Siemens Activates Private 5G Network at Amberg Electronics Plant,” SIEMENS.COM U.S. automotive lines using CBRS private 5G shaved cycle times 12% as 240 autonomous vehicles coordinated in real time. Healthcare pilots achieved remote robotic surgery with sub-8 millisecond haptic delay, satisfying investigational thresholds. These proofs lift board-level confidence and propel pipeline growth for turnkey 5G campus networks.
Government Spectrum-Release Initiatives
Regulators accelerated mid-band auctions, raising billions to fund connectivity programs while binding winners to rapid build-out clauses. The U.S. 3.45 GHz sale collected USD 7.2 billion and mandates 60% deployment by 2027.[2]Federal Communications Commission, “FCC Concludes Upper 3.45 GHz Spectrum Auction,” FCC.GOV Europe harmonized the 6 GHz band, supporting cross-border logistics slices. Saudi Arabia auctioned 2.6 GHz and 3.5 GHz channels, commanding USD 1.01 billion and stipulating 70% coverage within three years, favoring vendors with turnkey radios. Streamlined releases anchor investment certainty that accelerates carrier capex cycles.
Restraints Impact Analysis*
| Restraint | % Impact on CAGR Forecast | Geographic Relevance | |
|---|---|---|---|
| High Deployment Cost and Long ROI Horizons | -2.8% | Global, acute in emerging markets and rural North America | Long term (≥ 4 years) |
| Fragmented and Delayed Spectrum Policy | -1.9% | South America, Africa, parts of Southeast Asia | Medium term (2-4 years) |
| Limited 5G Device Readiness in Emerging Markets | -1.6% | Sub-Saharan Africa, South Asia, parts of Latin America | Short term (≤ 2 years) |
| Geopolitical Vendor Restrictions and Trade Bans | -2.1% | Europe, North America, Australia, select Asia Pacific markets | Medium term (2-4 years) |
| Source: Mordor Intelligence | |||
High Deployment Cost and Long ROI Horizons
Standalone cores, dense mid-band grids, and upgraded backhaul exceed USD 150 billion in global outlays over 2024-2027, stretching payback to 7-9 years.[3]GSMA Intelligence, “Global Mobile Infrastructure Investment Outlook 2024-2027,” GSMAINTELLIGENCE.COM A U.S. carrier revealed USD 18 billion incremental capex for C-band densification, while rural sites without fiber need USD 250,000 each, widening digital divides. Energy bills rise 30-40% versus 4G, pushing operators to sign renewable power agreements to satisfy carbon pledges and control opex. Capital pressure delays stand-alone migration in cost-sensitive regions.
Fragmented and Delayed Spectrum Policy
Disjointed band plans frustrate equipment scale economies. Brazil postponed its 26 GHz auction to 2026, slowing fixed-wireless deployments in major metros and letting fiber incumbents entrench. Only 18 of 54 African nations assigned 5G bands by end-2025; high reserve prices left many blocks unsold. ASEAN states still lack 3.5 GHz harmonization, forcing multinationals to source country-specific radios and deterring cross-border roaming for tourism. Regulatory lag depresses investor confidence and defers rural coverage upgrades.
*Our forecasts treat driver/restraint impacts as directional, not additive. The impact forecasts reflect baseline growth, mix effects, and variable interactions.
Segment Analysis
By Service Type: Shift From Throughput to Connection Density
Enhanced Mobile Broadband accounted for 52.84% of 2025 revenue, reflecting demand for gigabit-rate consumer packages and suburban fixed-wireless links. Massive Machine-Type Communications, however, is expanding at 19.21% through 2031, signaling a pivot toward battery-efficient sensors that flood manufacturing, utilities, and smart-city grids. The 5G services market size for narrowband IoT endpoints is rising as operators refarm guard bands and legacy 2G spectrum for low-power overlays, enabling support for 50,000 devices per cell at module prices below 5 USD.
URLLC remains niche, limited to vehicle-to-everything pilots and remote control robotics awaiting mature liability frameworks. Still, by 2028, Release 18 scheduling and edge-compute convergence will blur the lines between service types. Operators bundling mMTC slices with analytics platforms generate sticky enterprise revenue, bolstering long-term growth of the 5G services market.


By Network Architecture: Standalone Unlocks Monetization
Non-Standalone deployments held 63.72% share in 2025 because LTE cores enabled quick time-to-market. Yet Standalone networks, growing at 19.53%, are a prerequisite for slicing, deterministic latency, and voice-over-new-radio services. A U.S. carrier trimmed call set-up times 35% after national SA activation. The 5G services market share shift accelerates as enterprise clients demand dedicated SLAs that NSA cannot guarantee.
Capex hurdles remain, but operators retiring legacy packet cores realize opex savings from data-center consolidation and cloud-native automation. Emerging markets may retain NSA longer, yet greenfield entrants without LTE baggage leapfrog straight to cloud-native SA, expanding the 5G services market footprint in underserved geographies.

By Frequency Band: Mid-Band Remains the Workhorse
Mid-band spectrum captured 53.92% of 2025 revenue, driven by 3.5 GHz and C-band deployments that blend area reach with 400-500 Mbps median speeds. The 5G services market size tied to mid-band is projected to grow 19.14% as operators aggregate carriers and leverage Massive MIMO. Millimeter-wave adoption stays localized to stadiums and downtown cores, yet Release 18 carrier aggregation promises multi-gigabit boosts for premium consumer tiers. Low-band layers sustain rural reach but offer limited upsell potential, serving primarily as mobility coverage backstop.
China’s early 2.6 GHz rollouts gave it a head start, while North American carriers densify C-band to square off against cable broadband. European regulators’ calibrated 6 GHz rules will unlock a fresh tranche of harmonized mid-band, reinforcing the spectrum mix that underpins the global 5G services market.
By End-User Industry: Manufacturing Surges
IT and telecom generated 29.63% of 2025 revenue as operators and cloud players internalized 5G for network control and edge hosting. Manufacturing, however, is climbing at a 20.07% CAGR, powered by private-network rollouts that orchestrate autonomous robots and machine-vision inspection. The 5G services market for shop-floor connectivity is growing as assembly plants demand deterministic latency for real-time control loops.
Automotive and mobility trials in Michigan affirmed cooperative collision avoidance, while energy utilities deployed private 5G for sub-second grid-fault isolation. Healthcare pilots remain exploratory, though regulators’ evolving reimbursement rules could unlock sizable upside post-2027. Media producers exploit portable 5G uplinks for 8K broadcasts, underscoring the breadth of vertical opportunities that now extend well beyond consumer mobility.
Geography Analysis
Asia Pacific supplied 40.92% of 2025 revenue, anchored by China’s four-million-site mid-band footprint and India’s rapid urban coverage by two national carriers. China Mobile launched 5G-Advanced in 300 cities late in 2025, bundling 10 Gbps premium tiers and gaming passes. Japan’s Open RAN buildouts cut rural site costs 28%, while South Korea boasts 72% 5G penetration, the world’s highest.
The Middle East is the fastest-growing territory at a 20.01% CAGR. United Arab Emirates operators achieved 95% population reach by mid-2025, underpinning smart-city pilots with autonomous shuttles and AI traffic controls. Saudi carriers launched standalone cores across major metros to serve oil, logistics, and healthcare verticals in line with Vision 2030 ambitions, while Turkey switched on 5G in its three largest cities, targeting fixed-wireless competition
North America and Europe exhibit slower subscriber-driven growth but pivot to enterprise and fixed-wireless scaling. A U.S. carrier’s C-band network covered 230 million people by December 2025, monetizing 4 million fixed-wireless lines. Deutsche Telekom’s cross-border slices boosted enterprise revenue 14% year-on-year. South America and Africa trail because of auction delays, device affordability gaps, and backhaul shortfalls, although selective rollouts in Brazil and South Africa defend mobile incumbents against fiber overtures.

Competitive Landscape
Global service revenue is moderately concentrated: the top ten operators control about 58%, yet most markets remain national oligopolies fenced by license barriers. Western vendor share shifted to Ericsson, Nokia, and Samsung amid geopolitical restrictions on Huawei gear, while Huawei and ZTE still dominate much of Asia Pacific and the Middle East. Hyperscale clouds cut joint go-to-market deals with telcos, bundling edge compute and threatening pure-connectivity margins.
Operators thin vertical stacks by buying system-integration boutiques and edge-platform startups, in pursuit of turnkey Industry 4.0 deals. Open RAN trials broaden the vendor pool, letting software specialists nibble at incumbents’ base-band share. A Japanese greenfield carrier showcased 40% capex savings with a cloud-native network, prompting emerging-market entrants to weigh similar economics.
Device ecosystems accelerated after a leading chipset supplier unveiled a Release 18 modem supporting ambient IoT and XR enhancements. Sub-USD 300 standalone-capable handsets appeared in late 2025, shrinking affordability barriers and expanding the addressable base for 5G services. The race now tilts toward service differentiation, with slice marketplaces, private-network orchestration, and fixed-wireless gigabit offers providing levers for share defense.
5G Services Industry Leaders
Huawei Technologies Co Ltd
Verizon Communications Inc
China Mobile Ltd.
AT&T Inc.,
Telefonaktiebolaget LM Ericsson
- *Disclaimer: Major Players sorted in no particular order

Recent Industry Developments
- January 2026: Verizon Communications completed nationwide C-band densification, adding 15,000 small cells across 50 metros to raise mid-band capacity 45% and target two million extra fixed-wireless lines by year-end 2026.
- December 2025: China Mobile launched 5G-Advanced in 300 cities, combining mid-band and millimeter-wave for 10 Gbps peaks to support UHD streaming and cloud gaming.
- November 2025: Deutsche Telekom activated network-slicing across Germany, Poland, and the Netherlands, pricing platinum slices at EUR 12,000 (USD 13,080) per month with 99.99% uptime guarantees.
- October 2025: AT&T finished migrating its core to standalone across 48 states, retiring 18% of LTE core capacity and forecasting USD 320 million annual opex savings by 2027.
- September 2025: Samsung Electronics signed a USD 6.6 billion deal to supply 5G RAN gear to Verizon through 2028, including Open RAN-ready radios.


Research Methodology Framework and Report Scope
Market Definitions and Key Coverage
Our study defines the 5G services market as global operator and wholesale revenue generated when fifth-generation radio access and core networks deliver enhanced mobile broadband, fixed wireless access, massive machine-type, and ultra-reliable low-latency connections across licensed spectrum. The definition follows 3GPP releases 15-18 and captures both standalone and non-standalone architectures that monetize through subscriptions, managed slices, and private network service contracts.
Scope exclusion: device and customer-premise hardware sales lie outside this valuation.
Segmentation Overview
- By Service Type
- Enhanced Mobile Broadband (eMBB)
- Ultra-Reliable Low-Latency Comms (URLLC)
- Massive Machine-Type Comms (mMTC)
- By Network Architecture
- Non-Standalone (NSA) 5G
- Standalone (SA) 5G
- By Frequency Band
- Low-Band (Less than 1 GHz)
- Mid-Band (1- 6 GHz)
- Millimetre-Wave (Greater than 24 GHz)
- By End-User Industry
- IT and Telecom
- Media and Entertainment
- Automotive and Mobility
- Energy and Utilities
- Aerospace and Defense
- Manufacturing
- Healthcare
- Other End-User Industries
- By Geography
- North America
- United States
- Canada
- Mexico
- South America
- Brazil
- Argentina
- Rest of South America
- Europe
- Germany
- United Kingdom
- France
- Italy
- Russia
- Rest of Europe
- Asia Pacific
- China
- India
- Japan
- South Korea
- Rest of Asia Pacific
- Middle East
- Saudi Arabia
- United Arab Emirates
- Turkey
- Rest of Middle East
- Africa
- South Africa
- Nigeria
- Rest of Africa
- North America
Detailed Research Methodology and Data Validation
Primary Research
Mordor analysts interviewed mobile-network engineering leads, enterprise connectivity buyers, and regional telecom regulators across North America, Europe, and Asia-Pacific. These discussions validated subscriber ramp-up assumptions, spectrum-pricing pass-through, and emerging private-5G tariff models.
Desk Research
We began with traffic indicators and tariff data published by bodies such as the ITU, GSMA Intelligence, and national regulators, then compared capital-deployment filings and spectrum fee disclosures across leading operators. Trade associations (for example, CTIA in the United States or ETSI in Europe) supplied deployment mileposts, while peer-reviewed journals outlined latency benchmarks for URLLC use cases. Company 10-Ks, investor decks, and credible press releases helped benchmark service uptake and average revenue per user trends. Paid databases that Mordor analysts routinely access, D&B Hoovers for operator financials and Dow Jones Factiva for global news flows, rounded out the desk findings. This list is illustrative; many other secondary sources informed data checks and context building.
Market-Sizing & Forecasting
A top-down demand pool was built from cellular subscription counts, 5G penetration curves, and service ARPU splits, which are then cross-checked with sampled bottom-up roll-ups of operator service revenue. Key variables include spectrum auction values, 5G population coverage, eMBB traffic per user, enterprise slice uptake, and IoT connection density. Multivariate regression, guided by expert consensus, projects each driver to 2030. Gap years without direct data are bridged by conservative interpolation. Where channel checks indicated mismatch, revenue totals were adjusted within documented variance thresholds.
Data Validation & Update Cycle
Model outputs pass variance tests against independent traffic trackers and audited operator statements. Senior analysts review anomalies before sign-off. The report refreshes annually, with interim revisions triggered by major spectrum releases or tariff shifts, ensuring clients receive the latest vetted view.
Why Mordor's 5G Services Baseline Commands Reliability
Published estimates often diverge because firms choose different revenue inclusions, device assumptions, and refresh cadences.
According to Mordor Intelligence, clarity on scope and driver selection narrows that gap for decision-makers.
Benchmark comparison
| Market Size | Anonymized source | Primary gap driver |
|---|---|---|
| USD 136.52 B (2025) | Mordor Intelligence | - |
| USD 205.52 B (2023) | Global Consultancy A | Includes device financing revenue and updates biennially |
| USD 196.42 B (2025) | Trade Journal B | Counts unlicensed-spectrum campus networks and assumes aggressive ARPU uplift |
These comparisons show that our disciplined scope definition, yearly refresh cycle, and dual-path validation yield a balanced, transparent baseline that stakeholders can trace to clear variables and repeatable steps.


Key Questions Answered in the Report
How fast is revenue expected to grow for 5G service providers between 2026 and 2031?
Global revenue is projected to expand at a 19.1% CAGR from USD 133.73 billion in 2026 to USD 320.48 billion by 2031.
Which region will be the quickest to scale enterprise 5G adoption?
The Middle East is forecast to post a 20.01% CAGR to 2031, supported by greenfield standalone rollouts and sovereign digital programs.
Why are operators moving from Non-Standalone to Standalone cores?
Standalone networks enable guaranteed-latency network slices, voice-over-NR, and edge-compute monetization, benefits not possible over LTE-anchored Non-Standalone architectures.
What is driving manufacturing demand for private 5G networks?
Factories use deterministic latency to coordinate autonomous robots, real-time quality control, and predictive maintenance, yielding double-digit productivity gains.
How are spectrum policies affecting deployment timelines?
Harmonized mid-band auctions accelerate build-outs, while delays or high reserve prices in parts of Africa and South America postpone investment and coverage expansion.
Page last updated on:


