5G Devices Market Size and Share
Market Overview
| Study Period | 2020 - 2031 |
|---|---|
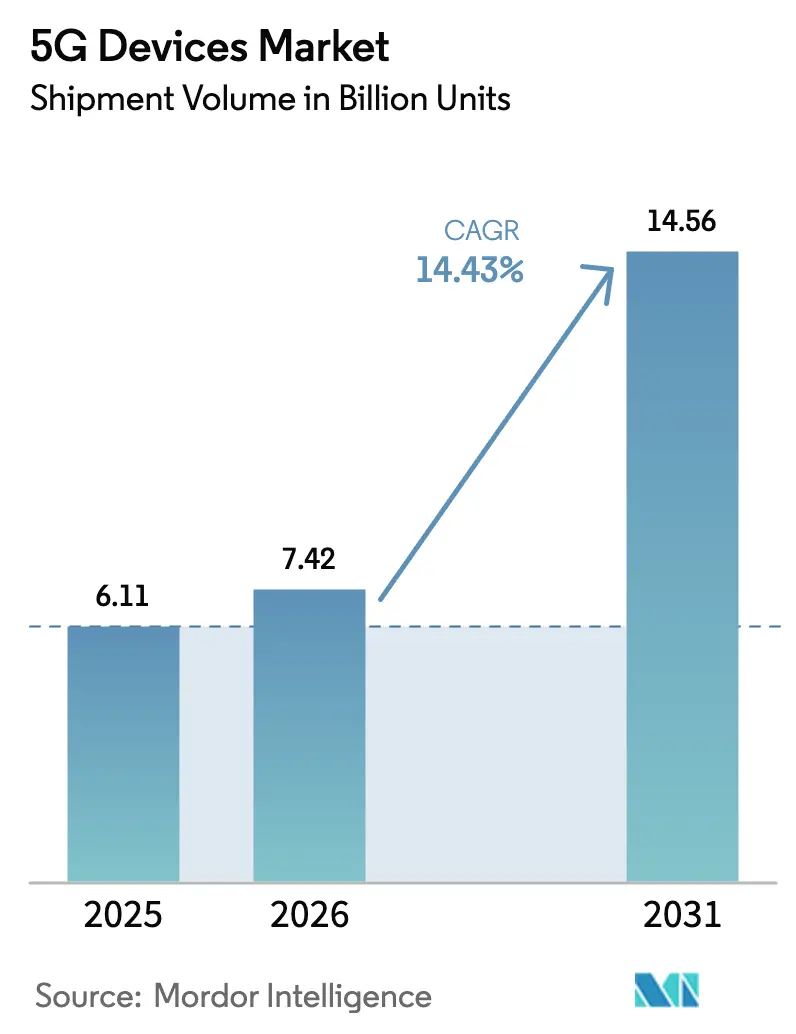
| Market Volume (2026) | 7.42 Billion units |
| Market Volume (2031) | 14.56 Billion units |
| Growth Rate (2026 - 2031) | 14.43% CAGR |
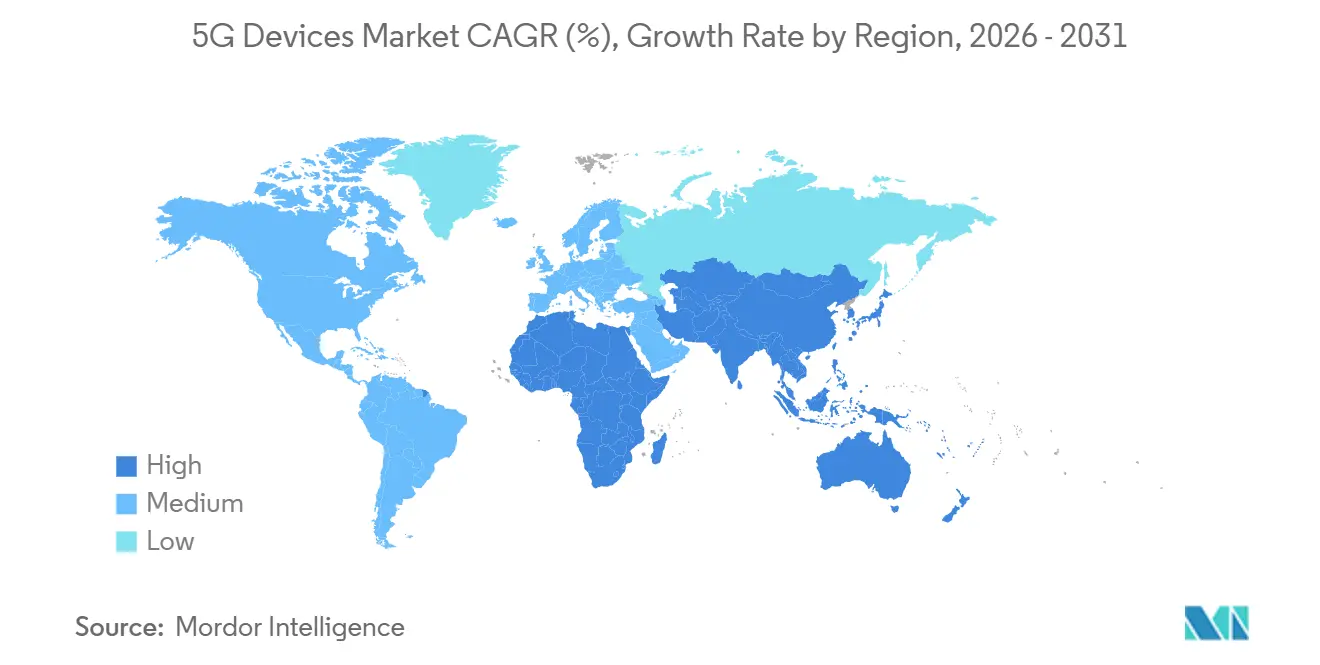
| Fastest Growing Market | Asia Pacific |
| Largest Market | North America |
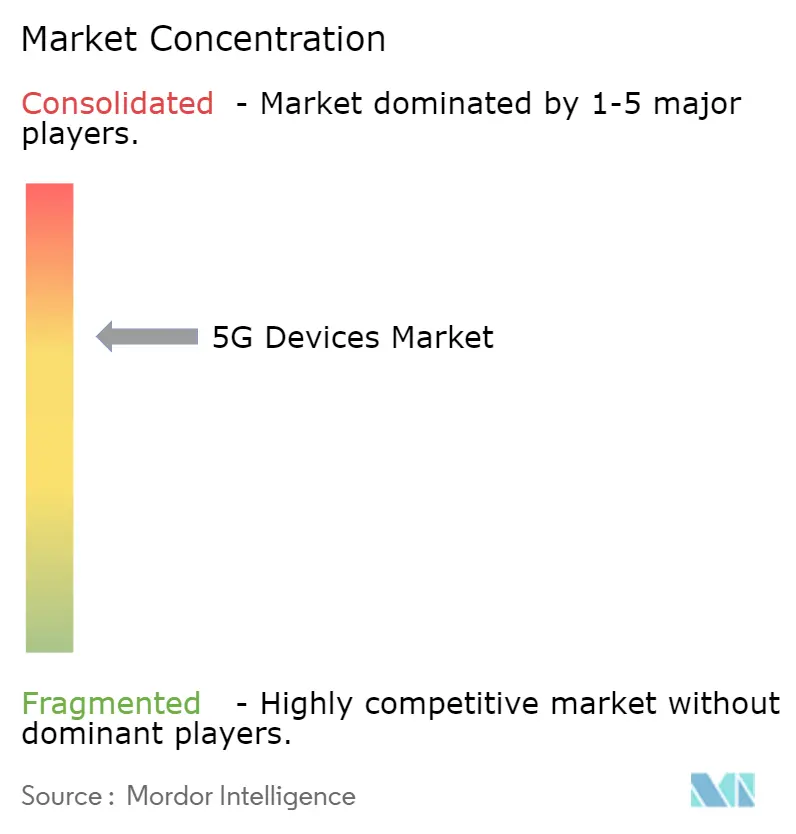
| Market Concentration | Medium |
Major Players *Disclaimer: Major Players sorted in no particular order Image © Mordor Intelligence. Reuse requires attribution under CC BY 4.0. | |
5G Devices Market Analysis by Mordor Intelligence
The 5G Devices market size in terms of shipment volume is expected to grow from 6.11 billion units in 2025 to 7.42 billion units in 2026 and is forecast to reach 14.56 billion units by 2031 at 14.43% CAGR over 2026-2031. Volume growth reflects falling chipset costs, wider carrier subsidies, and an accelerated rollout of enterprise private networks. Sub-6 gigahertz radios dominate mainstream demand because they balance coverage, cost, and power efficiency, while mmWave integration remains a premium feature reserved for fixed-wireless gateways and flagship smartphones. Wearables and extended-reality products are expanding faster than handsets as insurers, employers, and content platforms demand continuous connectivity. Geographically, Asia-Pacific accounts for more than half of shipments as Chinese and Indian manufacturing ecosystems compress bill-of-materials costs. Chipset competition keeps mid-tier prices low, yet the scarcity of gallium nitride and silicon germanium substrates periodically disrupts the premium mmWave supply.
Key Report Takeaways
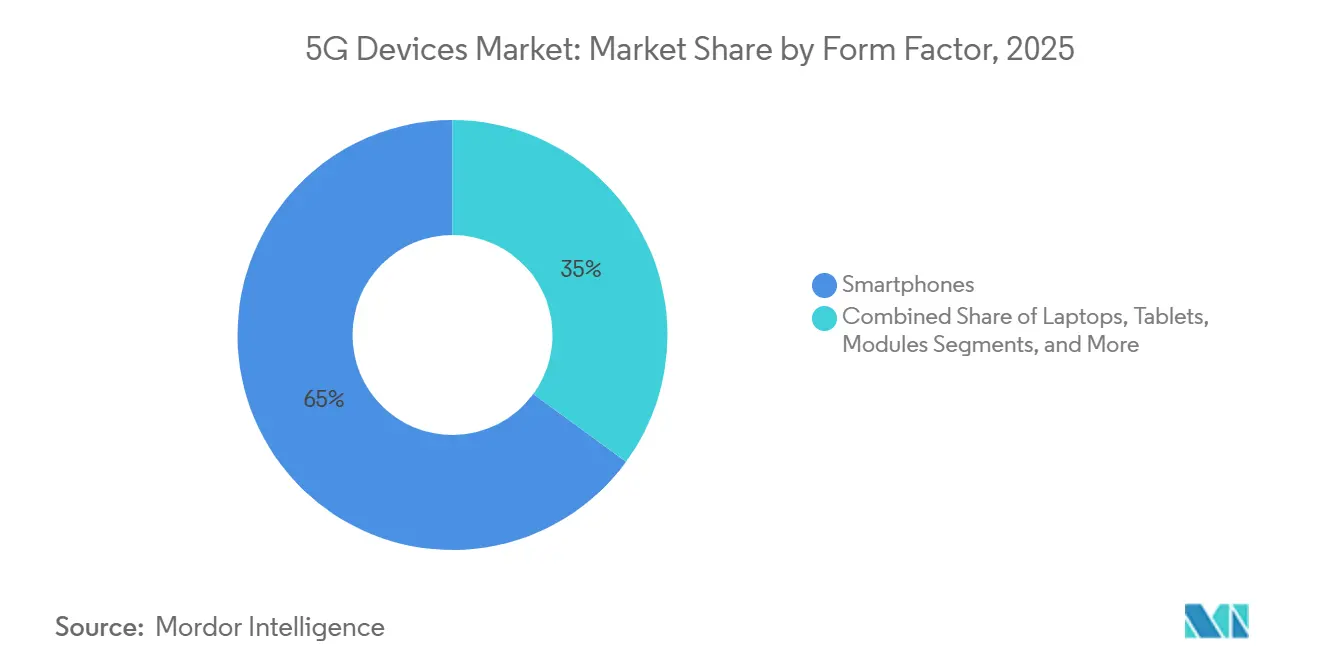
- By form factor, smartphones commanded 64.96% of the 5G devices market in 2025, whereas wearables and extended-reality hardware are forecast to rise at a 15.52% CAGR through 2031.
- By spectrum, sub-6 GHz products secured 58.22% of the 5G device market share in 2025, while mmWave hardware is set to grow at 14.86% annually as densification accelerates.
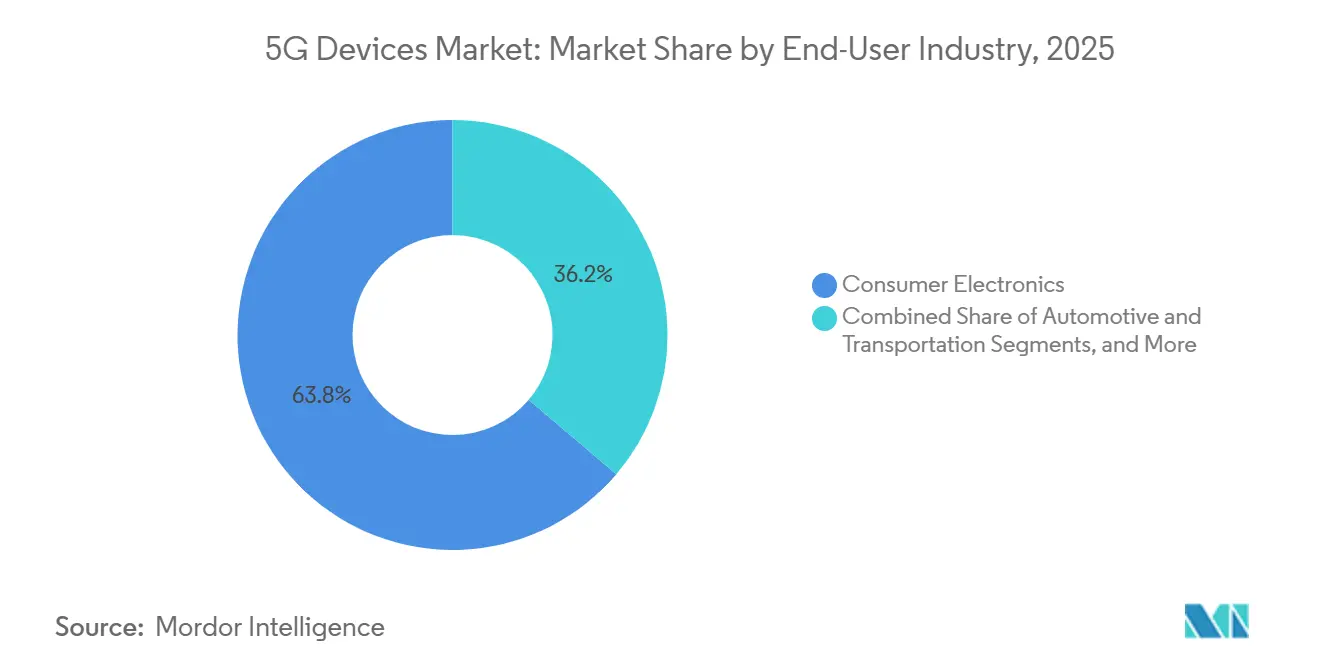
- By end-user industry, consumer electronics led with 63.78% share in 2025; automotive and transportation applications are poised for the fastest 15.11% CAGR through 2031.
- By application, enhanced mobile broadband held 55.06% share in 2025, whereas ultra-reliable low-latency communications devices will expand at 15.94% to 2031.
- By geography, Asia-Pacific captured 55.73% of shipments in 2025; the Middle East will be one of the quickest-growing region at a 16.01% CAGR through 2031.
Note: Market size and forecast figures in this report are generated using Mordor Intelligence’s proprietary estimation framework, updated with the latest available data and insights as of January 2026.
Global 5G Devices Market Trends and Insights
Drivers Impact Analysis*
| Driver | (~) % Impact on CAGR Forecast | Geographic Relevance | Impact Timeline |
|---|---|---|---|
| Explosive Mobile-Data Demand in Emerging Economies | +3.2% | Asia-Pacific core, spillover to Middle East and Africa | Medium term (2-4 years) |
| Declining ASP of 5G Chipsets and RF Front-Ends | +2.8% | Global, with acute effects in India, Southeast Asia, Latin America | Short term (≤ 2 years) |
| Aggressive Carrier Device-Subsidy Programs | +2.1% | North America, Europe, China | Short term (≤ 2 years) |
| Enterprise Private-Network Roll-Outs | +1.9% | Global, early gains in Germany, United States, Japan | Medium term (2-4 years) |
| Regulatory Spectrum-Sharing Models (CBRS, UK LSA) Catalysing Industrial Devices | +1.6% | North America and Europe, pilot programs in Asia-Pacific | Long term (≥ 4 years) |
| Multi-Access Edge AI Chips Enabling Ultra-Low-Power 5G Wearables | +1.5% | Global, premium-segment concentration in North America, Europe, China | Medium term (2-4 years) |
| Source: Mordor Intelligence | |||


Explosive Mobile-Data Demand in Emerging Economies
Monthly data consumption per user in India surpassed 20 gigabytes in 2025, driven by cloud gaming, augmented-reality filters, and real-time translation tools that require latency under 100 milliseconds. Although global 5G coverage reached 55%, penetration in low-income nations was only 4%, so affordability rather than infrastructure dictated adoption. Carriers responded with financing schemes that lowered upfront handset costs, prompting brands to release sub-USD 150 smartphones trimmed of high-end features. This dynamic expanded the 5G device market beyond early adopters, even as margins tightened. The result is a broadening unit base that underpins double-digit shipment growth.
Declining ASP of 5G Chipsets and RF Front-Ends
Qualcomm’s Snapdragon 4-series average selling price dropped 22% year over year in fiscal 2024, mainly because MediaTek discounted Dimensity 6000 processors. GaAs power amplifiers for sub-6 gigahertz bands fell below USD 2 per unit in 2025, down from USD 3.50 in 2022.[1]Semiconductor Industry Association, “2024 State of the U.S. Semiconductor Industry,” SIA, semiconductors.org As a result, the bill-of-materials premium for 5G over 4G fell below USD 15, dismantling the largest barrier to mass-market adoption. MmWave front-end modules still cost USD 12-18, confining that band to premium devices. Even so, falling core silicon prices widen the 5G devices market by making entry-level models affordable in emerging economies.
Aggressive Carrier Device-Subsidy Programs
Verizon spent USD 1.2 billion on handset subsidies and promotional credits in 2024, 17% more than in 2023, to push subscribers onto unlimited 5G plans.[2]Verizon Communications, “2024 Annual Report,” Verizon, verizon.com T-Mobile reported that 68% of 2024 activations involved trade-in or installment forgiveness that lowered consumer out-of-pocket costs by up to USD 500. In China, China Mobile co-funded 12 million rural smartphones with local brands. These programs compress carrier margins but accelerate refresh rates, helping the 5G devices market sustain mid-teens volume growth even in saturated regions.
Enterprise Private-Network Rollouts
More than 700 private 5G networks were operational worldwide by late 2024, with manufacturing sites accounting for 38%. Germany alone issued 174 local spectrum licenses to enterprises, enabling Bosch and Siemens to deploy on-premises ultra-reliable low-latency infrastructure. Industrial buyers prioritize uptime and deterministic performance over raw throughput, so they accept higher device prices for ruggedized routers and modules. As factories, logistics hubs, and energy assets digitize, these specialized deployments enlarge the 5G devices market beyond consumer endpoints.
Restraints Impact Analysis*
| Restraint | (~) % Impact on CAGR Forecast | Geographic Relevance | Impact Timeline |
|---|---|---|---|
| Supply-Chain Volatility for RF Semiconductors | -1.8% | Global, acute in North America and Europe for mmWave deployments | Short term (≤ 2 years) |
| Patchy mmWave Coverage Outside Dense Urban Zones | -1.4% | Global, most severe in rural North America, Europe, and emerging markets | Medium term (2-4 years) |
| E-Waste Regulations Restricting Rapid Handset Refresh | -1.1% | Europe, North America, pilot programs in Japan and South Korea | Long term (≥ 4 years) |
| Cross-Border Security Certifications Delaying Industrial Routers | -0.9% | Global, friction points at North America-Europe and Asia-Pacific regulatory boundaries | Medium term (2-4 years) |
| Source: Mordor Intelligence | |||
Supply-Chain Volatility for RF Semiconductors
Gallium-nitride wafer shortages pushed RF front-end lead times to 30 weeks in 2024, compared with 14 weeks for baseband silicon.[3]IEEE Spectrum Editors, “The Semiconductor Supply Chain Crisis,” IEEE Spectrum, spectrum.ieee.org Only three fabs worldwide can mass-produce gallium-nitride-on-silicon-carbide substrates, so premium mmWave gear often reaches stores late. Original equipment manufacturers mitigate risk by shipping dual stock-keeping units: volume sub-6 gigahertz models and limited mmWave variants. The bifurcation blunts the overall 5G devices market CAGR until new fab capacity comes online.
Patchy mmWave Coverage Outside Dense Urban Zones
MmWave 5G covered less than 8% of the global land area in 2024, clustered in city centers, stadiums, and transit hubs. Consumers who pay USD 100 premiums for hybrid phones experience gigabit speeds only occasionally, which dampens their willingness to upgrade. Operators redirect capital toward sub-6 gigahertz “nationwide 5G,” which offers broader reach but fewer ultra-low-latency advantages. Until coverage widens, mmWave device growth remains confined to fixed-wireless gateways and enterprise hotspots, slowing the high-margin slice of the 5G devices market.
*Our forecasts treat driver/restraint impacts as directional, not additive. The impact forecasts reflect baseline growth, mix effects, and variable interactions.
Segment Analysis
By Form Factor: Smartphones Hold Volume, Wearables Lead Growth
Smartphones accounted for 64.96% of shipments in 2025, underscoring their central role as primary access devices for more than 4.5 billion users worldwide. Yet replacement intervals lengthened to 31 months in 2025, signaling maturation. Wearables and extended-reality hardware are on a 15.52% CAGR path to 2031, lifted by insurer wellness incentives and workplace safety mandates. Apple reported that cellular-enabled watches formed 38% of its wearable mix in 2024, up from 22% in 2022.[4]Apple Inc., “Form 10-K 2024,” Apple, apple.com Customer-premises equipment for fixed wireless has risen with rural broadband initiatives, while industrial routers priced at USD 500-1,200 thrive in harsh-environment deployments. Modules, critical for machine-to-machine automotive and metering links, scale in parallel with the Internet of Things.
Growth leadership shows why pocket-centric demand is plateauing while body-worn and ambient endpoints surge. Augmented-reality glasses lower maintenance errors in factories by overlaying instructions in workers’ fields of view. However, battery anxiety persists because users expect multi-day endurance on wrist and eyewear devices. Continuous silicon advances that push power draw below 300 milliwatts therefore remain decisive for form-factor migration. As these advances materialize, the 5G devices market will rely less on handsets for its next 7 billion-unit expansion.


By Spectrum Support: Sub-6 Gigahertz Dominance Continues
Sub-6 gigahertz radios captured 58.22% share in 2025 since they deliver 300-600 megabits per second across kilometer-scale cells at front-end costs below USD 6. MmWave shipments grow at 14.86% but start from a lower base because modules cost USD 12-18 and require network densification that is still underway. Hybrid devices that combine both bands represented 18% of 2025 smartphones, catering to early adopters keen on peak speeds. Carriers must install 10-15 times more mmWave small cells than sub-6 gigahertz sites to match signal reach, a heavy capital burden that delays ubiquitous coverage.
Momentum favors sub-6 gigahertz for nationwide availability, with mmWave reserved for stadiums, airports, and high-density downtown corridors. Consequently, sub-6 gigahertz hardware will stay the volume backbone of the 5G devices market while mmWave targets premium tiers. Once densities rise and front-end prices fall, the share of mmWave could approach 30% by 2031, but its upside hinges on solving both infrastructure and component supply bottlenecks.
By End-User Industry: Automotive Accelerates
Consumer electronics held 63.78% unit share in 2025, but automotive and transportation endpoints are projected to log a 15.11% CAGR through 2031. The European Union mandated cellular vehicle-to-everything capabilities for new passenger cars sold after July 2024, spawning a captive pipeline for 5G modules. Qualcomm disclosed design wins with 18 automakers for its Snapdragon Ride platform in 2024. Industrial sites invest in ruggedized routers that ensure uptime in vibration-prone environments, while healthcare adoption remains gradual due to lengthy medical approvals. Energy and utilities shift smart meters from 2G and 3G to 5G as legacy networks phase out.
As vehicles morph into software-first products, over-the-air updates and predictive maintenance hinge on reliable cellular networks. Tesla’s 2024 filing noted revenue from post-sale software features enabled via 5G connectivity. Automotive certification cycles stretch 18–24 months, slowing refresh but ensuring long-term module demand. As connectivity becomes standard across mass-market models, the 5G devices market will benefit from large yet predictable unit shipments over a decade-long vehicle life.
By Application: URLLC Gains Momentum
Enhanced mobile broadband owned 55.06% of demand in 2025 due to video and social media consumption. Ultra-reliable low-latency communications devices will rise at 15.94% annually through 2031 as factories automate and surgeons pilot remote procedures. Private network slicing enables enterprises to allocate deterministic bandwidth to mission-critical robots. Massive machine-type communications grows more slowly because LTE-M already covers many low-throughput IoT use cases. Fixed wireless accounted for 12% of new U.S. broadband lines in 2024, demonstrating that 5G can substitute for wireline in rural areas.
Network slicing reached commercial readiness only in 2024, so most URLLC devices connect to campus networks rather than public carriers. This two-track model separates consumer broadband gear from industrial equipment with separate certification, supply chains, and service contracts. As slicing matures, wider carrier services will expand the market for 5G devices to address latency-sensitive endpoints.
Geography Analysis
Asia-Pacific shipped 55.73% of global units in 2025, buoyed by China’s 420 million-device output and India’s production-linked incentive program that drew USD 15 billion in assembly investments. Japan and South Korea punch above their volume-based rank by owning 40% of the premium tier above USD 1,000. Southeast Asian markets expand rapidly on sub-USD 300 handsets, whereas Australia and New Zealand see 36-month cycles that temper growth. Localized component ecosystems give Asia-Pacific up to 30% cost advantages versus Europe and North America, locking in its leadership of the 5G devices market.
The Middle East is one of the fastest risers, with a 16.01% CAGR to 2031. Saudi Arabia allocated USD 20 billion to 5G smart-city projects under Vision 2030, and the United Arab Emirates achieved 95% population coverage in 2024. Device uptake lags network rollout because average selling prices remain high; continued chipset cost erosion will unlock the next leg of adoption.
North America and Europe face countervailing forces: mature 5G footprints coexist with regulatory pressures that slow handset churn. The European Union tightened e-waste rules in 2023, adding end-of-life fees of USD 2-5 per phone. U.S. right-to-repair debates encourage longer use, holding region-wide CAGR to low double digits. South America and Africa together account for 12% of shipments, though fixed wireless presents a mid-term leapfrog path in underserved rural areas.

Competitive Landscape
Chipset makers and smartphone original equipment manufacturers dominate value capture, while module, router, and customer-premises equipment vendors operate on slimmer margins. Qualcomm and MediaTek together hold 65% of application processor units, but MediaTek’s cost advantage yielded a 51% share of India’s 2024 5G chipset market. Apple and Samsung, through vertical integration, command 45% of global smartphone gross profit on a 22% unit share. Chinese brands led by Xiaomi, OPPO, and Vivo win volume tiers by leveraging domestic supply chains that shave 8-10 percentage points off bill-of-materials cost versus global peers.
White-space segments, such as intrinsically safe handhelds for oil rigs and ISO 26262-certified automotive modules, remain fragmented. Fibocom secured functional-safety approval in 2024, opening telematics opportunities beyond infotainment. Patent filings at ETSI show that Ericsson and Nokia lead in ultra-reliable low-latency communications intellectual property and aim to monetize it via licensing rather than hardware. As chipset prices converge, differentiation migrates to software ecosystems, cloud integrations, and enterprise management platforms.
The competitive outlook therefore splits the 5G devices market into high-margin premium ecosystems controlled by vertically integrated giants and a commoditized volume base where scale and efficient supply chains decide winners.
5G Devices Industry Leaders
Apple Inc.
Samsung Electronics Co., Ltd.
Huawei Technologies Co., Ltd.
Xiaomi Corp
Guangdong OPPO Mobile Telecommunications Corp., Ltd.
- *Disclaimer: Major Players sorted in no particular order

Recent Industry Developments
- September 2025: Qualcomm signed a multi-year 3-nanometer foundry deal with Samsung to diversify beyond Taiwan Semiconductor Manufacturing Company and lock in Snapdragon 8 Gen 4 capacity.
- August 2025: Apple unveiled iPhone 16 with emergency satellite messaging that fuses Globalstar links with terrestrial 5G radios.
- July 2025: MediaTek won a USD 500 million Dimensity 9300 supply contract from Xiaomi through 2026.
- June 2025: Nokia completed a private 5G network for Volkswagen’s Wolfsburg plant connecting 3,000 robots at sub-5-millisecond latency.
- May 2025: Samsung invested USD 800 million to expand smartphone capacity in Vietnam by 120 million units per year.


Global 5G Devices Market Report Scope
The 5G Devices Market Report is Segmented by Form Factor (Smartphones, CPE, Industrial Routers, Modules, Laptops and Tablets, Hotspots, and Wearables and XR), Spectrum Support (Sub-6 GHz, mmWave, and Hybrid), End-User (Consumer, Industrial, Automotive, Healthcare, Energy, and Enterprise), Application (eMBB, URLLC, mMTC, FWA, and V2X), and Geography (North America, South America, Europe, Asia-Pacific, Middle East, and Africa). The Market Forecasts are in Volume (Units).
| Smartphones |
| Customer-Premises Equipment (Indoor / Outdoor) |
| Industrial Grade Routers / Gateways |
| Modules |
| Laptops/Tablets |
| Hotspots |
| Wearables and XR Devices |
| Sub-6 GHz |
| mmWave |
| Hybrid (Sub-6 GHz + mmWave) |
| Consumer Electronics |
| Industrial and Manufacturing |
| Automotive and Transportation |
| Healthcare |
| Energy and Utilities |
| Enterprise/Commercial |
| Enhanced Mobile Broadband (eMBB) |
| Ultra-Reliable Low-Latency Comms (URLLC) |
| Massive Machine-Type Comms (mMTC) |
| Fixed Wireless Access |
| Vehicle-to-Everything (V2X) |
| North America | United States |
| Canada | |
| Mexico | |
| South America | Brazil |
| Argentina | |
| Rest of South America | |
| Europe | Germany |
| United Kingdom | |
| France | |
| Italy | |
| Spain | |
| Rest of Europe | |
| Asia-Pacific | China |
| Japan | |
| India | |
| South Korea | |
| ASEAN | |
| Rest of Asia-Pacific | |
| Middle East | Saudi Arabia |
| United Arab Emirates | |
| Rest of Middle East | |
| Africa | South Africa |
| Nigeria | |
| Rest of Africa |
| By Form Factor | Smartphones | |
| Customer-Premises Equipment (Indoor / Outdoor) | ||
| Industrial Grade Routers / Gateways | ||
| Modules | ||
| Laptops/Tablets | ||
| Hotspots | ||
| Wearables and XR Devices | ||
| By Spectrum Support | Sub-6 GHz | |
| mmWave | ||
| Hybrid (Sub-6 GHz + mmWave) | ||
| By End-User Industry | Consumer Electronics | |
| Industrial and Manufacturing | ||
| Automotive and Transportation | ||
| Healthcare | ||
| Energy and Utilities | ||
| Enterprise/Commercial | ||
| By Application | Enhanced Mobile Broadband (eMBB) | |
| Ultra-Reliable Low-Latency Comms (URLLC) | ||
| Massive Machine-Type Comms (mMTC) | ||
| Fixed Wireless Access | ||
| Vehicle-to-Everything (V2X) | ||
| By Geography | North America | United States |
| Canada | ||
| Mexico | ||
| South America | Brazil | |
| Argentina | ||
| Rest of South America | ||
| Europe | Germany | |
| United Kingdom | ||
| France | ||
| Italy | ||
| Spain | ||
| Rest of Europe | ||
| Asia-Pacific | China | |
| Japan | ||
| India | ||
| South Korea | ||
| ASEAN | ||
| Rest of Asia-Pacific | ||
| Middle East | Saudi Arabia | |
| United Arab Emirates | ||
| Rest of Middle East | ||
| Africa | South Africa | |
| Nigeria | ||
| Rest of Africa | ||


Key Questions Answered in the Report
What is the current shipment volume for 5G devices?
Shipments reached 7.42 billion units in 2026 and are on track for 14.56 billion units by 2031.
Which region accounts for the largest share of global shipments?
Asia-Pacific held 55.73% of unit volume in 2025 due to Chinese and Indian manufacturing scale.
Which application segment is growing the fastest?
Ultra-reliable low-latency communications devices are projected to grow at a 15.94% CAGR through 2031.
How do declining chipset prices influence adoption?
A reduction in 5G bill-of-materials premiums from USD 40–50 in 2021 to under USD 15 in 2025 has opened the mass-market tier.
Why is automotive demand accelerating?
Regulatory mandates for cellular vehicle-to-everything and long vehicle lifecycles drive a 15.11% CAGR in automotive modules.
Page last updated on:


