
5G Infrastructure Market Size and Share
Market Overview
| Study Period | 2020 - 2031 |
|---|---|
| Market Size (2026) | USD 19.86 Billion |
| Market Size (2031) | USD 67.52 Billion |
| Growth Rate (2026 - 2031) | 27.73 % |
| Fastest Growing Market | Asia Pacific |
| Largest Market | Asia Pacific |
| Market Concentration | High |
Major Players *Disclaimer: Major Players sorted in no particular order Image © Mordor Intelligence. Reuse requires attribution under CC BY 4.0. | |
5G Infrastructure Market Analysis by Mordor Intelligence
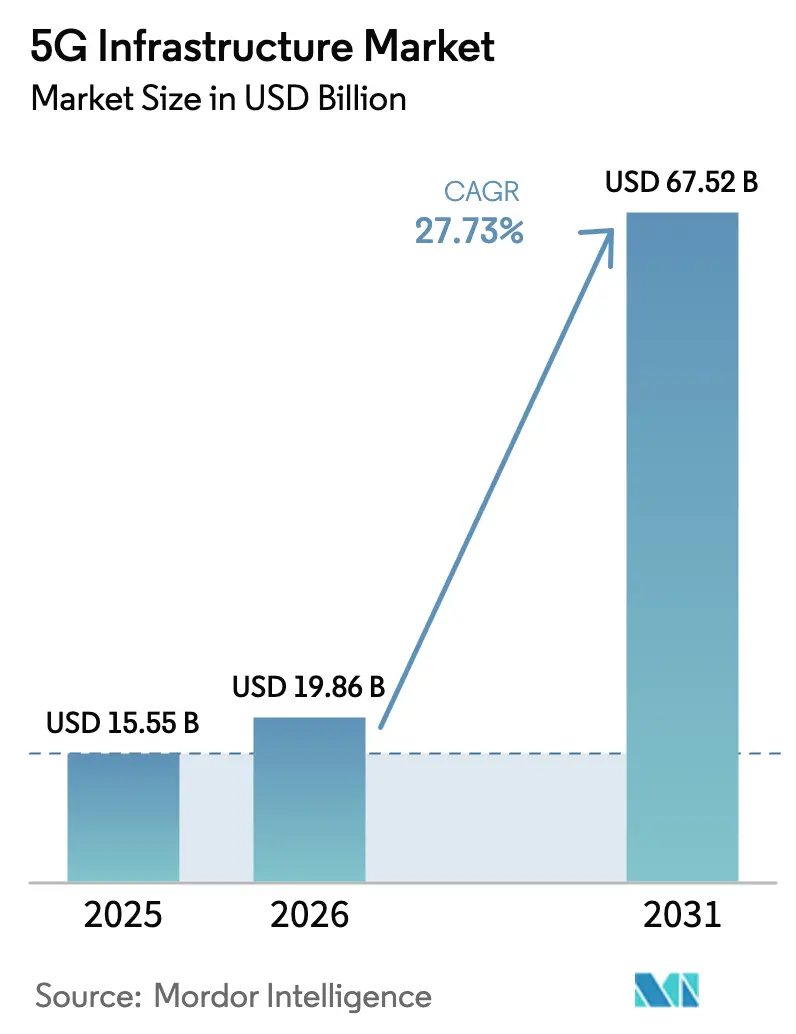
5G infrastructure market size in 2026 is estimated at USD 19.86 billion, growing from 2025 value of USD 15.55 billion with 2031 projections showing USD 67.52 billion, growing at 27.73% CAGR over 2026-2031. The current expansion pivots on operators replacing earlier non-standalone rollouts with fully programmable standalone platforms that support network slicing, edge computing and private network creation. Capital is shifting from pure coverage toward software-defined functions that shorten service launch cycles, improve automation and lower lifetime operating costs. Demand is reinforced by private-network interest from manufacturing, mobility and energy, alongside fixed-wireless access (FWA) deployments that extend high-speed broadband into rural zones. Meanwhile, spectrum policy is unlocking fresh mid-band capacity, and vendor road maps are converging around cloud-native Open RAN designs that let carriers avoid single-supplier dependence and monetize APIs more quickly.
Key Report Takeaways
- By communication infrastructure, Radio Access Network (RAN) equipment held 36.30% of 5G infrastructure market share in 2025, yet cloud-native core networks are forecast to grow at 31.10% CAGR to 2031.
- By spectrum band, mid-band frequencies captured 45.20% share of the 5G infrastructure market size in 2025, while high-band mmWave is advancing at a 32.15% CAGR through 2031.
- By network architecture, non-standalone deployments accounted for 71.40% of the 5G infrastructure market in 2025; standalone architectures are expanding fastest at 33.80% CAGR.
- By end-user vertical, consumer electronics dominated with 27.10% revenue share in 2025, whereas industrial manufacturing is poised to accelerate at 29.10% CAGR.
- By region, Asia Pacific led with 23.80% share of the 5G infrastructure market in 2025 and is projected to climb at a 31.40% CAGR to 2031.
Note: Market size and forecast figures in this report are generated using Mordor Intelligence’s proprietary estimation framework, updated with the latest available data and insights as of 2026.
Market Trends and Insights
Drivers Impact Analysis of 5G Infrastructure Market*
| Drivers | (~) % Impact on CAGR Forecast | Geographic Relevance | Impact Timeline |
|---|---|---|---|
| Increasing machine-to-machine and IoT device density | +4.2% | Global, with APAC leading adoption | Medium term (2-4 years) |
| Surge in mobile data consumption | +3.8% | Global, concentrated in urban centers | Short term (≤ 2 years) |
| Government spectrum auctions accelerating mid-band rollouts | +3.1% | North America and EU primary, APAC secondary | Short term (≤ 2 years) |
| Telco capex pivot to cloud-native open RAN architectures | +2.7% | North America and EU core, spill-over to APAC | Medium term (2-4 years) |
| Emerging demand for private 5G in brownfield industrial sites | +2.4% | Global, with manufacturing hubs prioritized | Long term (≥ 4 years) |
| Fixed-wireless access (FWA) substituting fiber in rural markets | +1.9% | Global, particularly underserved regions | Medium term (2-4 years) |
| Source: Mordor Intelligence | |||


Increasing Machine-to-Machine and IoT Device Density
Standalone 5G allows each cell site to handle as many as 50,000 connected devices, a prerequisite for Industry 4.0 production lines and massive sensor grids. Hyundai Motor’s RedCap-enabled factory network proved that reduced-capability devices can lower power budgets without losing coverage. Edge computing is moving compute resources closer to machines, keeping latency within millisecond windows that robotics and predictive-maintenance schemes require. Private-network proofs in automotive, healthcare, and heavy industry validate the revenue upside that comes from device-dense environments rather than consumer handsets. This driver underpins sustained spending on small cells and edge data centers over the forecast window.
Surge in Mobile Data Consumption
Monthly mobile traffic continues to set new highs as cloud gaming, extended-reality video, and AI-enhanced streaming demand consistent multi-gigabit links. Three UK boosted backbone throughput to 9 Tbit/s after end-2024 peaks surpassed 2 Tbit/s. In China, regulators expect national traffic to quadruple by 2030, moving operators toward capacity architectures that remain efficient under day-long loads. Healthcare pilots, such as real-time tele-ultrasound demonstrations, underline the value of uplink capacity for mission-critical imagery. FWA uptake in India and the United States is also redirecting traffic from smartphones to CPE units, pushing carriers to redesign backhaul for home-first video habits.
Government Spectrum Auctions Accelerating Mid-Band Rollouts
The United States 3.1-3.45 GHz and C-band clearances balanced coverage with capacity, giving carriers optimal propagation while easing urban permit hurdles.[1]Federal Communications Commission, “National Spectrum Strategy,” fcc.gov Malaysia’s single-network model reached 53.4% adoption only three years after launch, confirming how coordinated awards compress deployment timelines. Europe’s harmonised mid-band grid hands Germany 96% coverage but exposes laggards that fragmented their awards. Clear timelines let equipment makers optimise radio units per band, shrinking total-cost-of-ownership and unlocking rural business cases.
Telco Capex Pivot to Cloud-Native Open RAN Architectures
O2 Telefónica switched on the first commercial cloud RAN site inside a standalone network, proving virtualised radio can meet metro-grade KPIs.[2]Ericsson, “o2 Telefónica launches commercial Cloud RAN,” ericsson.com Dell and Ericsson now co-engineer turnkey Open RAN stacks that target 90% of carriers, citing network transformation as survival-critical. AT&T earmarked USD 14 billion for software-defined upgrades that replace proprietary appliances with containerised functions. Operators still weigh integration risk, yet the ability to expose network APIs and slice resources by application gives cloud-native designs a clear monetisation path that counters pure connectivity margins.
Restraints Impact Analysis of 5G Infrastructure Market*
| Restraint | (~) % Impact on CAGR Forecast | Geographic Relevance | Impact Timeline |
|---|---|---|---|
| High upfront RAN densification and fiber back-haul costs | -2.8% | Global, acute in developing markets | Short term (≤ 2 years) |
| Delayed standardization for network-slicing monetization | -1.9% | Global, particularly impacting enterprise adoption | Medium term (2-4 years) |
| National-security restrictions on Chinese vendors | -1.5% | North America and EU core, limited APAC impact | Long term (≥ 4 years) |
| Skilled-labor shortages for mmWave deployment | -1.2% | Global, concentrated in advanced deployment markets | Medium term (2-4 years) |
| Source: Mordor Intelligence | |||
High Upfront RAN Densification and Fiber Back-Haul Costs
Small-cell bills from USD 10,000 to USD 50,000 and macro-cell outlays that reach USD 200,000 per site make dense 5G footprints capital heavy, especially where mmWave is mandated. Fiber back-haul can add 30% to project budgets, and scarce digs in suburban corridors slow trenching schedules. Global telecom CAPEX dipped in 2023, the first drop since 2017, making CFOs cautious about accelerated rollouts. Network-sharing deals deliver up to 40% savings but reduce each partner’s ability to market premium differentiation. Spectrum licence fees above USD 1 billion per operator further compress balance sheet headroom.
Delayed Standardisation for Network-Slicing Monetisation
Without mature APIs and international billing formats, network slicing remains in proof-of-concept mode even though standalone cores are live.. T-Mobile US warns that net-neutrality rules could block differentiated QoS offers, clouding ROI for slice-based services. Enterprises hesitate to commit workloads until SLAs and test regimes are harmonised, causing a loop where volume uptake and standards progress each wait on the other. Some vertically integrated vendors exploit gaps by pitching proprietary end-to-end stacks, a trend that could undermine Open RAN goals of multi-supplier freedom.
*Our forecasts treat driver/restraint impacts as directional, not additive. The impact forecasts reflect baseline growth, mix effects, and variable interactions.
5G Infrastructure Market Segment Analysis
By Communication Infrastructure:
Core Networks Drive Cloud TransformationRAN equipment generated the largest slice of the 5G infrastructure market, delivering 36.30% revenue in 2025 as carriers rolled out dense macro and small-cell grids. That initial hardware wave will keep RAN important, yet core networks outpace other layers with a 31.10% CAGR because software-defined control decides future monetisation. The 5G infrastructure market size for core platforms is set to increase sharply as standalone rollouts mandate dual-mode packet cores that virtualise user plane and control plane functions. Vodafone Spain and Three UK highlight how cloud-native cores let operators expose APIs for edge, security and quality-on-demand products
In the second half of the decade, operators view the converged core as the engine for private-network slices, low-latency industrial services, and real-time analytics. RAN spend will taper as coverage milestones are met, whereas lifecycle refresh and feature add-ons keep core invoices growing. Transport and xHaul budgets also rise because distributed units must feed line-rate traffic into data-centre cores. Consequently, the 5G infrastructure market will witness supplier jockeying where optical and routing vendors position themselves as strategic rather than tactical partners.



By Spectrum Band:
mmWave Acceleration Despite Mid-Band DominanceMid-band commanded 45.20% of 5G infrastructure market share in 2025 because it blends propagation reach with multi-hundred-MHz bandwidth that supports massive MIMO arrays. Operators from Chicago to Berlin use 3.5 GHz radios to cover suburban rings without overspending on cells. mmWave, however, shows the fastest 32.15% CAGR by serving FWA households and event venues. This trajectory means the 5G infrastructure market size linked to mmWave radios, repeaters and advanced beamforming silicon will climb quickly, especially in the United States, Japan and South Korea.
Low-band below 1 GHz stays vital for wide-area IoT coverage but struggles with gigabit targets, keeping it a supplement, not a star. mmWave deployment faces line-of-sight and foliage loss, yet high-gain antennas and AI-aided beam steering are closing some gaps. Regulators that bundle mid-band and high-band blocks in the same licence round help carriers align the spectrum mix with differentiated service tiers.
By Network Architecture:
Standalone Transition AcceleratesNon-standalone rollouts kept cash burn limited and ensured quick 5G logos on consumer devices, which explains their 71.40% hold on the 2025 5G infrastructure market. Yet NSA cannot support deterministic latency or isolated slices, pushing carriers toward standalone. Standalone shipments register a 33.80% CAGR, and the share of the 5G infrastructure market tied to full 5G cores is expected to tip the balance after 2027. Markets such as Malaysia leapfrogged NSA entirely, while Europe lags with only 2% SA adoption.
Standalone migration brings security assurance, URLLC performance and vertical-grade QoS. Transition complexity involves dual-stack ops and new charging systems, but recent cloud-native advances reduce changeover downtime. Suppliers that bundle orchestration, analytics and edge compute score higher in RFPs because they accelerate monetisation.
By Core Network Technology:
Software-Defined Networking Leads InnovationNetwork Function Virtualisation still holds 40.50% share because it was the first step toward hardware-light operations. Yet Software-Defined Networking climbs at 30.20% CAGR, lifting its contribution to the 5G infrastructure market as operators seek granular programmability. SDN controllers decouple policy and forwarding, enabling automatic traffic moves that preserve SLA while cutting manual interventions. The 5G infrastructure market size for SDN-enabled gear will benefit from AT&T’s USD 14 billion programmable upgrade and from nationwide deployments in Europe and Asia that follow similar blueprints.
Edge computing and network slicing need NFV foundations, but SDN overlays unlock real-time topology changes when loads spike. Nokia’s converged core for Bharti Airtel adds generative-AI orchestration that predicts congestion and pre-allocates resources. Over 2026-2030, buyers will grade vendors on API maturity and multi-cloud alignment rather than on single-box throughput.

By End-User Vertical:
Industrial Manufacturing Drives Enterprise AdoptionConsumer electronics applied early pressure on operators, giving the segment 27.10% revenue in 2025. Industrial manufacturing, however, posts the strongest 29.10% CAGR because private 5G links elevate robotics, computer-vision checks, and AGV navigation. Cummins’ neutral-host plus private-network build boosted factory efficiency and sets a benchmark many discrete manufacturers plan to copy.Healthcare pilots such as long-distance robot-assisted gastrectomy validate ultra-reliable low-latency links in critical settings, promising bigger budgets after 2026.
Automotive programs add telematics, over-the-air firmware, and collision-avoidance functions that depend on nationwide 5G. Utilities apply cellular to smart meters and substation automation. Defence departments request standalone slices with hardened encryption, creating specialised opportunities. As verticals mature, integrators that combine spectrum leasing, device certification, and analytics will capture a larger slice of the 5G infrastructure market.
Geography Analysis
APAC 5G Infrastructure Market
Asia Pacific held 23.80% of 5G infrastructure market share in 2025, driven by China’s 4.4 million base stations and India’s race to connect 30 million FWA subscribers by 2027. The region will expand at a 31.40% CAGR as South Korea sustains 97% population coverage and Japan adds suburban densification. Rural programmes in Indonesia, Vietnam, and the Philippines will lean on shared-tower models, while Australia advances with hybrid satellite-5G back-ups for remote mining operations.
North America 5G Infrastructure Market
North America shows coverage maturity above 80% of people yet reinvigorated spending in 2025 after a 2023 dip. Ericsson logged 54% year-over-year regional growth in Q4 2024, signalling that standalone cores, edge zones, and large enterprise deals are moving budgets again. US carriers bundle FWA with fibre to capture underserved suburbs, and Canada allocates fresh mid-band spectrum to accelerate indigenous-community connectivity.
Europe and LATAM 5G Infrastructure Market
Europe trails on standalone penetration but targets a EUR 164 billion economic boost by 2030 from harmonised regulation. Germany’s 96% coverage illustrates what cohesive awards achieve, whereas the United Kingdom must rebuild performance after vendor bans slowed equipment swaps. Latin America steps into commercial phase with 29 operators live; regional connections should reach 425 million by 2030 as spectrum fees fall and cloud players finance neutral-host towers.


Regulatory Landscape
Spectrum policy and network-transition rules continue to shape 5G infrastructure spend across RAN, transport, and cloud-native cores. In the United States, the National Spectrum Strategy and subsequent actions have kept mid-band availability and federal-to-commercial coordination in focus, while the FY2025 reconciliation law (P.L. 119-21, enacted July 2025) mandated new spectrum auctioning and targeted 100-180 MHz in the 3.98-4.16 GHz range for commercial terrestrial high-powered 5G use. The FCC also expanded shared-spectrum frameworks via FCC 25-24 (April 2025), designating the Lower 37 GHz band for shared federal and non-federal use with priority for military systems and buildout obligations for non-federal operators.
Standards and procedural simplification are also influencing rollout complexity and vendor compliance requirements. ITU-R approved Recommendation M.2150-3 (February 2026) updating detailed IMT-2020 (5G) terrestrial radio interface specifications, and ITU-T approved Recommendation Q.5016 (January 2026) addressing signaling architecture for fixed, mobile, and satellite convergence, reinforcing multi-access design direction for 5G cores and edge integration. In March 2026, the FCC adopted FCC 26-19 to simplify technology-transition discontinuance rules by replacing multiple legacy tests with a consolidated rule, reducing procedural friction for operators retiring legacy network elements while modernizing to standalone and cloud-native platforms.
Value Chain Analysis
The 5G infrastructure value chain starts with upstream inputs (RF and baseband semiconductors, memory, optical components, and critical raw materials such as gallium and germanium), moves through equipment and software suppliers (RAN radios and basebands, transport/xHaul optics and routing, and cloud-native 5G core and orchestration stacks), and then into integration and deployment (system integrators, tower and fiber partners, and cloud providers enabling edge and core hosting). The chain ends with buyers and operators, primarily mobile network operators and enterprises procuring private-network infrastructure, supported by managed-service partners for lifecycle operations, automation, and security.
Recent supply-side constraints have been linked to component lead times and trade frictions, which affect delivery schedules and pricing for both radio and core compute platforms. Evidence points to extended memory lead times and tighter parts availability around late-2025 procurement cycles, alongside heightened sensitivity to tariffs and sourcing restrictions that can impact multi-country vendor configurations. As operators shift architecture toward cloud-native cores and Open RAN, the value chain broadens to include more specialized software vendors and general-purpose compute suppliers, which raises the importance of interoperability testing, lifecycle support, and integrator capability alongside traditional OEM delivery.
Competitive Landscape
Competitive Landscape
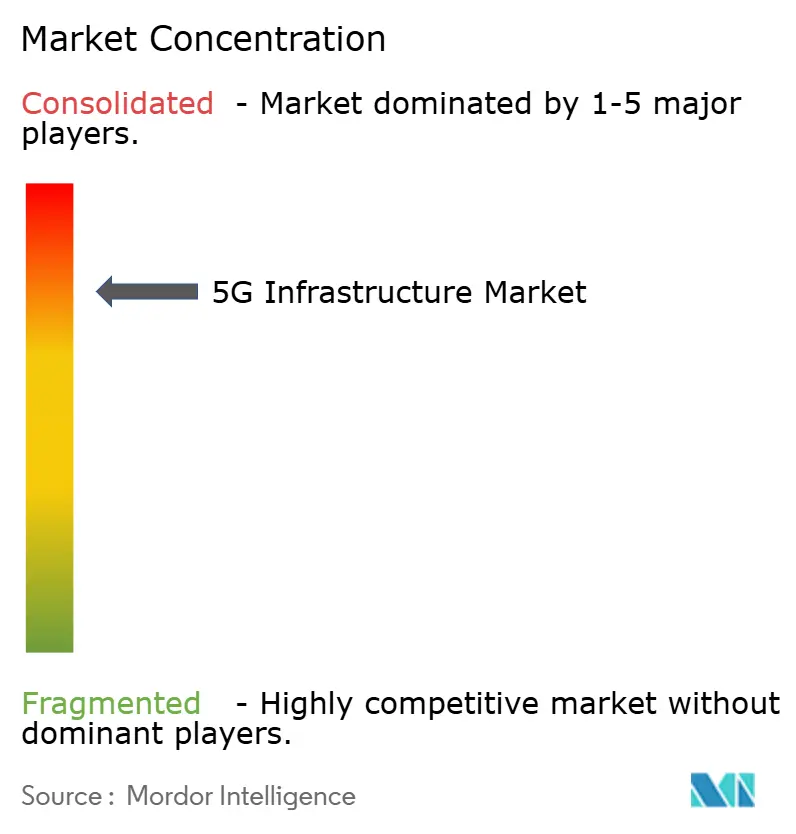
The 5G infrastructure market is moderately concentrated: Huawei, Ericsson, Nokia, and ZTE collectively control 89% of global shipments. Geopolitical filters tilt share in different blocs, with Huawei dominant in China but restricted in North America and parts of Europe. Ericsson capitalises on that vacuum, booking robust North American growth and reinforcing its European base. Nokia pursues optical depth, purchasing Infinera for USD 2.3 billion to couple packet transport with radio portfolios. ZTE leverages domestic scale and price leadership to defend margins.
Competition hinges on more than radio energy-efficiency metrics. Vendors race to deliver fully cloud-native software, pre-integrated analytics, and Open RAN compliance that eases multi-supplier swaps. Patent royalty income also shapes P&L; Ericsson seeks SEK 13 billion from intellectual-property licences in 2025. Meanwhile, hyperscalers and towercos angle for adjacent value pools, from edge hosting to neutral-host indoor coverage, further stretching the traditional vendor model.
Strategic tie-ups illustrate convergence. Dell-Ericsson co-produce modular data-centre nodes, while Samsung repositions around private-network bundles in North America. Cloud-first challengers like Mavenir and Rakuten Symphony court greenfield and enterprise buyers with software stacks that run on generic hardware. Although smaller in revenue, these entrants influence pricing pressure and roadmap transparency across the wider 5G infrastructure industry.
5G Infrastructure Industry Leaders
Cisco Systems Inc.
Hewlett Packard Enterprise Development LP
Mavenir Systems Inc.
NEC Corporation
Nokia Corporation
- *Disclaimer: Major Players sorted in no particular order
5G Infrastructure Market Companies Covered in this Report
- Airspan Networks Inc.
- AT&T Inc.
- Casa Systems Inc.
- Cisco Systems Inc.
- CommScope Holding Company Inc.
- Corning Inc.
- Dell Technologies Inc.
- Telefonaktiebolaget LM Ericsson
- Fujitsu Limited
- Hewlett Packard Enterprise Development LP
- Huawei Technologies Co. Ltd.
- Intel Corporation
- Juniper Networks Inc.
- Mavenir Systems Inc.
- NEC Corporation
- Nokia Corporation
- Oracle Corporation
- Parallel Wireless Inc.
- Qualcomm Technologies Inc.
- Qucell Networks Co. Ltd.
- Rakuten Symphony Inc.
- Ribbon Communications Inc.
- Samsung Electronics Co. Ltd.
- Verizon Communications Inc.
- ZTE Corporation

Market Opportunities and Future Outlook
Opportunities are concentrating around the architectural transition from non-standalone to standalone, and from appliance-based to cloud-native cores, as operators sign multi-year modernization programs. In March 2026, Ericsson agreed with SoftBank Corp. to expand and modernize core network solutions to accelerate 5G SA in Japan, and in the United Kingdom both Ericsson and Nokia disclosed major multi-year engagements with Virgin Media O2 aligned to its Mobile Transformation Plan, combining nationwide RAN modernization with the operational tooling needed for higher automation and service differentiation. These deals sustain demand for cloud-native 5GC, orchestration, and xHaul upgrades that support slicing-ready services and edge integration.
A second whitespace is scaling dense-capacity and enterprise-grade deployments with more flexible vendor mixes and automation, supported by observable operator activity and industry adoption metrics. As of April 2026, 392 operators had launched 5G and 643 were investing, while 35 operators were investing in 5G-Advanced, reflecting a growing pipeline for upgrades beyond initial coverage. AT&T publicly expanded Open RAN and cloud RAN activity, including third-party small-cell radios and next-generation server processors, underscoring buyer interest in disaggregated stacks that reduce single-supplier dependency and align with software-defined operations. On the policy side, Nigeria’s NCC published a 2026-2030 spectrum roadmap that keeps mid-band planning in the foreground, reinforcing that capacity-led spectrum planning and SA-ready infrastructure roadmaps are running in parallel across multiple regions.
Recent Industry Developments in 5G Infrastructure Market
- May 2026: MagtiCom selected Mavenir as its strategic small cell technology partner for a nationwide 4G and 5G deployment project in Georgia. The engagement strengthens Mavenir's position in small cells and adds another reference for multi-vendor RAN densification programs outside the largest Tier-1 markets.
- April 2026: Mavenir deployed its Converged Packet Core in Rakuten Mobile's nationwide network in Japan, supporting multi-carrier roaming through the JAPAN Roaming service. The rollout highlights continued operator migration toward cloud-native core functions that can be upgraded through software and used to enable new service models.
- July 2025: Hewlett Packard Enterprise closed its acquisition of Juniper Networks, combining data center, AI, and networking portfolios under one vendor. The consolidation increases HPE's ability to pursue telco cloud and 5G core-adjacent infrastructure opportunities where integrated networking and automation are key procurement criteria.


5G Infrastructure Market Report Scope and Research Methodology
Market Definition and Coverage
This market covers spending on equipment, software, and related services used to build and run 5G networks, from the radio layer through transport and the core, across public and private deployments.
Scope exclusions: We do not count spectrum auction payments, end user devices, or revenues that sit fully outside cellular connectivity delivery.
Segments Covered in This Report
- By Communication Infrastructure
- 5G Radio Access Network (RAN)
- Transport / xHaul (Front-, Mid-, Back-haul)
- Core Network (Cloud-native 5GC)
- By Spectrum Band
- Low-Band (less than 1 GHz)
- Mid-Band (1-6 GHz)
- High-Band / mmWave (above 24 GHz)
- By Network Architecture
- Non-Standalone (NSA)
- Standalone (SA)
- By Core Network Technology
- Software-Defined Networking (SDN)
- Network Function Virtualization (NFV)
- Multi-access Edge Computing (MEC)
- Network Slicing
- By End-user Vertical
- Consumer Electronics
- Automotive and Mobility
- Industrial Manufacturing
- Healthcare and Life Sciences
- Energy and Utilities
- Public Safety and Defense
- Smart Cities and Infrastructure
- Other Verticals (Retail, Media, Agriculture)
- By Geography
- North America
- United States
- Canada
- South America
- Brazil
- Argentina
- Rest of South America
- Europe
- Germany
- United Kingdom
- France
- Italy
- Spain
- Russia
- Rest of Europe
- APAC
- China
- Japan
- South Korea
- India
- Australia
- Rest of APAC
- Middle East and Africa
- Middle East
- Saudi Arabia
- United Arab Emirates
- Turkey
- Rest of Middle East
- Africa
- South Africa
- Nigeria
- Rest of Africa
- Middle East
- North America
Data Sources, Market Sizing, and Validation
Desk Research
Desk research was used to set the starting structure of the model and to make sure basic industry totals line up with real world rollout activity. We referenced public sources such as the ITU for telecom indicators, the GSMA for 5G adoption and coverage signals, the FCC and similar national regulators for spectrum and licensing context, and the OECD for broadband and mobile data metrics.
To convert these indicators into usable sizing inputs, company annual reports, investor decks, and press releases were reviewed to understand capex direction, equipment mix, and the pace of 5G site upgrades. Patent databases and an import and export shipment level database were also used selectively to cross check where hardware demand was trending by major manufacturing hubs. This list is not exhaustive, and other public and paid sources were referred to for data collection, validation, and research clarification.
Primary Interviews and Surveys
Primary calls and structured surveys were run with network operators, infrastructure integrators, and product and service providers across the value chain so assumptions from desk work could be challenged and refined. For a global market, we spread discussions across APAC, EMEA, and the Americas to test differences in rollout timing, spectrum mix, and deployment choices, including standalone versus non-standalone configurations.
Distribution of primary research fieldwork respondents
| Company type | Respondent position | Region |
|---|---|---|
| Top tier: 37% | CXOs: 14% | APAC: 45% |
| Mid tier: 47% | Functional/Unit leaders: 26% | EMEA: 31% |
| Smaller Players: 16% | Managers: 60% | Americas: 24% |
Market-Sizing & Forecasting
The core sizing logic starts with a top-down build, where network rollout indicators and telecom investment signals are used to reconstruct the addressable spending pool for 5G infrastructure. Once that total is formed, it is split and sanity checked using selective bottom-up approximations, such as sampled pricing by equipment type multiplied by likely unit volumes from rollout plans and channel checks.
Inputs that matter in this market include 5G base station and small cell deployment pace, spectrum bands being used (sub-6 GHz versus mmWave), transport upgrades for fronthaul and backhaul, core network modernization timing, including cloud native transitions, and operator capex cycles by region. When some country level inputs are missing, gaps are handled through proxy ratios from comparable markets, then adjusted after interviews so we do not overstate early stage rollouts.
For forecasting, we rely on scenario analysis supported by trend smoothing on key drivers, because timing can shift when spectrum policies, supply constraints, or macro capex conditions change. The final trajectory is only accepted after assumptions on rollout cadence and pricing progression are consistent with what practitioners say they are seeing in the field.
Data Validation & Update Cycle
Validation is done through multiple checks so the model does not drift away from real deployment activity. Outputs are compared with independent signals like operator capex guidance, reported network coverage expansions, and major contract announcements, and then variances are reviewed before sign-off.
When a new spectrum award, a policy change, or a clear shift in rollout pace is observed, we re-contact relevant experts to retest the assumptions that drive the biggest sensitivities. Reports are refreshed annually, and material events can trigger an interim update. Before delivery, a final analyst pass is completed so clients receive the latest updated view.
Mordor Intelligence's 5g Infrastructure Market Size Compared Against Other Published Estimates
Published market sizes for 5G infrastructure can look far apart, even when everyone is discussing the same broad idea of building 5G networks. The main reason is that each publisher draws the line differently around what counts as infrastructure revenue and how fast the rollout curve is assumed to move across regions.
The gap is usually driven by scope choices, for example whether spectrum payments, devices, or non-cellular connectivity are counted. It also depends on how services versus only equipment are handled, and how pricing and mix shifts are modeled as networks move from early deployments to broader coverage. Differences also come from currency conversion timing and whether the forecast assumes an aggressive acceleration in standalone core upgrades versus a steadier transition.
Benchmark comparison
| Source | Market Size | Gaps in Research Methodology |
|---|---|---|
| Mordor Intelligence | USD 19.86 B (2026) | |
| Global Consultancy A | USD 20.05 B (2024) | Uses an earlier base year and a segmentation lens that can mix residential-driven rollout momentum with broader connectivity spend, which can lift the implied run rate when mapped forward without rechecking rollout timing. |
| Industry Publisher B | USD 41.39 B (2025) | Reports a much higher near-term value, which can happen when adjacent categories are bundled into infrastructure and when price and volume assumptions are carried forward from peak buildout years without enough normalization by region. |
The benchmark table shows a wide spread in starting values across nearby years, and in Mordor Intelligence's model the total is limited to infrastructure hardware, software, and managed services that create, transport, and control 5G traffic, while excluding spectrum auction proceeds and end user devices. Once those boundaries are kept consistent and rollout inputs are cross checked against real deployment signals, the result becomes easier to trace and to update as new information comes in.


Key Questions Answered in the Report
What is the 5G infrastructure market size in 2026?
The market stands at USD 19.86 billion in 2026 and is projected to reach USD 67.52 billion by 2031 at a 27.73% CAGR.
Which region shows the strongest growth in 5G infrastructure?
Asia Pacific leads with 23.80% share in 2025 and is forecast to expand at a 31.40% CAGR through 2031.
Which infrastructure layer is growing fastest?
Cloud-native core networks post the highest 31.10% CAGR, outpacing RAN and xHaul spending.
How quickly are operators moving to standalone 5G?
Standalone architectures are increasing at a 33.80% CAGR as carriers migrate away from non-standalone deployments.
What is the most significant growth driver?
Rising machine-to-machine and IoT device density contributes roughly +4.2% to the market’s projected CAGR.
How concentrated is the vendor landscape?
The four largest suppliers control 89% of global revenue, giving the market a concentration score of 9/10.
Page last updated on:


 Your data is secure and never sold or shared.


