5G Connection Market Size and Share
Market Overview
| Study Period | 2020 - 2031 |
|---|---|
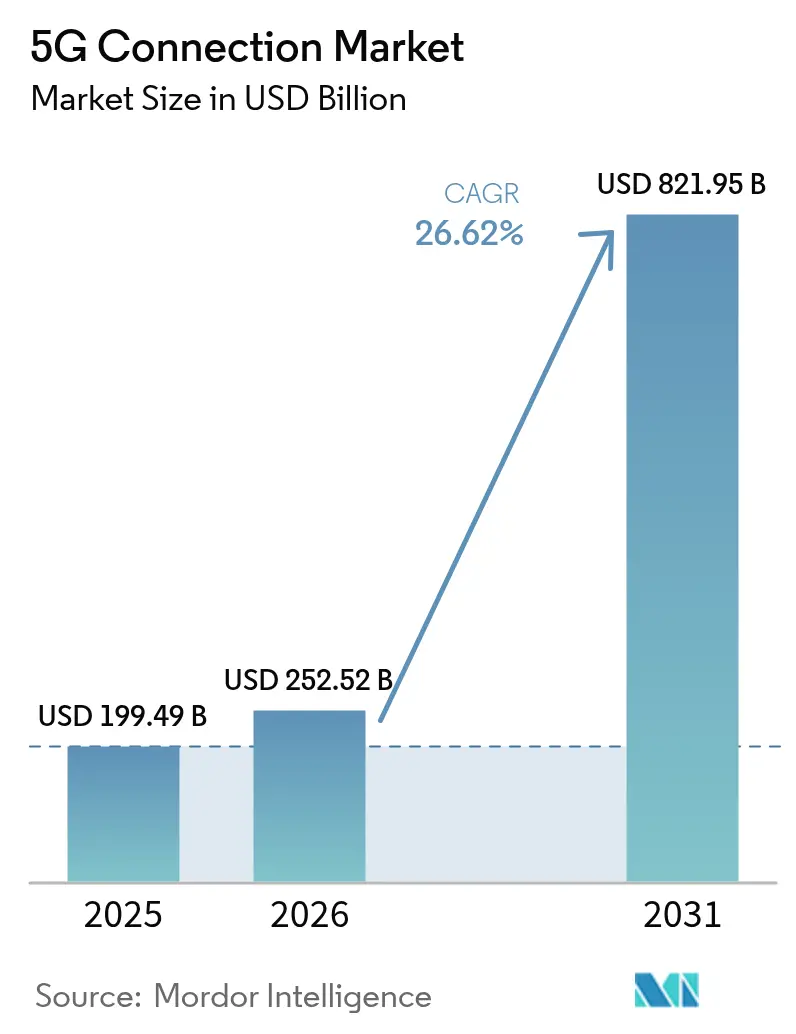
| Market Size (2026) | USD 252.52 Billion |
| Market Size (2031) | USD 821.95 Billion |
| Growth Rate (2026 - 2031) | 26.62% CAGR |
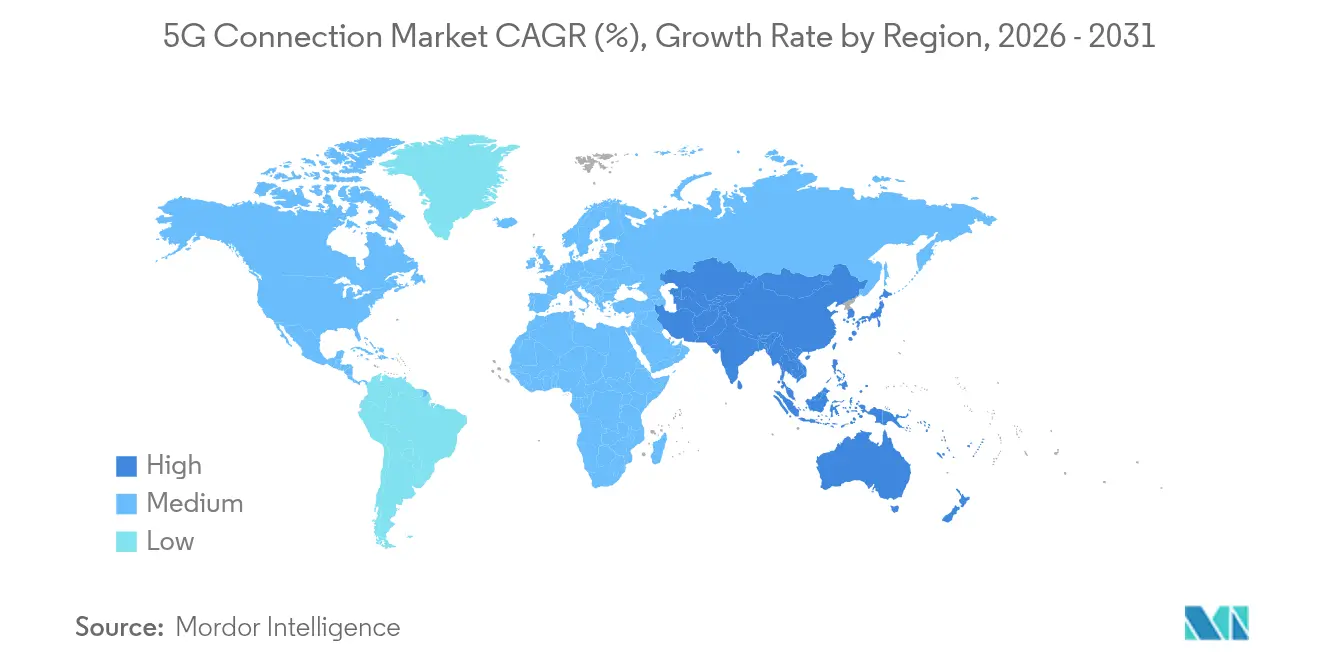
| Fastest Growing Market | Asia Pacific |
| Largest Market | Asia Pacific |
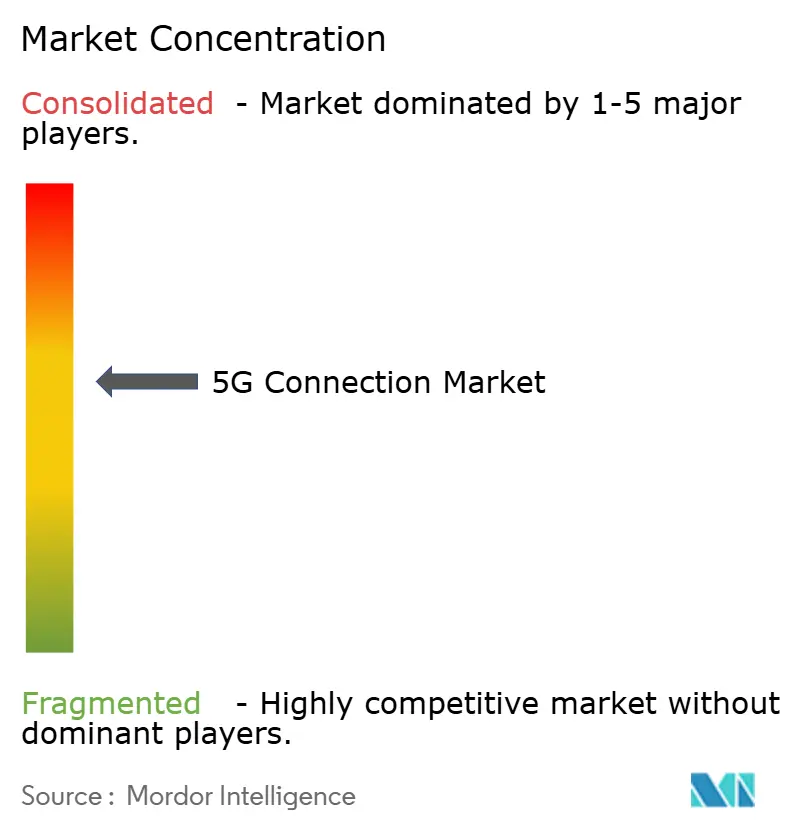
| Market Concentration | Medium |
Major Players *Disclaimer: Major Players sorted in no particular order Image © Mordor Intelligence. Reuse requires attribution under CC BY 4.0. | |
5G Connection Market Analysis by Mordor Intelligence
The 5G connections market size was valued at USD 199.49 billion in 2025 and estimated to grow from USD 252.52 billion in 2026 to reach USD 821.95 billion by 2031, at a CAGR of 26.62% during the forecast period (2026-2031). Commercial roll-outs have progressed from coverage expansion to network densification, enabling rapid adoption of advanced capabilities such as slicing, edge computing, and RedCap devices. Asia-Pacific accounts for 52% of global subscriptions thanks to China’s 4.4 million base stations and India’s nationwide standalone build-out, while North America leads in Fixed Wireless Access (FWA) penetration. Operators are accelerating the shift from non-standalone (NSA) to standalone (SA) cores as SA unlocks higher monetization potential, particularly for enterprise and ultra-reliable low-latency (URLLC) use cases. Private 5G networks in manufacturing, healthcare, and automotive are scaling quickly, and network-API marketplaces promise additional revenue streams in the near term. However, high mid-band spectrum prices, rural coverage economics, and fiber price wars continue to temper growth in selected regions.
Key Report Takeaways
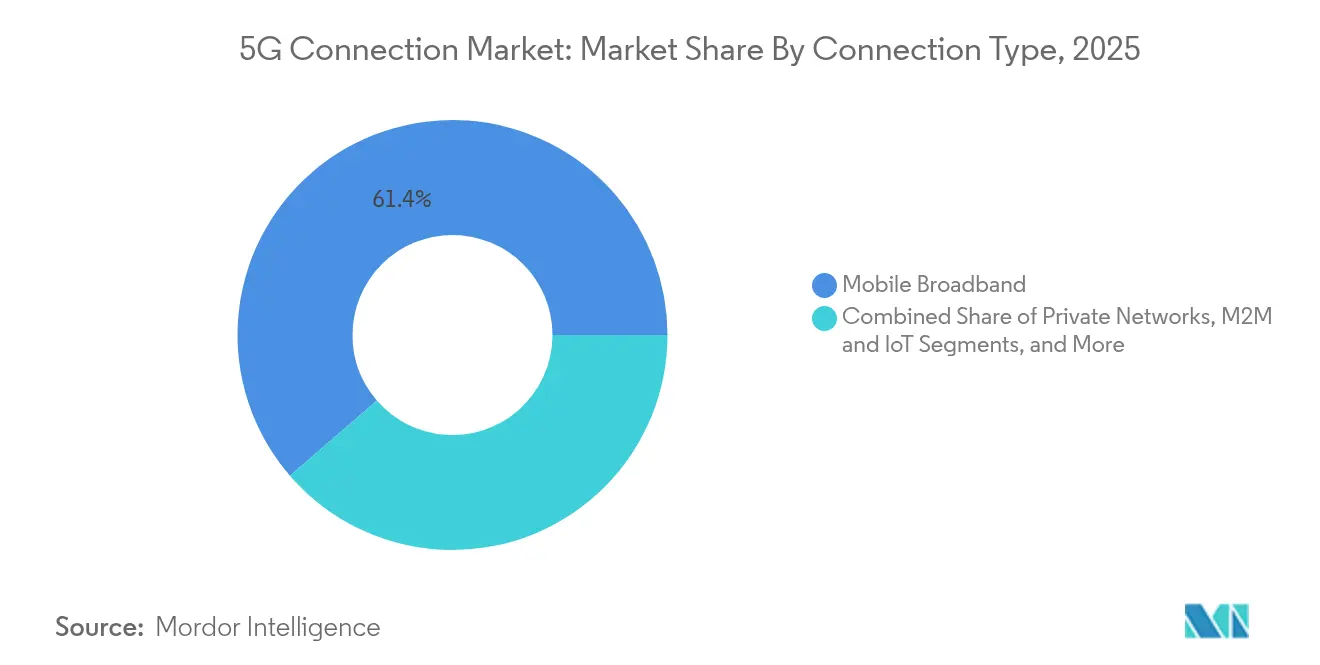
- By connection type, mobile broadband held 61.35% of the 5G connections market share in 2025, while M2M and IoT is projected to expand at a 27.9% CAGR through 2031.
- By end-user, consumer applications accounted for 75.32% share of the 5G connections market size in 2025; the enterprise segment is advancing at a 29.6% CAGR to 2031.
- By spectrum band, mid-band occupied 57.42% share in 2025, whereas mmWave is forecast to grow at a 30.1% CAGR.
- By network architecture, NSA represented a 68.92% share in 2025, and SA is set to increase at a 28.9% CAGR.
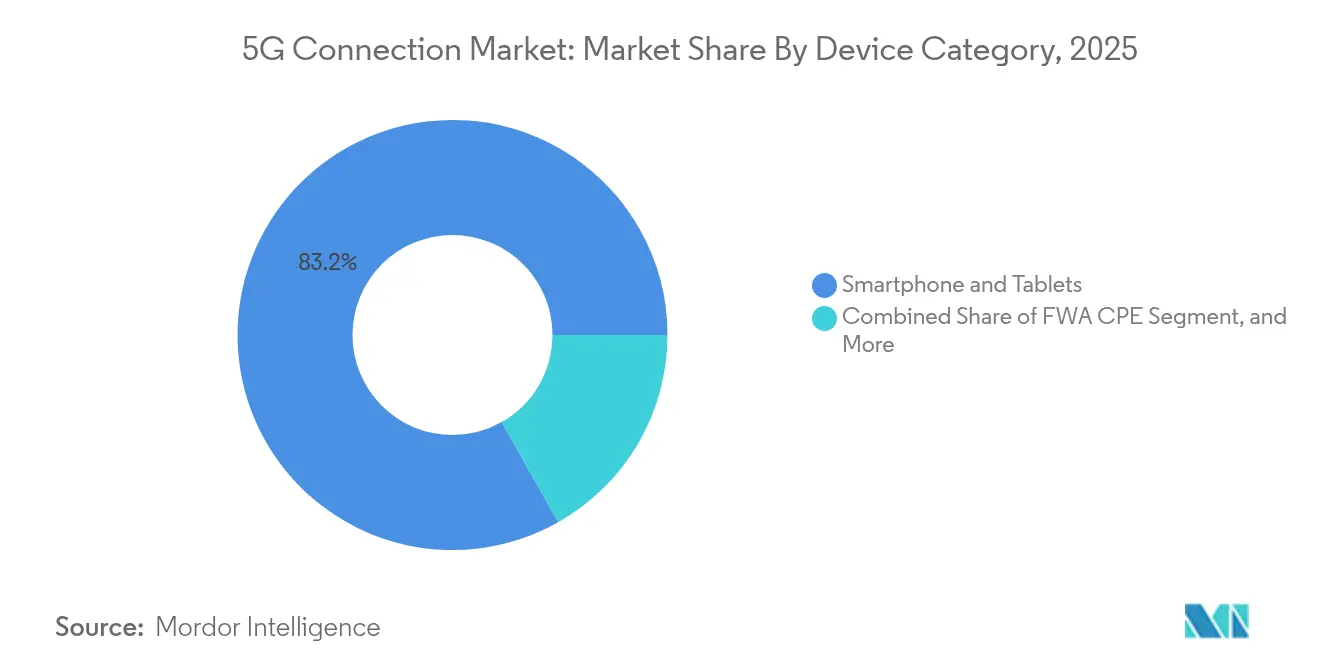
- By device category, smartphones and tablets captured an 83.18% share in 2025; FWA CPE is rising at a 31.2% CAGR.
- By service type, eMBB delivered an 79.14% share in 2025, with URLLC poised for a 28.1% CAGR.
- By geography, Asia-Pacific led with 51.64% share in 2025; the region also shows the fastest 29.4% CAGR outlook.
Note: Market size and forecast figures in this report are generated using Mordor Intelligence’s proprietary estimation framework, updated with the latest available data and insights as of 2026.
Global 5G Connection Market Trends and Insights
Drivers Impact Analysis*
| Driver | (~) % Impact on CAGR Forecast | Geographic Relevance | Impact Timeline |
|---|---|---|---|
| Surge in mobile data traffic | +8.2% | Global; strongest in APAC urban centers | Medium term (2-4 years) |
| Fixed Wireless Access becomes mainstream | +6.8% | North America and Europe; expanding to APAC | Short term (≤ 2 years) |
| Enterprise digitization and IoT uptake | +5.9% | Worldwide, led by China, Germany, US | Medium term (2-4 years) |
| Generative-AI-driven uplink demand | +4.7% | North America, China, select European markets | Long term (≥ 4 years) |
| Monetization via open-API ecosystems | +3.8% | Developed markets first; global roll-out expected | Long term (≥ 4 years) |
| Source: Mordor Intelligence | |||
Surge in mobile data traffic requiring higher-capacity networks
Monthly data usage per 5G line averages close to 70 GB—four times the 4G figure—fueled by cloud gaming and extended-reality services.[1]Ericsson, “Ericsson Mobility Report 2025,” ericsson.com China’s 4.4 million 5G base stations illustrate the scale needed to carry this load, and mid-band spectrum remains vital, although only one quarter of non-Chinese sites currently deploy it. As traffic migrates, operators prioritize additional carrier aggregation, Massive MIMO upgrades, and dynamic spectrum sharing. These investments underpin revenue growth in the 5G connections market while raising the urgency to optimize network energy efficiency.
Fixed Wireless Access (FWA) emerging as mainstream broadband alternative
US operators collectively serve 11.5 million FWA lines, with projections of 20 million by 2028 as median download speeds exceed 200 Mbps. Operators in India aim for 30 million FWA subscribers by 2027 by exploiting cost advantages over limited fiber roll-outs. Verizon generated USD 452 million in Q1 2024 FWA revenue, demonstrating the format’s near-term profitability. mmWave deployments increase urban capacity, and customer surveys show 44% preference for wireless home broadband. Collectively, these developments boost average revenue per user and broaden the 5G connections market addressable base.
Enterprise digitization and IoT accelerating 5G adoption
Annual spending on private 5G is expected to exceed USD 5 billion by 2028 under a 41% CAGR as manufacturing, healthcare, and logistics projects move from pilot to scale. More than 1,000 factory deployments are tracking efficiency gains between 15% and 20%, and Citizens Broadband Radio Service (CBRS) spectrum lowers entry costs in the US. Healthcare trials in Singapore and Sweden show measurable improvements in surgical precision and operational workflow, while the industrial IoT installed base will double by 2028. This enterprise momentum expands the 5G connections market beyond consumer segments.
Generative-AI–driven uplink surge spurring early 5G-SA roll-outs
Operators report that AI workloads can double uplink requirements, accelerating SA core upgrades to access native slicing and quality-of-service controls. Verizon’s collaboration with NVIDIA demonstrates real-time inference on private 5G with sub-10 ms latency. Communication-service‐provider surveys indicate 96% plan to commercialize multi-access edge sites in 2025, reinforcing demand for localized compute. As AI spending intensifies, SA coverage is likely to become a competitive baseline in the 5G connections market.
Restraints Impact Analysis*
| Restraint | (~) % Impact on CAGR Forecast | Geographic Relevance | Impact Timeline |
|---|---|---|---|
| High CAPEX and mid-band spectrum prices | -4.9% | Global; most acute in emerging markets | Medium term (2-4 years) |
| Rural coverage economics | -3.2% | Worldwide rural areas, sharply in developing regions | Long term (≥ 4 years) |
| Fiber price wars in dense urban areas | -2.1% | North America and Europe | Short term (≤ 2 years) |
| Source: Mordor Intelligence | |||
High CAPEX and mid-band spectrum costs
Global infrastructure outlays will exceed USD 600 billion during 2022-2025, and European auctions drive disproportionate financing burdens that leave only 2% of regional operators with SA cores versus 80% in China. Emerging-market carriers postpone auctions and explore tower-sharing to mitigate rising leverage. Network sharing in Nordic economies shows positive examples, but capital pressures still curb full participation in the 5G connections market.
Rural coverage economics remain unattractive
Low-density populations produce negative returns under conventional tower models, prompting satellite-terrestrial convergence strategies such as Verizon’s USD 100 million stake in AST SpaceMobile. UK data indicate 28% of rural premises still lack sufficient mobile service despite subsidy programs. Unless public funding expands or satellite solutions mature, rural uptake will lag broader 5G connections market penetration.
*Our forecasts treat driver/restraint impacts as directional, not additive. The impact forecasts reflect baseline growth, mix effects, and variable interactions.
Segment Analysis
By Connection Type: Enterprise applications diversify revenue streams
Mobile broadband accounted for 61.35% of the 5G connections market in 2025, underpinned by smartphone adoption and video consumption growth. At the same time, M2M and IoT links are expanding at a 27.9% CAGR, encouraged by private 5G network deployments across smart factories, hospitals, and logistics hubs. The enterprise tilt is materially increasing the 5G connections market size for network slicing, particularly as mission-critical communications and FWA subscriptions contribute incremental traffic. Hardware vendors have introduced RedCap chipsets that lower power draw for industrial sensors, accelerating M2M project viability. Edge-native architectures further catalyze M2M monetization as real-time analytics become table stakes in competitive manufacturing.
Continued proliferation of cellular IoT endpoints is projected to double device counts by 2028, creating relentless demand for cost-optimized modules and simplified onboarding tools. Mission-critical communication use cases, from FirstNet expansion in the US to nationwide public-safety networks in Korea, widen service differentiation opportunities. The resulting diversity cements a new equilibrium in which consumer traffic remains large, yet enterprise traffic captures the outsized share of future 5G connections market growth.


By End-User: Enterprise segment outpaces consumer expansion
Consumer use retained 75.32% share of the 5G connections market size in 2025 as streaming and gaming sustained mobile broadband traffic. Nonetheless, enterprise lines will deliver a 29.6% CAGR through 2031, powered by digital-transformation mandates in automotive, healthcare, and energy. Manufacturing stands out: more than 1,000 active projects report 15–20% gains in line efficiency after switching to private 5G. Hospitals in Singapore and Sweden show reduced surgery times and enhanced patient outcomes once ultra-low-latency video links are integrated.
Smart-city programs are also deploying surveillance cameras, connected streetlights, and environmental monitors, each adding to the enterprise subscriber base. Utilities turn to 5G for real-time grid balancing, and oil-and-gas operators prioritize automated inspection drones. These converging drivers tilt long-term revenue concentration toward the enterprise, increasing average revenue per connection and deepening stickiness within the 5G connections market.
By Spectrum Band: Mid-band retains leadership while mmWave accelerates
Mid-band spectrum contributed 57.42% of 5G connections market share in 2025 by combining capacity with national coverage economics. mmWave, despite penetration challenges, will post a 30.1% CAGR as urban densification and FWA rollout require multi-gigabit throughput. Operators in the US, Japan, and Australia demonstrate that new 360-degree antenna arrays and phased-array CPE can mitigate line-of-sight constraints. Sub-1 GHz bands preserve rural economics, especially for operators such as T-Mobile that leveraged 600 MHz to cover 98% of the US population.
Dynamic-spectrum-sharing tools now allow carriers to pivot channels between 4G and 5G, squeezing higher utilization out of finite assets. Meanwhile, regulators are drafting 7–15 GHz upper-mid-band frameworks for 6G, signaling additional capacity pathways. Optimal band portfolios will remain blended, yet incremental mmWave deployments will materially scale the 5G connections market size for data-intensive applications such as AR/VR entertainment and industrial automation.
By Network Architecture: Standalone transition gains speed
NSA networks dominated with a 68.92% share in 2025 because early adopters overlaid 5G radios on existing EPC cores. SA networks, supported by cloud-native cores and automation, are forecast to expand at a 28.9% CAGR as slicing, URLLC, and edge computing require full-stack upgrades. Sixty-one commercial SA networks were live by 2025, with the US and India completing nationwide footprints. Europe lags at 2% SA availability due to fragmented auction timetables and high license fees that slowed investment cycles.
SA architecture unlocks differentiated latency classes, deterministic quality of service, and traffic steering essential for enterprise SLAs. Operators can charge premium rates for slices that guarantee 5 ms latency or 99.999% availability. Monetization potential, coupled with streamlined operational costs from automation, cements SA as the long-term foundation of the 5G connections market.
By Device Category: FWA CPE widens household reach
Smartphones and tablets comprised 83.18% of connected devices in 2025, reflecting mass-market upgrade cycles and aggressive handset subsidies. However, FWA CPE shipments will rise at a 31.2% CAGR through 2031, extending 5G into households previously underserved by fixed broadband. RedCap modules add mid-tier price points and reduced power consumption for asset trackers and smart meters, broadening addressable enterprise segments. Industrial routers and ruggedized gateways see robust demand in automated warehouses and smart-grid substations, while AR/VR headsets are poised for uptake as 5G Advanced lowers latency thresholds.
Samsung–Hyundai RedCap field trials highlight long battery life and sub-100 Mbps throughput that satisfies factory sensor requirements at lower costs than full 5G modems. Collectively, these innovations expand form-factor diversity and reinforce device-led growth in the 5G connections market.
By Service Type: URLLC unlocks mission-critical adoption
eMBB traffic captured 79.14% of usage and revenue in 2025, but URLLC subscriptions will climb at a 28.1% CAGR as deterministic performance becomes indispensable for autonomous vehicles, telesurgery, and precision robotics. URLLC demonstrates sub-1 ms latency and 99.999% reliability in Ericsson cross-continental telesurgery trials. Massive Machine-Type Communications (mMTC) supports scaling to millions of low-cost sensors per km², enabling smart-utility and environmental-monitoring programs.
Time-Sensitive Networking (TSN) profiles are maturing within 3GPP Release 18, harmonizing wired industrial-Ethernet and wireless 5G latency budgets. Network slicing aligns resources with each service class, elevating monetization opportunities across the 5G connections market and encouraging application-specific pricing models.
Geography Analysis
Asia-Pacific accounted for 51.64% of global subscriptions in 2025 and is forecast to grow at a 29.4% CAGR through 2031, led by China’s 4.4 million base stations and India’s rapid standalone expansion. China’s digital-economy contribution is set to reach USD 2 trillion by 2030, reflecting widespread 5G platform adoption in manufacturing, retail, and services. India’s Reliance Jio operates over 1 million cloud-native cell sites, while expected FWA lines could climb from 5 million to 30 million by 2027. Japan’s and South Korea’s early commercial 5G Advanced launches sustain regional innovation leadership, and Southeast Asia projects USD 130 billion in incremental GDP impact by 2030.
North America is a mature yet innovation-centric arena where 98% of the population already has 5G coverage. T-Mobile’s nationwide SA deployment and 6.43 million FWA lines illustrate consumer and enterprise diversification. Verizon’s satellite partnership with AST SpaceMobile seeks to close residual rural gaps, while Canadian and Mexican carriers integrate 5G Advanced features such as RedCap. Focus now turns to monetizing network APIs, edge compute, and AI-assisted service orchestration, driving higher revenue density per site across the 5G connections market.
Europe displays mixed progress: Germany, Denmark and Finland exceed 95% population coverage, yet only 2% of subscriptions run on SA cores. The United Kingdom’s Vodafone-Three merger injects USD 14.86 billion into network upgrades aimed at rural inclusion, and Nordic spectrum-sharing models yield higher availability at lower cost. Continental operators now press regulators to streamline auctions and lower license fees to sustain investment cycles, seeking to close the SA gap and unlock greater value in the 5G connections market.

Competitive Landscape
The 5G connections market is moderately concentrated, with incumbents China Mobile, Verizon and T-Mobile defending share through dense mid-band and mmWave deployments. Mergers such as Vodafone-Three’s USD 20.28 billion deal in 2025 and Verizon’s USD 1 billion spectrum acquisition from UScellular alter regional hierarchies. Operators increasingly use strategic partnerships: Verizon teamed with NVIDIA on AI edge services, while Deutsche Telekom pilots live TV production over standardized network APIs.
Vendor competition encompasses Nokia, Ericsson and Huawei, along with more than 50 emerging suppliers serving private-RAN projects valued above USD 20 billion. Satellite-terrestrial convergence introduces new entrants such as AST SpaceMobile and SpaceX, compelling MNOs to diversify spectrum holdings and backhaul arrangements. The upcoming Aduna joint venture among 12 carriers and Ericsson seeks to monetize APIs globally, creating a new front for differentiation in the 5G connections market.
Edge-computing integration, network-slicing commercialization and rural-coverage innovation remain priority battlegrounds. Carriers that accelerate SA roll-outs and expose programmable interfaces are best positioned to capture enterprise spend and sustain premium ARPU in a maturing 5G connections market.
5G Connection Industry Leaders
AT&T Inc.
Verizon Communications Inc.
Vodafone Group Plc
T-Mobile US Inc. (Sprint Corporation)
Telstra Corporation Ltd
- *Disclaimer: Major Players sorted in no particular order

Recent Industry Developments
- June 2025: Vodafone-Three completes USD 20.28 billion merger to form the UK’s largest operator, pledging USD 14.86 billion for 5G upgrades
- April 2025: T-Mobile launches nationwide 5G Advanced with RedCap and enhanced carrier aggregation.
- March 2025: Zayo purchases Crown Castle Fiber Solutions for USD 4.25 billion, adding 90,000 route-miles to support AI and 5G traffic
- January 2025: Reliance Jio finalizes nationwide SA roll-out with 1 million sites and dedicated FWA slicing


Research Methodology Framework and Report Scope
Market Definitions and Key Coverage
Our study treats the 5G connection market as all paid, active links, consumer and enterprise, running on 3GPP-compliant 5G radio interfaces (NSA or SA) that exchange data through public networks and private campus grids. Revenues reflect operator or systems integrator charges for each live line, regardless of tariff plan, device class, or traffic volume.
Scope exclusion: device sales, infrastructure hardware, and spectrum license fees remain outside this revenue pool.
Segmentation Overview
- By Connection Type
- Mobile Broadband
- Fixed Wireless Access
- M2M and IoT
- Mission-critical Communications
- Private Networks
- By End-user
- Consumer
- Enterprise
- Manufacturing
- Healthcare
- Automotive and Transportation
- Smart Cities and Public Safety
- Energy and Utilities
- Retail and Logistics
- By Spectrum Band
- Sub-1 GHz (Low-Band)
- 1-6 GHz (Mid-Band)
- above 24 GHz (mmWave / High-Band)
- By Network Architecture
- Non-Standalone (NSA)
- Standalone (SA)
- By Device Category
- Smartphones and Tablets
- FWA CPE
- IoT Modules and Gateways
- Wearables and AR/VR Devices
- Industrial Routers and Rugged Modules
- By Service Type
- Enhanced Mobile Broadband (eMBB)
- Massive Machine-Type Communications (mMTC)
- Ultra-Reliable Low-Latency Communications (URLLC)
- By Geography
- North America
- United States
- Canada
- Mexico
- South America
- Brazil
- Rest of South America
- Europe
- Germany
- France
- United Kingdom
- Rest of Europe
- Asia Pacific
- China
- India
- Japan
- South Korea
- ASEAN
- Rest of Asia Pacific
- Middle East and Africa
- Middle East
- Saudi Arabia
- UAE
- Turkey
- Rest of Middle East
- Africa
- South Africa
- Nigeria
- Rest of Africa
- Middle East
- North America
Detailed Research Methodology and Data Validation
Primary Research
Mordor analysts interviewed network planners at tier-1 carriers, wholesale MVNO executives, core software vendors, and campus network integrators across North America, Europe, Asia Pacific, and the Gulf. These conversations validated roaming discount norms, private 5G penetration rates, and likely tariff resets once SA slicing matures, sharpening our desk-based assumptions.
Desk Research
We began with telecom regulator dashboards such as the FCC and China MIIT for live subscriber counts and spectrum allocations, followed by ITU and GSMA statistics that map population coverage, traffic per line, and ARPU trends. Trade associations like 5G Americas, ETSI, and the European Telecommunications Network Operators' Association clarified deployment timelines and standard releases. Company 10-Ks, investor decks, and quarterly KPIs supplied operator-level connection adds, churn, and blended tariffs, while peer-reviewed journals explained latency, capacity, and spectrum efficiency benchmarks that shape pricing. Paid intelligence from Dow Jones Factiva and D&B Hoovers filled financial or M&A gaps. This list is illustrative; numerous other open and paid sources informed the desk phase.
Market-Sizing & Forecasting
A top-down model converts reported cellular service revenue into 5G-only value by allocating line shares, adjusting for marginal 5G ARPU uplifts and net add run rates informed by regulator data. Results are cross-checked with selective bottom-up roll-ups of operator 5G sims, enterprise private line contracts, and average service prices, then tuned through iterative analyst reviews. Key inputs include: 1) quarterly 5G net additions, 2) blended 5G ARPU differentials versus 4G, 3) spectrum refarming schedules, 4) enterprise private grid adoption curves, and 5) regional inflation and FX paths. Multivariate regression projects each driver through 2030, producing the CAGR and yearly values. Data voids, common in emerging markets, are bridged with neighbor market proxies and operator guidance before final triangulation.
Data Validation & Update Cycle
Draft outputs run through variance checks against Ericsson Mobility Report totals and audited carrier filings; anomalies trigger re-contact with primary sources. Our team refreshes the model every twelve months, issuing interim tweaks if spectrum auctions, large M&A, or policy shifts materially alter the baseline.
Why Mordor's 5G Connections Baseline Earns Trust
Estimates for this fast-moving domain often diverge because publishers mix devices, infrastructure, or service stacks, choose different base years, or roll forward aggressive traffic growth multipliers.
Key gap drivers include: rival scopes bundle cloud or content revenue, apply uniform ARPU lifts across dissimilar regions, or freeze exchange rates that inflate long-range figures, whereas Mordor restricts scope to billable 5G lines, applies country-specific tariffs, and refreshes FX quarterly.
Benchmark comparison
| Market Size | Anonymized source | Primary gap driver |
|---|---|---|
| USD 199.49 bn (2025) | Mordor Intelligence | - |
| USD 196.42 bn (2025) | Global Consultancy A | Bundles SMS, IoT platform, and MEC service revenue into connection value |
| USD 125.36 bn (2024) | Trade Journal B | Excludes private 5G campus lines and applies flat regional ARPU, understating enterprise uptake |
In sum, the disciplined scope selection, driver-level forecasting, and annual refresh cadence employed by Mordor Intelligence deliver a balanced, transparent baseline that decision-makers can trace to clearly stated variables and repeatable steps.


Key Questions Answered in the Report
What is the current size of the 5G connections market?
Revenue stands at USD 252.52 billion in 2026 with a 26.62% CAGR outlook to 2031.
Which region leads the 5G connections market?
Asia-Pacific holds 51.64% of global subscriptions thanks to extensive Chinese and Indian deployments.
Why are standalone (SA) networks important?
SA cores enable slicing, ultra-low latency and edge-compute integration that unlock higher enterprise revenue.
How fast is Fixed Wireless Access growing?
US FWA lines reached 11.5 million in 2024 and could surpass 20 million by 2028 as median speeds exceed 200 Mbps the North America accounts for the largest market share in 5G Connections Market.
What is the main barrier to rural 5G coverage?
Low population density undermines tower economics, prompting operators to explore satellite-terrestrial convergence for cost-effective reach.
How large is the potential network-API revenue pool?
Industry estimates place network-API monetization between USD 10 billion and USD 30 billion as standardized interfaces reach developers.
Page last updated on:


