Industrial Chain Market Size and Share
Market Overview
| Study Period | 2020 - 2031 |
|---|---|
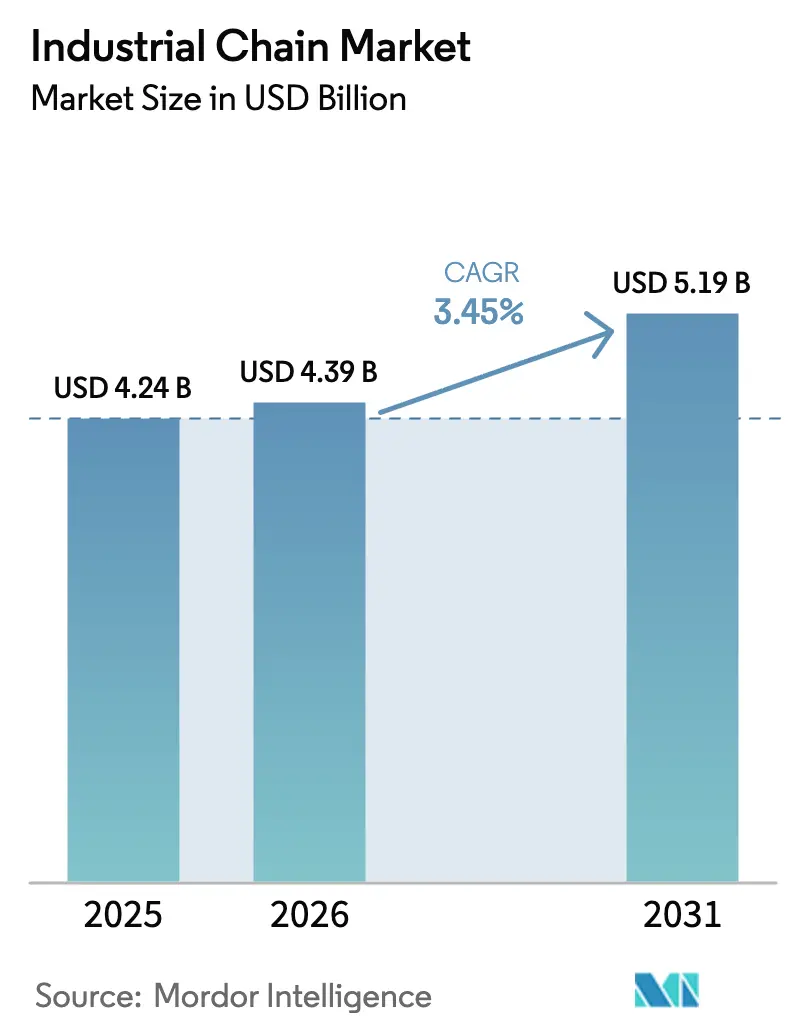
| Market Size (2026) | USD 4.39 Billion |
| Market Size (2031) | USD 5.19 Billion |
| Growth Rate (2026 - 2031) | 3.45% CAGR |
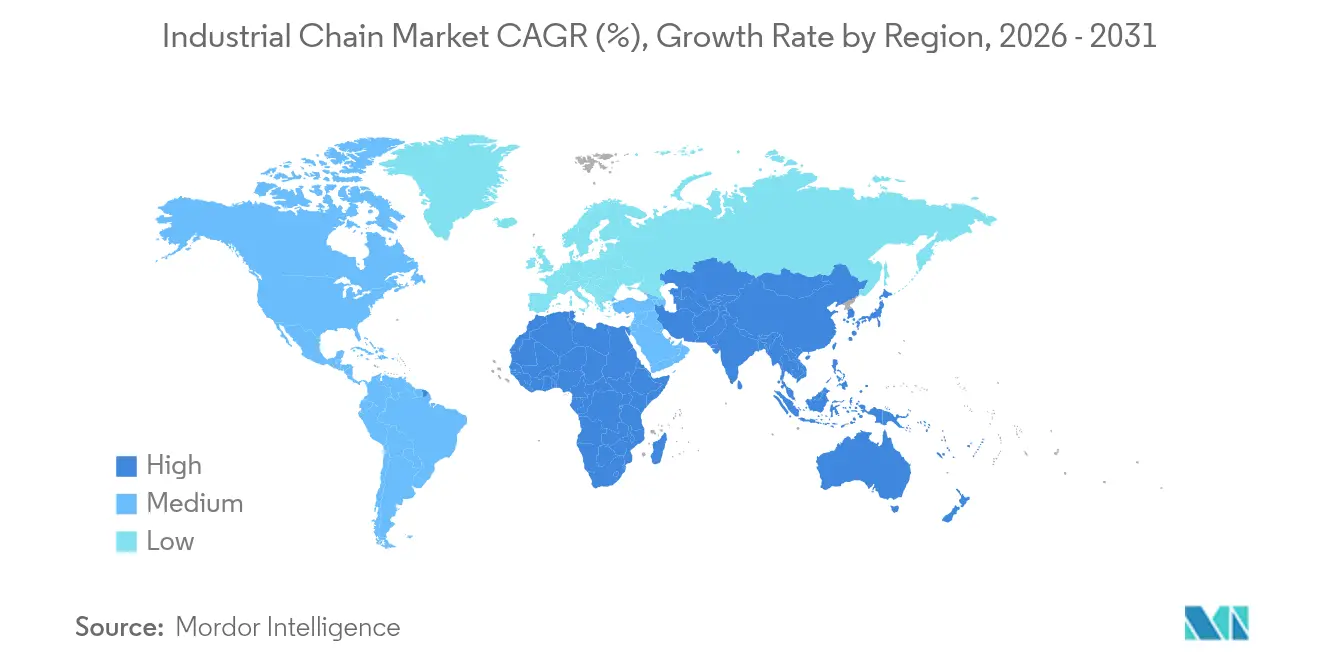
| Fastest Growing Market | Middle East and Africa |
| Largest Market | Asia Pacific |
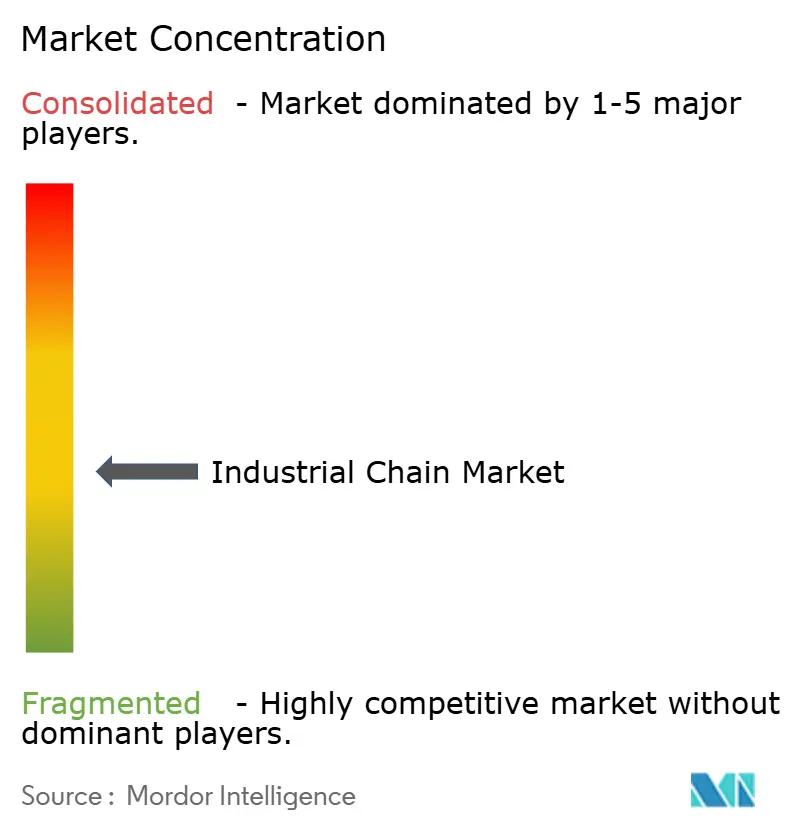
| Market Concentration | Medium |
Major Players *Disclaimer: Major Players sorted in no particular order Image © Mordor Intelligence. Reuse requires attribution under CC BY 4.0. | |
Industrial Chain Market Analysis by Mordor Intelligence
The industrial chain market size was valued at USD 4.24 billion in 2025 and estimated to grow from USD 4.39 billion in 2026 to reach USD 5.19 billion by 2031, at a CAGR of 3.45% during the forecast period (2026-2031). The current expansion stems from sustained capital expenditure in automation, the push for higher-efficiency power-transmission systems, and growing demand in hygiene-sensitive sectors such as food processing. Roller chains retain wide acceptance because of their proven durability, yet silent/timing chains gain traction as automotive electrification raises expectations for low-noise, high-precision drives. Carbon steel remains the baseline material, but the industrial chain market increasingly favours plastic and stainless variants where wash-down or weight-reduction is critical. At the same time, self-lubricating technologies capture attention as plant operators focus on extended service life, lower labour intensity, and compliance with volatile organic compound regulations. Geographically, the industrial chain market benefits from Asia-Pacific’s robust manufacturing ecosystem, while the Middle East and Africa record the fastest growth on the back of infrastructure spending and industrial diversification.[1]State Council Information Office of China, “China’s Manufacturing Sector Strives to Remain Competitive Amid Headwinds,” english.scio.gov.cn
Key Report Takeaways
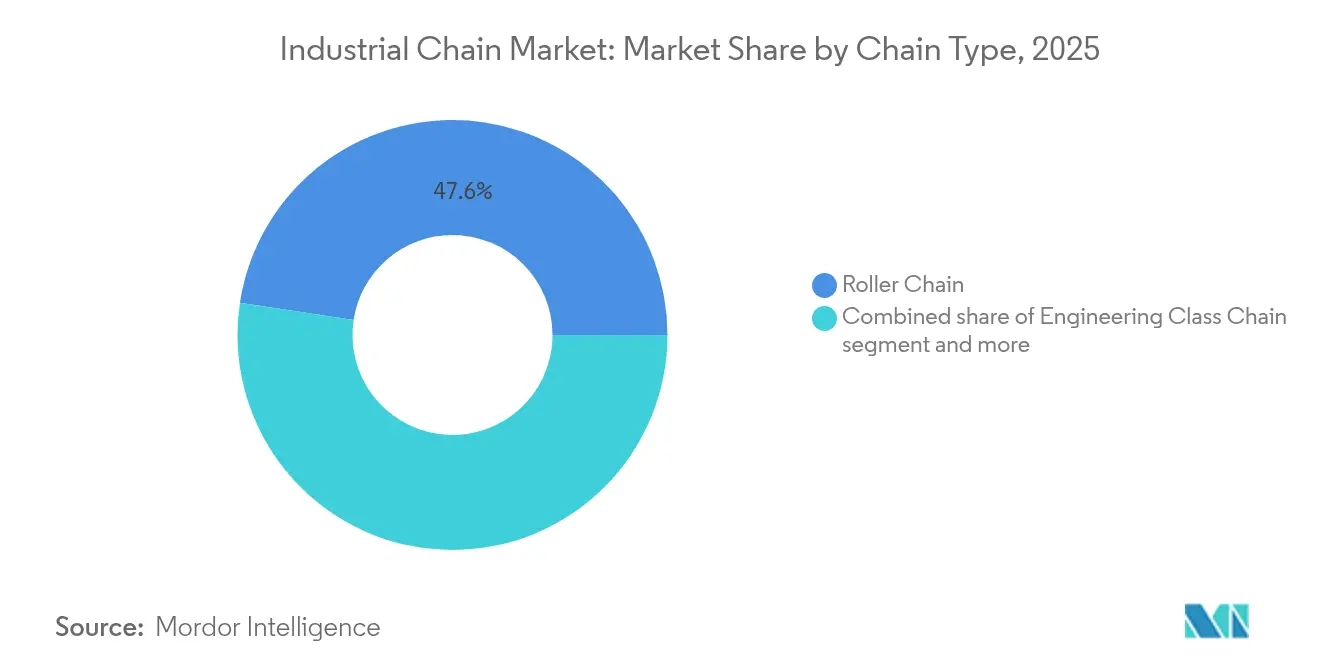
- By chain type, roller chains led with 47.60% of industrial chain market share in 2025, whereas silent/timing chains are projected to grow at a 6.55% CAGR through 2031.
- By material, carbon steel accounted for 56.80% share of the industrial chain market size in 2025; plastic chains are set to expand at a 7.45% CAGR to 2031.
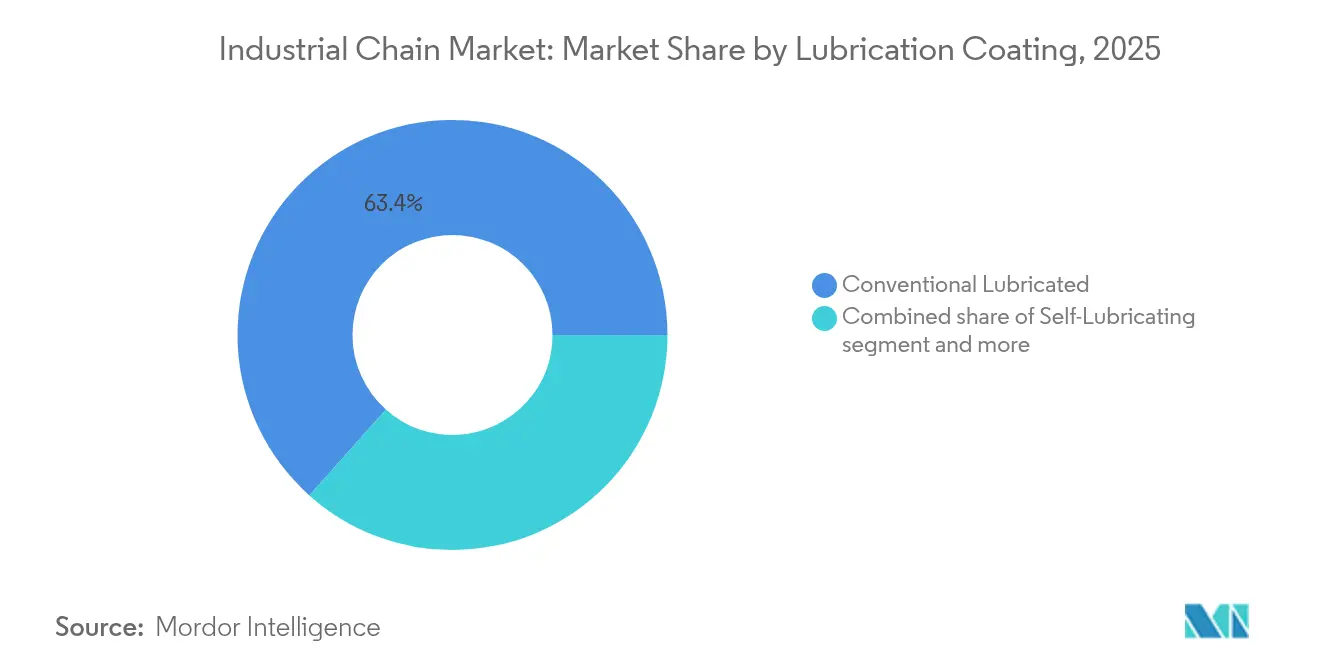
- By lubrication/coating, conventional lubricated systems held 63.40% of the industrial chain market size in 2025, while self-lubricating designs are advancing at an 8.25% CAGR.
- By end-user industry, automotive and mobility manufacturing captured 25.90% of industrial chain market share in 2025, whereas food and beverage processing posts the fastest 6.05% CAGR through 2031.
- By geography, Asia-Pacific dominated with 38.10% revenue share in 2025, while the Middle East and Africa register the highest 6.18% CAGR to 2031.
Note: Market size and forecast figures in this report are generated using Mordor Intelligence’s proprietary estimation framework, updated with the latest available data and insights as of 2026.
Global Industrial Chain Market Trends and Insights
Drivers Impact Analysis*
| Driver | (~) % Impact on CAGR Forecast | Geographic Relevance | Impact Timeline |
|---|---|---|---|
| Growing manufacturing footprint in Asia drives demand for roller and conveyor chains | 0.80% | Asia-Pacific core, spill-over to MEA | Medium term (2-4 years) |
| Advanced surface-treatments extend chain life in corrosive environments | 0.60% | Global, concentrated in offshore and chemical processing | Long term (≥ 4 years) |
| Food-grade stainless chains adopted to meet stricter hygiene codes | 0.40% | North America & EU, expanding to APAC | Short term (≤ 2 years) |
| Offshore wind turbines require large-pitch corrosion-resistant chains | 0.30% | Europe, North America coastal regions | Long term (≥ 4 years) |
| Embedded-sensor "smart chains" enable predictive maintenance | 0.20% | Global, early adoption in automotive and energy | Medium term (2-4 years) |
| Electrification of mobile equipment shifts power-transmission from hydraulics to chains | 0.30% | Global, led by Europe and North America | Medium term (2-4 years) |
| Source: Mordor Intelligence | |||
Growing Manufacturing Footprint in Asia Drives Demand for Roller and Conveyor Chains
Asia-Pacific’s manufacturing resurgence now emphasizes supply-chain resilience and digital integration. Chinese factories are upgrading to high-precision automated lines that rely on premium chains engineered for minimal downtime. Multinational producers favour suppliers that can demonstrate extended service intervals and predictive-maintenance capabilities, supporting mid-tier and premium product adoption across the industrial chain market. Regional contract manufacturers also specify conveyor chains with embedded sensors to mitigate unplanned stoppages, reinforcing the need for reliability over lowest-price sourcing. These dynamics help sustain volume growth even as unit prices rise modestly, lifting revenue across the industrial chain market.
Advanced Surface-Treatments Extend Chain Life in Corrosive Environments
Nickel-chromium and zinc-aluminium alloy coatings now outperform conventional galvanization, enabling service lives measured in multi-year cycles for offshore and chemical-plant duties. Operators of offshore wind turbines face intervention costs exceeding USD 50,000 per visit, so chains that defer replacement translate directly into lower levelized energy costs. The same treatments allow desalination facilities and acid-wash processes to specify chain drives instead of more expensive alternative mechanisms. Consequently, advanced coatings raise the value proposition within the industrial chain market by pairing premium pricing with demonstrable total-cost savings.
Food-Grade Stainless Chains Adopted to Meet Stricter Hygiene Codes
EU and FDA regulations push processors to eliminate external lubricants that risk product contamination. Lube-free plastic-stainless hybrid chains certified for incidental food contact now operate at temperatures up to 650°C while maintaining NSF H1 approval. Plants report shorter sanitation cycles and fewer recalls, supporting rapid payback despite higher acquisition cost. As leading retailers intensify audit requirements, food processors across North America, Europe, and Asia adopt these chains, expanding the addressable share of the industrial chain market. [2]Chain Guard, “CG-FSG-220-H1 Food Grade Extreme High Temperature White Graphite Lubricant,” chainguard.com
Electrification of Mobile Equipment Shifts Power-Transmission from Hydraulics to Chains
Battery-electric forklifts, agricultural machinery, and construction equipment rely on compact, high-torque chain drives that withstand duty cycles previously handled by hydraulic cylinders. European and North American OEMs embed these chains in modular drive units that simplify final assembly, expanding unit volumes and technology diversity in the industrial chain market.
Restraints Impact Analysis*
| Restraint | (~) % Impact on CAGR Forecast | Geographic Relevance | Impact Timeline |
|---|---|---|---|
| High upfront cost vs. belts and direct drives | -0.50% | Global, particularly price-sensitive markets | Short term (≤ 2 years) |
| Accelerating substitution by synchronous belt drives in packaging lines | -0.30% | North America & EU, spreading to APAC | Medium term (2-4 years) |
| VOC and lubricant-emission regulations raise compliance costs | -0.20% | California, Canada, expanding globally | Long term (≥ 4 years) |
| Supply risk of specialty alloy steel following geopolitical disruptions | -0.40% | Global, concentrated impact on high-end applications | Short term (≤ 2 years) |
| Source: Mordor Intelligence | |||
High Upfront Cost vs. Belts and Direct Drives
Capital-constrained buyers sometimes prioritize belts or direct drives that exhibit lower initial prices, even when life-cycle economics favour chains. This tendency is acute in emerging markets where financing charges magnify upfront differentials. To counter, chain suppliers package financing options and modular upgrade paths, reducing perceived barriers and defending share inside the industrial chain market.
Accelerating Substitution by Synchronous Belt Drives in Packaging Lines
New polymer compounds extend belt durability, tempting packagers to switch for quieter, lubricant-free operation. Chain providers respond with silent chain variants and food-grade coatings that narrow the noise gap while preserving load capacity, safeguarding their position within the industrial chain market.
*Our forecasts treat driver/restraint impacts as directional, not additive. The impact forecasts reflect baseline growth, mix effects, and variable interactions.
Segment Analysis
By Chain Type: Silent Chains Lead Innovation Drive
Silent/timing chains represent the fastest-growing niche, advancing at a 6.55% CAGR as electric vehicles demand low-noise, precision timing components. Roller chains, however, anchored 47.60% of industrial chain market share in 2025 by cementing their role as the versatile choice for conveyors, agricultural equipment, and general factory drives. Engineering class chains cater to mining and heavy construction where extreme loads exceed roller-chain ratings. Leaf chains occupy forklift mast assemblies that cannot accommodate roller chain pitch. Patent filings illustrate hybrid constructions that merge roller-chain wear resistance with silent-chain contact geometry, extending service intervals while suppressing vibration. Conveyor chains, especially in automated warehouses, broaden the addressable industrial chain market by integrating sensors for predictive maintenance.
Continued innovation positions silent/timing chains as an attractive upgrade path for OEMs targeting acoustic comfort in passenger cars and material-handling robots. Yet roller chains remain central to the industrial chain market, given expansive installed bases and low switching costs. Engineering class designs enjoy stable, project-driven demand aligned with commodity-bulk cycles, while leaf chains grow modestly alongside global forklift shipments. Collectively, these sub-segments keep the industrial chain market resilient across economic phases.


By Material: Plastic Chains Accelerate on Hygiene Demands
Carbon steel dominated with 56.80% share of industrial chain market size in 2025 due to its favourable strength-cost ratio. Plastic chains, powered by self-lubricating polymers, are expected to grow 7.45% CAGR through 2031 on account of food-safety directives and the weight-savings imperative in automated pick-and-place systems. Stainless steel retains a premium niche where wash-down cycles are frequent, while specialty alloy chains meet temperature or chemical extremes. Food-grade engineering plastics, including ultra-high-molecular-weight polyethylene, now deliver abrasion resistance sufficient for bulk-handling lines.
The industrial chain market benefits as processors replace stainless variants with lighter, quiet-running plastic links that reduce system inertia and energy use. Carbon steel remains foundational for heavy-duty services but rising labour costs make maintenance-free solutions more appealing. Specialty alloys maintain smaller but stable demand driven by offshore energy and petrochemical capital projects. This material diversification enlarges the industrial chain market without eroding core steel volumes.
By Lubrication/Coating: Self-Lubricating Technologies Transform Maintenance
Conventional lubricated chains still constituted 63.40% of industrial chain market size in 2025, reflecting ingrained maintenance routines across plants. Self-lubricating chains, projected to expand at 8.25% CAGR, embed oil-impregnated sintered bushings or solid-film coatings that remove daily greasing tasks. Dry/no-lube solutions win orders in electronics and pharmaceuticals, where particulate contamination is intolerable. Specialty coatings, such as nickel-molybdenum layers, lengthen service life and satisfy environmental rules that cap solvent emissions. Food-grade synthetic oils enable chains to run at 650 °C while remaining NSF H1 compliant.
Predictive maintenance accelerates adoption of smart chains capable of relaying real-time friction and tension data, aligning lubrication with actual wear rather than calendar intervals. These innovations lift average prices and reduce total cost of ownership, encouraging widespread replacement and fuelling value growth within the industrial chain market.
By End-User Industry: Food Processing Drives Fastest Growth
Automotive and mobility manufacturing led with 25.90% revenue share in 2025, as internal-combustion and electric platforms alike depend on timing-chain accuracy. Food and beverage processing, however, records the highest 6.05% CAGR, spurred by hygiene mandates and 24-hour production cycles. Energy and power markets purchase chains for wind-turbine yaw systems and fossil-fuel plants. Building-materials producers apply heavy roller and engineering-class chains in aggregate handling. Mining and metals users demand exceptional abrasion resistance, while agriculture and forestry equipment select specialized gathering chains to safeguard crop yield.
Automation and traceability imperatives in food plants propel adoption of plastic and stainless lube-free chains, expanding both volume and margins in the industrial chain market. Automotive electrification persists as a stable baseline, and energy transition sectors introduce incremental niches, supporting a balanced end-user portfolio.
Geography Analysis
Asia-Pacific controlled 38.10% of the industrial chain market in 2025, underpinned by China’s move toward intelligent manufacturing and India’s capacity additions. Government programs encourage high-value, precision production lines that specify advanced chain drives. Regional suppliers leverage proximity to metallurgical inputs and large OEM bases to shorten lead times and limit freight costs, reinforcing their competitiveness. Southeast Asian diversification further underpins regional volume, while proximity advantages keep sourcing local, stabilizing the industrial chain market.
The Middle East and Africa exhibit a 6.18% CAGR, the fastest globally. Gulf Cooperation Council infrastructure plans and African mining expansions require robust conveyor, bucket, and leaf chains capable of rugged operation. Local content requirements stimulate green-field chain assembly ventures, filling a historic supply gap and adding depth to the industrial chain market. Food processing and packaging investments driven by population growth elevate demand for hygienic stainless and plastic chains.
North America and Europe represent mature arenas where replacement and technology upgrades shape demand. Operators prioritize reliability, noise-reduction, and environmental compliance, steering purchases toward self-lubricating and smart chains. Offshore wind rollouts across both regions create fresh demand for large-pitch, corrosion-resistant products able to survive marine climates. Automotive electrification reinforces silent chain adoption in engine-downsize hybrids and full battery electric vehicles, adding consistency to industrial chain market revenue streams.

Competitive Landscape
The industrial chain market is moderately fragmented. Leading manufacturers combine regional factories with proprietary materials science to defend margins rather than competing solely on price. After geopolitical alloy shortages, vertically integrated steel sourcing became a strategic priority, insulating top players from supply volatility. Innovation centers on sensor-embedded chains, advanced coatings, and lube-free bushings that shrink downtime. These technologies command premiums and create differentiation that smaller producers struggle to match.
Strategic moves reinforce this posture. Renold plc acquired MAC Chain Company in February 2025 to extend its North American conveyor portfolio while gaining forestry-sector domain expertise. SKF broadened its lubrication systems reach through the purchase of John Sample Group’s assets in December 2024, enhancing its embedded-maintenance offerings. Donghua Chain Group secured “Hangzhou Headquarters Enterprise” status and passed IATF 16949 audits, signalling quality leadership within China’s domestic landscape. Patent activity, such as BorgWarner’s silent-chain developments, evidences a steady flow of intellectual property aimed at noise attenuation and durability.
Overall, competition gravitates toward application-specific solutions. Offshore wind chains carry distinct design requirements compared with food-grade variants. Suppliers that field broad, certified catalogues gain purchase preference from OEMs streamlining vendor counts. Market consolidation via targeted acquisitions strengthens distribution breadth and R&D scale, shaping an increasingly sophisticated industrial chain market. [4]Investegate, “Acquisition of MAC Chain Company,” investegate.co.uk
Industrial Chain Industry Leaders
Tsubakimoto Chain Co.
Regal Rexnord Corporation
Renold plc
iwis antriebssysteme GmbH & Co. KG
Donghua Chain Group
- *Disclaimer: Major Players sorted in no particular order

Recent Industry Developments
- February 2025: Renold plc completed acquisition of MAC Chain Company Limited for USD 31.4 million, strengthening its North American conveyor chain offering.
- December 2024: SKF signed agreement to acquire John Sample Group’s Lubrication and Flow Management businesses for SEK 550 million to expand its South-East Asia footprint.
- October 2024: Donghua Chain Group was honoured as a Hangzhou Headquarters Enterprise and passed AAA measurement system audits, underscoring quality credentials.
- May 2024: Aisan Industry Co. tallied consolidated net sales of JPY 314.3 billion for FY 2024, buoyed by automotive component demand.


Global Industrial Chain Market Report Scope
Industrial chains serve as mechanical devices across diverse industrial applications, facilitating power transmission, material conveyance, and load support. Engineered to endure heavy loads, high speeds, and challenging operating conditions, these chains play a pivotal role in various sectors. This study monitors the revenue generated from industrial chain sales across multiple end-user industries. It examines the driving factors, restraints, growth trends, and macroeconomic influences shaping the market.
The industrial chain market is segmented by type (roller chain, engineering class chain, leaf chain, and other types), end-user industry (automotive manufacturing, energy and power, food and beverage, building and construction, and other end-user industries), and geography (North America, Europe, Asia, Australia and New Zealand, Latin America, and Middle East and Africa). The market sizes and forecasts are provided in terms of value (USD) for all the above segments.
| Roller Chain |
| Engineering Class Chain |
| Leaf Chain |
| Silent/Timing Chain |
| Conveyor Chain |
| Others |
| Carbon Steel |
| Stainless Steel |
| Plastic/Polymer |
| Specialty Alloys |
| Conventional Lubricated |
| Self-Lubricating |
| Dry / No-Lube |
| Specialty-Coated (Nickel, Zinc-Al, etc.) |
| Automotive and Mobility Manufacturing |
| Energy and Power (incl. Renewables) |
| Food and Beverage Processing |
| Building and Construction Materials |
| Mining and Metals |
| Agriculture and Forestry Equipment |
| Other Industries |
| North America | United States |
| Canada | |
| Mexico | |
| Europe | United Kingdom |
| Germany | |
| France | |
| Italy | |
| Rest of Europe | |
| Asia-Pacific | China |
| Japan | |
| India | |
| South Korea | |
| Rest of Asia-Pacific | |
| Middle East | Israel |
| Saudi Arabia | |
| United Arab Emirates | |
| Turkey | |
| Rest of Middle East | |
| Africa | South Africa |
| Egypt | |
| Rest of Africa | |
| South America | Brazil |
| Argentina | |
| Rest of South America |
| By Chain Type | Roller Chain | |
| Engineering Class Chain | ||
| Leaf Chain | ||
| Silent/Timing Chain | ||
| Conveyor Chain | ||
| Others | ||
| By Material | Carbon Steel | |
| Stainless Steel | ||
| Plastic/Polymer | ||
| Specialty Alloys | ||
| By Lubrication / Coating | Conventional Lubricated | |
| Self-Lubricating | ||
| Dry / No-Lube | ||
| Specialty-Coated (Nickel, Zinc-Al, etc.) | ||
| By End-user Industry | Automotive and Mobility Manufacturing | |
| Energy and Power (incl. Renewables) | ||
| Food and Beverage Processing | ||
| Building and Construction Materials | ||
| Mining and Metals | ||
| Agriculture and Forestry Equipment | ||
| Other Industries | ||
| By Geography | North America | United States |
| Canada | ||
| Mexico | ||
| Europe | United Kingdom | |
| Germany | ||
| France | ||
| Italy | ||
| Rest of Europe | ||
| Asia-Pacific | China | |
| Japan | ||
| India | ||
| South Korea | ||
| Rest of Asia-Pacific | ||
| Middle East | Israel | |
| Saudi Arabia | ||
| United Arab Emirates | ||
| Turkey | ||
| Rest of Middle East | ||
| Africa | South Africa | |
| Egypt | ||
| Rest of Africa | ||
| South America | Brazil | |
| Argentina | ||
| Rest of South America | ||


Key Questions Answered in the Report
What is the current size of the industrial chain market?
The industrial chain market is worth USD 4.39 billion in 2026, with revenue expected to grow steadily to USD 5.19 billion by 2031.
Which chain type is growing the fastest?
Silent/timing chains post the highest growth, advancing at a 6.55% CAGR through 2031 as electric vehicles and automated equipment favour low-noise, precision drives.
Why are self-lubricating chains gaining popularity?
They remove daily greasing tasks, cut downtime, and help users comply with volatile-organic-compound regulations, leading to an 8.25% CAGR within this segment.
Which region offers the strongest growth opportunity?
The Middle East and Africa register the highest 6.18% CAGR, driven by infrastructure expansion and industrial diversification.
Who are the leading competitors in the market?
Key players include Tsubakimoto Chain, Renold, Regal Rexnord, iwis antriebssysteme, Donghua Chain Group, The Timken Company, and SKF, each leveraging technology and vertical integration to differentiate.
How are environmental regulations affecting chain selection?
Rules limiting lubricant emissions and promoting recyclability drive adoption of self-lubricating designs and advanced surface treatments that extend service life while lowering environmental impact.
Page last updated on:


