ATM Market Size and Share
Market Overview
| Study Period | 2020 - 2031 |
|---|---|
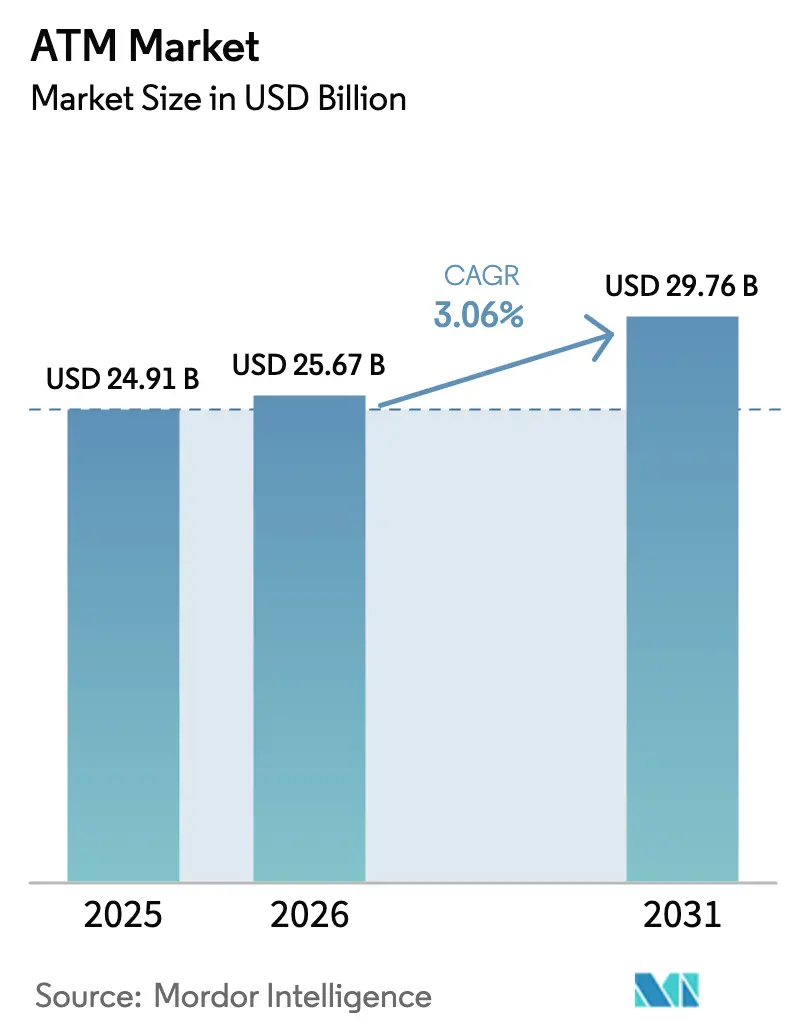
| Market Size (2026) | USD 25.67 Billion |
| Market Size (2031) | USD 29.76 Billion |
| Growth Rate (2026 - 2031) | 3.06% CAGR |
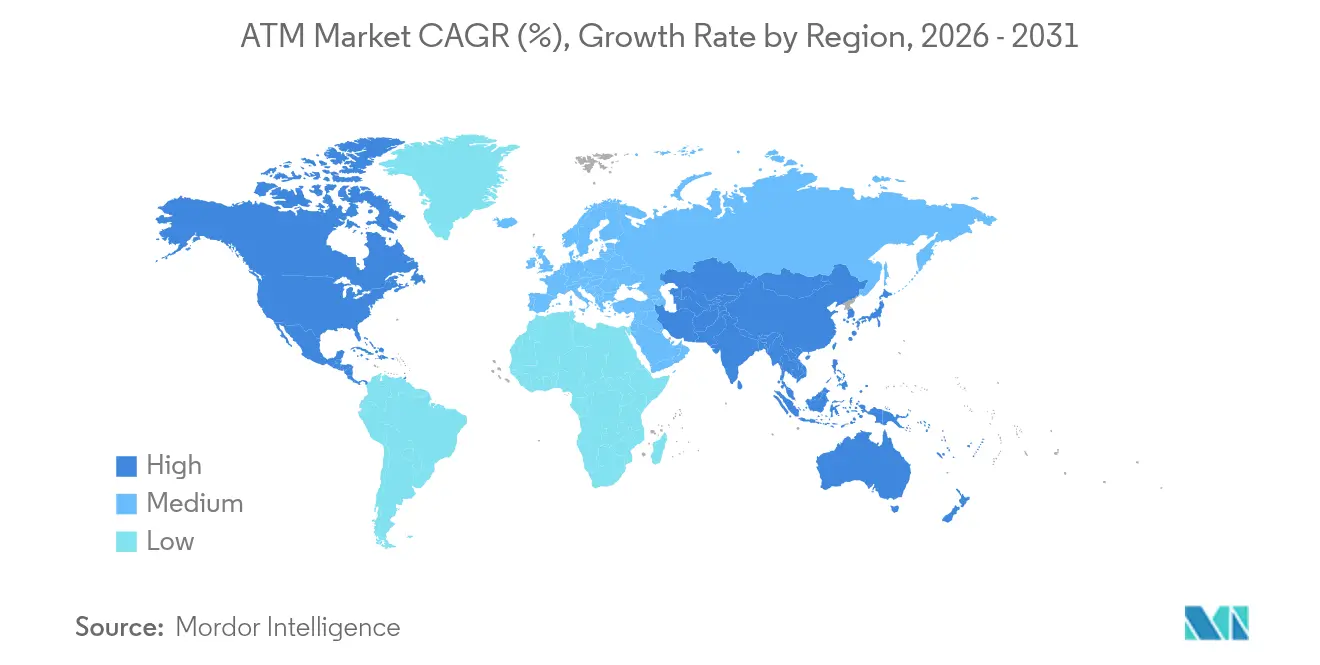
| Fastest Growing Market | North America |
| Largest Market | Asia Pacific |
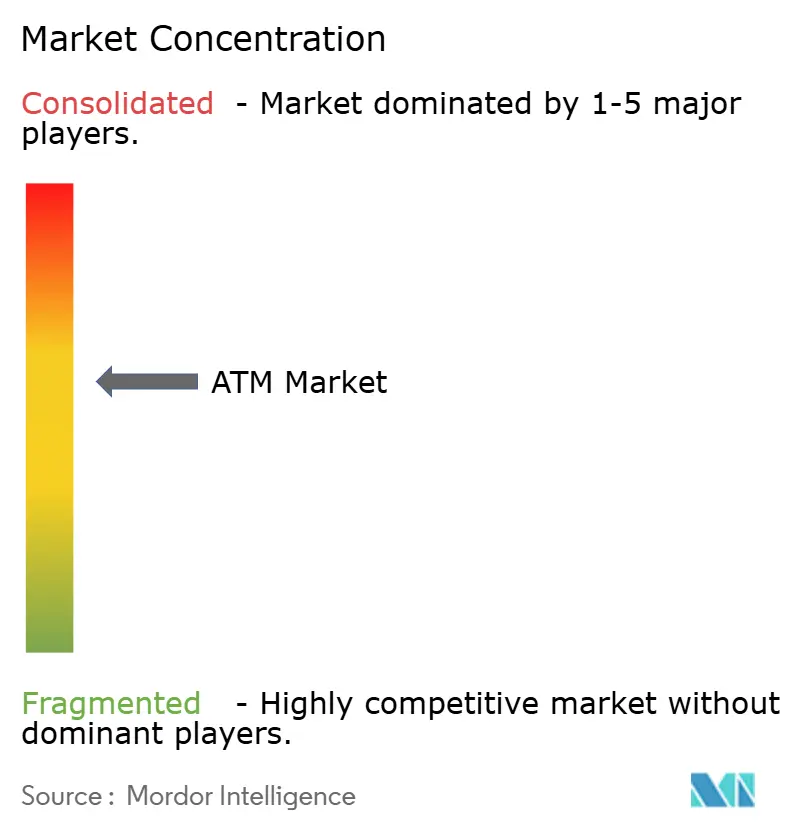
| Market Concentration | Medium |
Major Players *Disclaimer: Major Players sorted in no particular order Image © Mordor Intelligence. Reuse requires attribution under CC BY 4.0. | |
ATM Market Analysis by Mordor Intelligence
ATM Market size in 2026 is estimated at USD 25.67 billion, growing from 2025 value of USD 24.91 billion with 2031 projections showing USD 29.76 billion, growing at 3.06% CAGR over 2026-2031.
Sustained investment in smart terminals, cash-recycling modules, and contactless enablement keeps physical self-service relevant even as digital banking grows. Banks are refreshing fleets to lower cash-handling costs, while independent deployers add capacity in underbanked urban corridors. Retailers and convenience chains view on-premise ATMs as foot-traffic magnets that also cut cash-management pain points. Meanwhile, regulators in emerging economies frame accessible cash as a financial-inclusion priority, ensuring continued site roll-outs that underpin the automated teller machine market in both developed and developing regions.
Key Report Takeaways
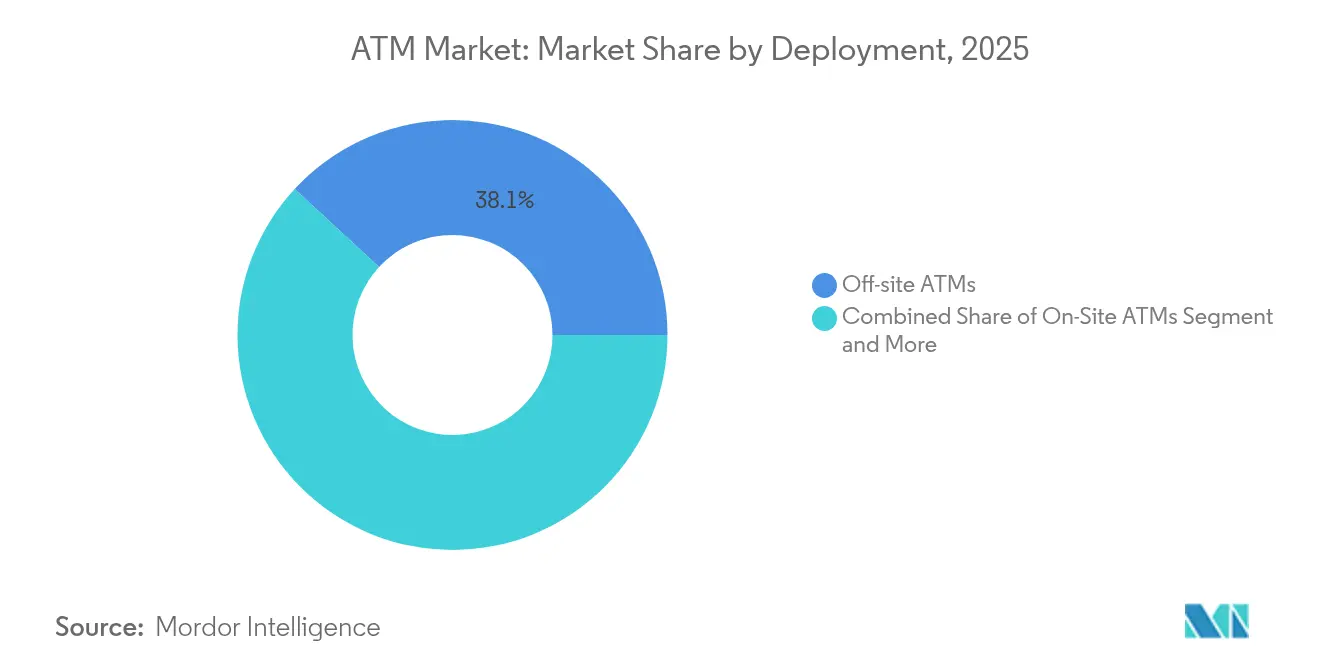
- By deployment, off-site installations led with 38.12% revenue share of the ATM market in 2025; mobile ATMs are forecast to expand at an 8.61% CAGR to 2031.
- By type, cash-dispenser units accounted for 40.72% of the market share in 2025, while smart/intelligent machines are advancing at an 8.80% CAGR through 2031.
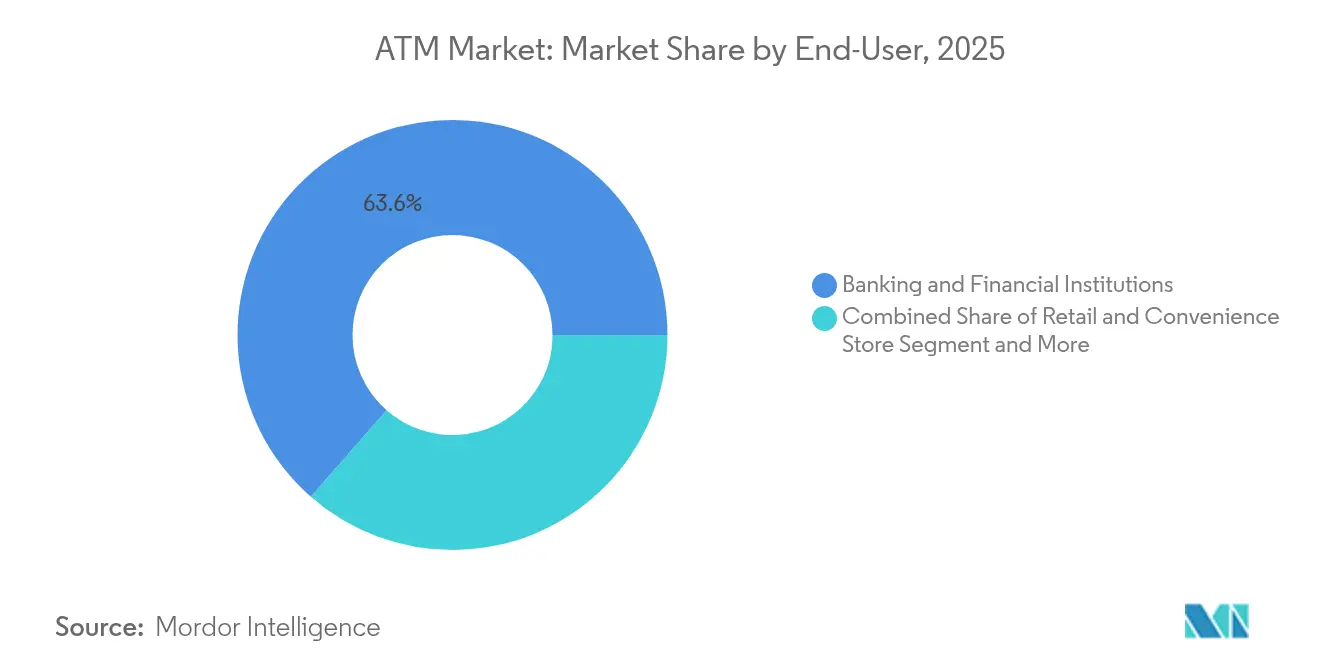
- By end user, banking and financial institutions held 63.55% of the ATM market size in 2025; retail and convenience locations record the highest projected CAGR at 6.09% to 2031.
- By service model, deployment solutions represented 52.95% of the market share in 2025, whereas managed ATM services rise at a 4.66% CAGR over the same horizon.
- By geography, Asia-Pacific captured 37.65% of the market in 2025; North America marks the quickest regional upswing with a 6.05% CAGR through 2031.
Note: Market size and forecast figures in this report are generated using Mordor Intelligence’s proprietary estimation framework, updated with the latest available data and insights as of 2026.
Global ATM Market Trends and Insights
Drivers Impact Analysis*
| Driver | (~) % Impact on CAGR Forecast | Geographic Relevance | Impact Timeline |
|---|---|---|---|
| The advent of smart ATMs | +1.2% | Global, early uptake in North America and Europe | Medium term (2-4 years) |
| Growing urbanization in cash-reliant economies | +0.8% | Asia-Pacific core, spill-over to MEA and Latin America | Long term (≥4 years) |
| Rising adoption of contactless and cardless transactions | +0.9% | Global, led by North America and Europe | Short term (≤2 years) |
| Expansion of cash-recycling and deposit functionality | +0.7% | Global, strong uptake in Europe and Asia-Pacific | Medium term (2-4 years) |
| Shift toward “ATM-as-a-Service” models | +0.6% | Global, especially in mature markets | Medium term (2-4 years) |
| Emergence of cryptocurrency ATMs | +0.4% | North America leads, moving into Europe and Asia-Pacific | Long term (≥4 years) |
| Source: Mordor Intelligence | |||
Advent of Smart ATMs
Smart terminals now bundle biometric login, video banking, and AI-driven cash forecasting into a single enclosure, turning what was once a cash box into a micro-branch. Hyosung Americas’ roll-out of NFC-enabled retail units shows how contactless layers improve both security and throughput[1]Hyosung Americas, “Hyosung Introduces NFC to Retail ATMs,” hyosungamericas.com. Fujitsu’s AI framework cuts software-update effort by 50%, demonstrating tangible opex savings that justify hardware refresh cycles. The result is a clear pivot by global banks toward intelligent devices that sustain branch rationalization while protecting customer journey quality.
Growing Urbanization in Cash-Reliant Economies
Mega-city growth across India, Indonesia, Nigeria, and Mexico concentrates millions of cash-centric consumers in dense hubs that still lack broad point-of-sale coverage. Independent deployers plug these ATM gaps, as seen in South Africa where non-bank operators keep cash flowing in townships with limited branch footprints. Municipal transit corridors and industrial zones similarly rely on off-site ATMs for salary withdrawals and bill payments, cementing steady volume growth that feeds the ATM market well past 2030.
Rising Adoption of Contactless and Cardless Transactions
Touch-free interactions surged during the pandemic and remain sticky. Commonwealth Bank’s QR-code withdrawal feature lets customers pre-stage cash on mobile, eliminating mag-stripe vulnerability and speeding lane time. The US Payments Forum cites growing consumer comfort with tap-to-pay, spurring ATM owners to retrofit NFC readers to protect interchange revenue. This modality shift accelerates software license demand and incentivizes acquirers to modernize estates, sustaining the ATM market.
Expansion of Cash-Recycling and Deposit Functionality
Cash recyclers redistribute deposited notes for outbound withdrawals, trimming CIT truck rolls and vault cash balances. Diebold Nixdorf’s DN Series helped Piraeus Bank re-engineer 1,200 terminals, lowering handling costs and shrinkage risk. GRG Banking logged 90% fewer cash-in-transit visits across a Mexican retail fleet, proving the commercial payoff in high-volume settings. Broader adoption of this technology underpins network resilience and enhances bank ESG scores through reduced carbon output.
Restraint Impact Analysis*
| Restraint | (~) % Impact on CAGR Forecast | Geographic Relevance | Impact Timeline |
|---|---|---|---|
| Escalating security and cyber-crime threats | -0.8% | Global, heightened in developed markets | Short term (≤2 years) |
| Branch rationalization driving ATM shutdowns | -0.6% | North America and Europe | Medium term (2-4 years) |
| Regulatory caps on interchange fees | -0.4% | North America with spill-over elsewhere | Medium term (2-4 years) |
| Sustainability push to curb cash use | -0.3% | Europe lead, expanding worldwide | Long term (≥4 years) |
| Source: Mordor Intelligence | |||
Escalating Security and Cyber-Crime Threats
Physical attacks grew 600% in 2024, with hydraulic “hook-and-chain” incidents costing USD 120,000 per hit on average. Cyber vectors are equally troubling: 85% of global estates still run unsupported OS images, leaving doorways for jackpotting malware. The US Federal Trade Commission tracked USD 120 million in crypto-ATM fraud losses, spotlighting vulnerabilities in unregulated segments. Counter-measures such as biometric second-factor, end-to-end encryption, and AI anomaly detection raise capex and opex, muting near-term profitability.
Branch Rationalization Driving ATM Shutdowns in Mature Markets
Large US and European banks shutter suburban outlets to cut real-estate overhead, often removing in-branch ATMs at the same time. PNC trimmed more than 10% of locations in 2024, thinning its ATM grid where digital usage peaked . While JPMorgan added 38 net new branches to counter “banking deserts,” many communities face reduced access, forcing deployers to reassess volumes against stand-alone economics. The net outcome constrains growth for on-site ATMs, nudging operators toward mobile or retail placements.
*Our forecasts treat driver/restraint impacts as directional, not additive. The impact forecasts reflect baseline growth, mix effects, and variable interactions.
Segment Analysis
By Deployment: Mobile ATMs Drive Strategic Flexibility
Off-site terminals dominated value share in 2025, underscoring the market shift toward non-branch touchpoints. These units serve malls, transit hubs, and big-box stores where foot traffic sustains high transaction velocity. Work-site machines flourish in factories and campuses that prize on-premise salary access.
The mobile subset, though smaller in volume, is scaling at an 8.61% CAGR as banks dispatch truck-based kiosks to disaster zones, concerts, and rural fairs. Their short installation lead-time and low sunk cost make them ideal for testing demand before committing to brick-and-mortar spend. Industry players report that mobile fleets record utilisation spikes of up to 40% during festival seasons, validating a flexible deployment thesis that buoys the ATM market.


By Type: Smart ATMs Redefine Service Capabilities
The cash-dispenser category retained 40.72% share in 2025, anchoring everyday withdrawals across global high-street corridors. Yet its growth curve is flattening as banks pivot budgets toward multifunction machines that pack cheque imaging, bill pay, and foreign exchange.
Smart/intelligent devices log an 8.80% CAGR, the fastest-rising slice of the ATM market. Biometric palm-vein login, high-definition video-assisted sessions, and multicurrency cash modules create a mini-branch experience that keeps complex transactions inside the bank’s walled garden. Brown and white-label operators leverage OEM APIs to overlay branding, while blockchain-ready kiosks prepare for digital-currency convergence. This functional expansion positions smart ATMs as the hardware baseline for the coming decade.
By End User: Retail Transformation Accelerates Growth
Banks and credit unions still own 63.55% of estate value, yet fee compression and compliance overhead encourage outsourcing to specialised vendors. Independent deployers now service large grocery and convenience chains, embedding surcharge-free Allpoint or MoneyPass access inside high-traffic aisles.
Retail and C-store hosts show a 6.09% CAGR, buoyed by 7-Eleven’s plan to top 11,600 installed units by 2025. Transportation hubs such as airports adopt multi-currency ATM–FX hybrids that monetise tourist flows, while casino and stadium operators double as cash-access providers and loyalty-programme activators. The broadening merchant footprint keeps the automated teller machine market tethered to omnichannel commerce even as e-wallets rise.
By Service Model: Managed Services Gain Strategic Importance
Traditional deployment solutions claim 52.95% revenue share, tied to hardware sales, installation, and break-fix. However, cost-of-cash pressures push banks to outsourcing deals that deliver fleet uptime guarantees and predictive replenishment.
Managed services notch a 4.66% CAGR, outpacing the hardware segment. Brink’s Total Cash Management assumes ownership of vault cash and replenishment risk, while Cennox packages remote monitoring, crisis repair, and regulatory audits under fixed monthly pricing. These asset-light contracts free bank capital, underpin recurring revenue for vendors, and expand the automated teller machine market by lowering barriers for small financial institutions
Geography Analysis
Asia-Pacific leads with 37.65% share in 2025, driven by India’s semi-urban expansion, Indonesia’s archipelago logistics needs, and China’s continued demand for hybrid cash-digital acceptance points. Policy moves to lift interchange fees to INR 23 (USD 0.28) improve operator ROI, encouraging fresh deployments that enlarge the ATM market size in the region. Cross-border players like Euronet deepen footprints via asset acquisitions in Malaysia, signalling confidence in long-run consumer cash usage.
North America is the fastest climber at 6.05% CAGR through 2031, fuelled by more than 31,000 cryptocurrency-enabled kiosks that let users exchange fiat for Bitcoin and vice versa. Retail alliances, illustrated by 4,000 new NCR Atleos Allpoint devices inside 7-Eleven stores, keep surcharge-free cash top of wallet for underbanked demographics. This innovation cadence sustains premium hardware spend and lifts regional growth above the global mean.
Europe shows maturity yet pioneers energy-efficient fleet management. Komerční banka’s shared-ATM initiative covering 2,000 Czech terminals slashes duplicate capacity and power draw, aligning with EU Green Deal goals. Swedbank’s sale of 1,141 Baltic units to Euronet underscores a pivot toward ATM-as-a-Service economics for legacy institutions. Meanwhile, the digital-euro roadmap could trim cash circulation post-2028, but current guidance leaves a multi-year runway for optimisation projects that reinforce the ATM market.

Competitive Landscape
Three OEM–service integrators—NCR Atleos, Diebold Nixdorf, and Hyosung TNS—control most high-end shipments, but regional challengers such as GRG Banking and Hitachi Channel Solutions keep pricing pressure intact. NCR Atleos runs a 600,000-plus global footprint and leans on Linux-based cloud architecture to deliver estate analytics, while Diebold’s portfolio emphasizes cash recyclers and AI-driven fraud detection.
Euronet’s Baltic buyout signals a wider roll-up of bank-owned fleets into independent operator hands. Brink’s and Cardtronics extend managed-service propositions that span vault cash provision, dynamic forecasting, and unified SLA dashboards. The ATM market increasingly pivots on software: KAL, Auriga, and Software Mind license vendor-agnostic stacks that free banks from single-vendor lock-in, prompting hardware commoditization.
Patent filings show surging interest in biometric liveness checks, secure element tokenization, and AI-powered video analytics. Vendors race to integrate ISO-20022 messaging and digital-currency modules so estates can process central-bank digital cash the day it goes live. Corporate ESG agendas also influence design; aluminum chassis built for 99% recyclability and low-idle power modes emerge as differentiators. M&A activity should accelerate as mid-tier OEMs seek scale to fund R&D and global service desks that future-proof customer portfolios.
ATM Industry Leaders
Diebold Nixdorf Incorporated
NCR Corporation
Fujitsu
Hitachi Channel Solutions Corp.
Triton Systems LLC
- *Disclaimer: Major Players sorted in no particular order

Recent Industry Developments
- June 2025: Fujitsu unveiled its Technology and Service Vision 2025, spotlighting People-AI collaboration to boost system modernization by 50% .
- May 2025: 7-Eleven began rolling out over 4,000 NCR Atleos Allpoint ATMs across US stores, expanding surcharge-free access.
- May 2025: Capital One completed its USD 35.3 billion takeover of Discover Financial Services, forming the sixth-largest US bank.
- April 2025: Casey’s General Stores signed a multi-year turnkey ATM deal with Cardtronics covering 2,000 outlets.


Global ATM Market Report Scope
ATM, short for "Automated Teller Machine," is a computerized device that allows individuals to perform a range of banking transactions without the assistance of a human teller. ATMs offer a convenient means to access and manage bank accounts, even beyond regular banking hours.
The study tracks the revenue accrued through the sale of ATMs by various players across the globe. The study also tracks the key market parameters, underlying growth influencers, and major vendors operating in the industry, which supports the market estimations and growth rates over the forecast period. The study further analyses the overall impact of COVID-19 aftereffects and other macroeconomic factors on the market. The report’s scope encompasses market sizing and forecasts for the various market segments.
The ATM market is segmented by deployment (onsite ATMs, offsite ATMs, worksite ATMs, and mobile ATMs), type (brown ATMs, white ATMs, cash dispenser ATMs, smart ATMs, and conventional/banks ATMs), and geography (North America, Europe, Asia Pacific, Middle East & Africa, and Latin America). The market sizes and forecasts regarding value (USD) for all the above segments are provided.
| On-site ATMs |
| Off-site ATMs |
| Work-site ATMs |
| Mobile ATMs |
| Conventional / Bank ATMs |
| Brown Label ATMs |
| White Label ATMs |
| Smart / Intelligent ATMs |
| Cash-Dispenser ATMs |
| Banking and Financial Institutions |
| Retail and Convenience Stores |
| Transportation Hubs |
| Hospitality and Leisure |
| Other Commercial Sites |
| Deployment Solutions |
| Managed ATM Services |
| North America | United States | |
| Canada | ||
| Mexico | ||
| South America | Brazil | |
| Argentina | ||
| Rest of South America | ||
| Europe | United Kingdom | |
| Germany | ||
| France | ||
| Italy | ||
| Spain | ||
| Nordics | ||
| Rest of Europe | ||
| Middle East and Africa | Middle East | Saudi Arabia |
| United Arab Emirates | ||
| Turkey | ||
| Rest of Middle East | ||
| Africa | South Africa | |
| Egypt | ||
| Nigeria | ||
| Rest of Africa | ||
| Asia-Pacific | China | |
| India | ||
| Japan | ||
| South Korea | ||
| ASEAN | ||
| Australia | ||
| New Zealand | ||
| Rest of Asia-Pacific | ||
| By Deployment | On-site ATMs | ||
| Off-site ATMs | |||
| Work-site ATMs | |||
| Mobile ATMs | |||
| By Type | Conventional / Bank ATMs | ||
| Brown Label ATMs | |||
| White Label ATMs | |||
| Smart / Intelligent ATMs | |||
| Cash-Dispenser ATMs | |||
| By End-user | Banking and Financial Institutions | ||
| Retail and Convenience Stores | |||
| Transportation Hubs | |||
| Hospitality and Leisure | |||
| Other Commercial Sites | |||
| By Service Model | Deployment Solutions | ||
| Managed ATM Services | |||
| By Geography | North America | United States | |
| Canada | |||
| Mexico | |||
| South America | Brazil | ||
| Argentina | |||
| Rest of South America | |||
| Europe | United Kingdom | ||
| Germany | |||
| France | |||
| Italy | |||
| Spain | |||
| Nordics | |||
| Rest of Europe | |||
| Middle East and Africa | Middle East | Saudi Arabia | |
| United Arab Emirates | |||
| Turkey | |||
| Rest of Middle East | |||
| Africa | South Africa | ||
| Egypt | |||
| Nigeria | |||
| Rest of Africa | |||
| Asia-Pacific | China | ||
| India | |||
| Japan | |||
| South Korea | |||
| ASEAN | |||
| Australia | |||
| New Zealand | |||
| Rest of Asia-Pacific | |||


Key Questions Answered in the Report
What is the current size of the automated teller machine market?
The automated teller machine market is valued at USD 25.67 billion in 2026, with a forecast CAGR of 3.06% toward 2031.
Which region leads the automated teller machine market?
Asia-Pacific holds the largest regional share at 37.65% in 2025, supported by financial-inclusion programs and rapid urbanisation.
Why are smart ATMs gaining ground so quickly?
Banks prefer smart devices because they incorporate video banking, biometrics, and cash recycling, driving an 8.80% CAGR for the segment.
How fast are cryptocurrency ATMs expanding?
North America spearheads growth, helping cryptocurrency-enabled units push the regional market to a 6.05% CAGR through 2031.
Page last updated on:


