Industrial Automation Market Size and Share
Market Overview
| Study Period | 2020 - 2031 |
|---|---|
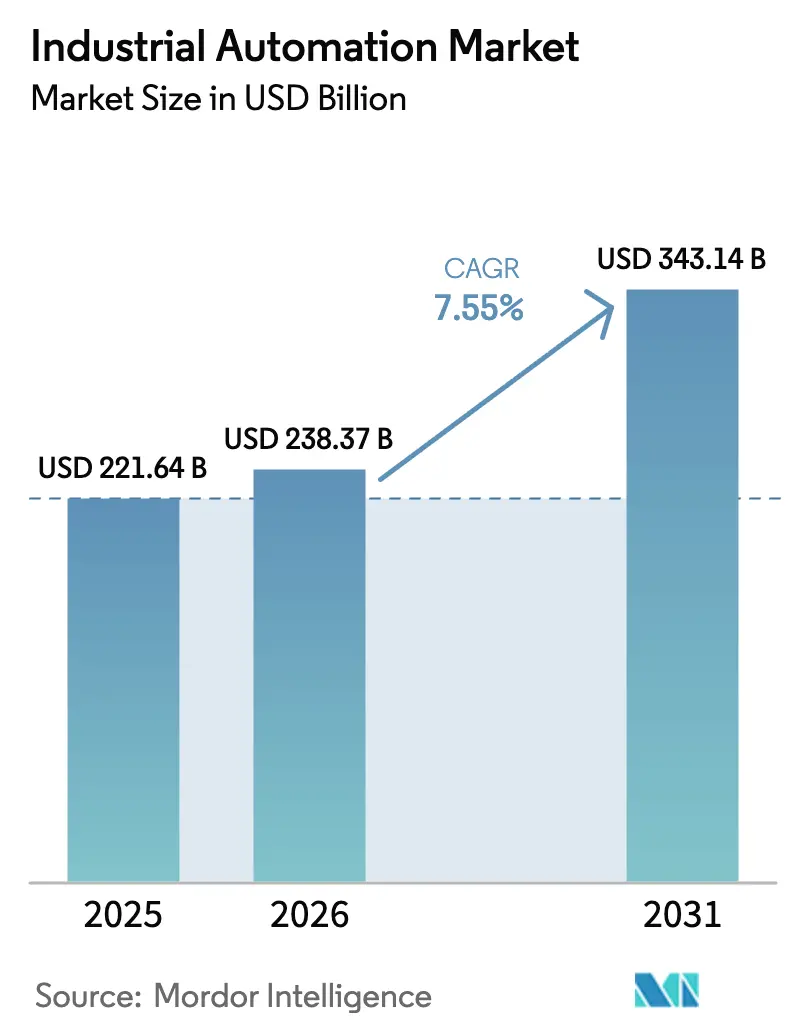
| Market Size (2026) | USD 238.37 Billion |
| Market Size (2031) | USD 343.14 Billion |
| Growth Rate (2026 - 2031) | 7.55% CAGR |
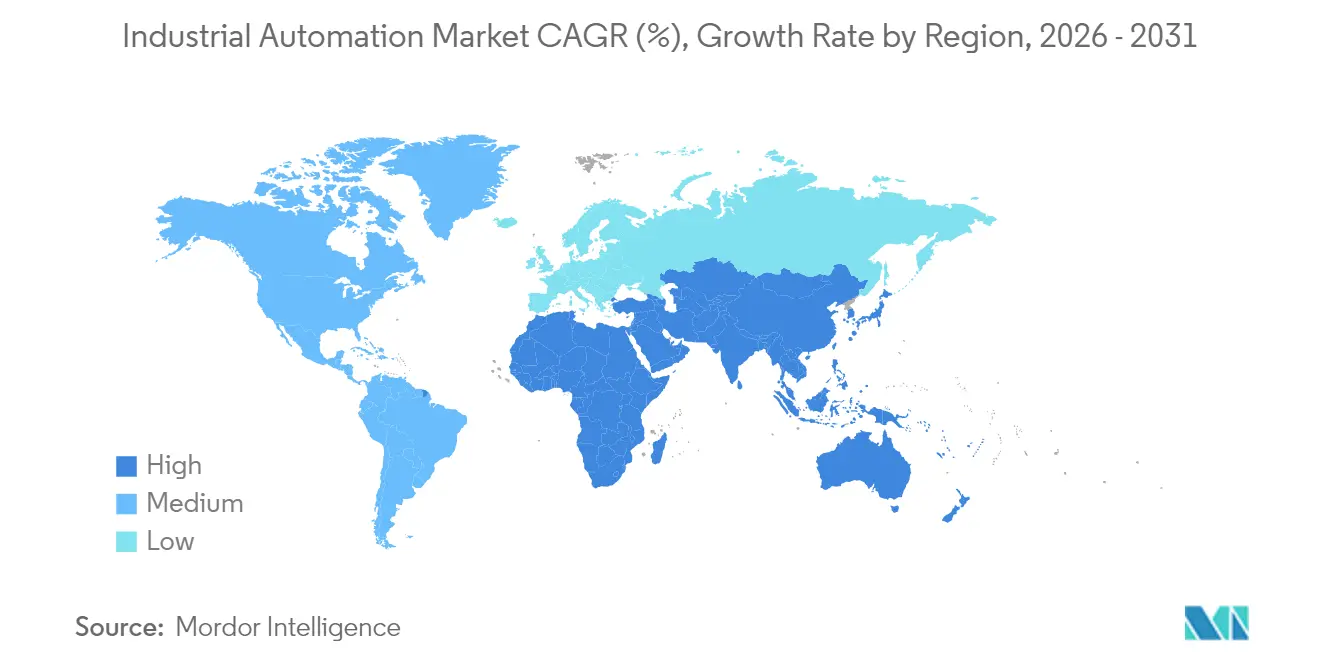
| Fastest Growing Market | Asia Pacific |
| Largest Market | Asia Pacific |
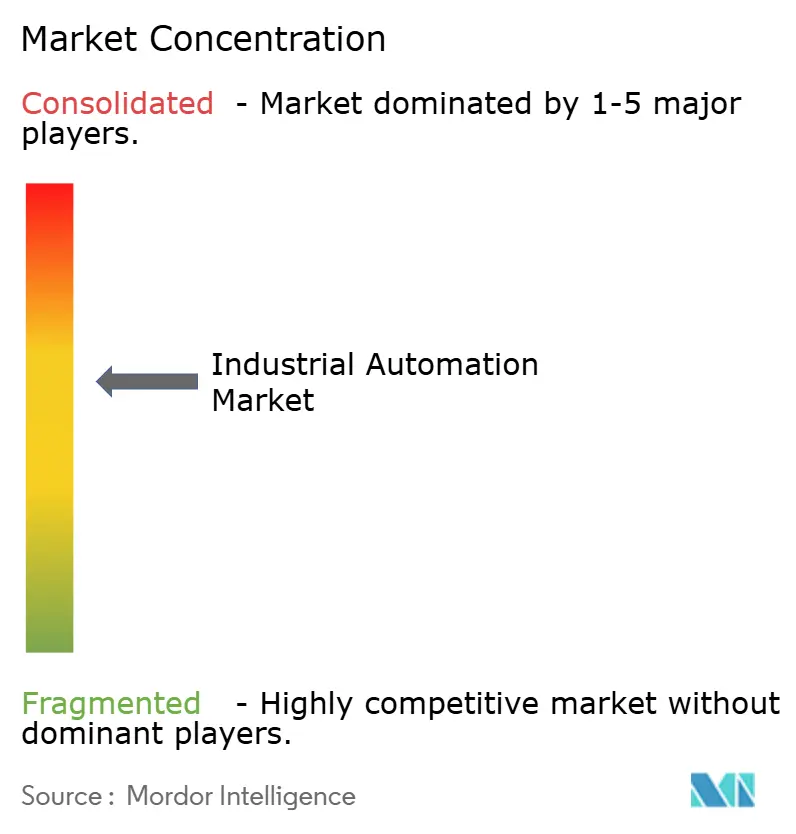
| Market Concentration | Medium |
Major Players *Disclaimer: Major Players sorted in no particular order Image © Mordor Intelligence. Reuse requires attribution under CC BY 4.0. | |
Industrial Automation Market Analysis by Mordor Intelligence
Industrial automation market size in 2026 is estimated at USD 238.37 billion, growing from 2025 value of USD 221.64 billion with 2031 projections showing USD 343.14 billion, growing at 7.55% CAGR over 2026-2031. Smart-factory programs, government reshoring incentives, and energy-efficiency mandates have been the main accelerants. Manufacturers intensified spending on cyber-physical systems to counter a widening labor shortage and to strengthen supply-chain resilience. The convergence of AI, robotics, and IoT reshaped shop-floor operations, lowered change-over times, and enabled predictive quality control. Ongoing lithium-ion battery shortages slowed some intralogistics projects, yet rising demand for “teach-less” robots offset this drag. Meanwhile, nearly 200 automation-focused mergers in 2023 highlighted growing competition for strategic technologies.
Key Report Takeaways
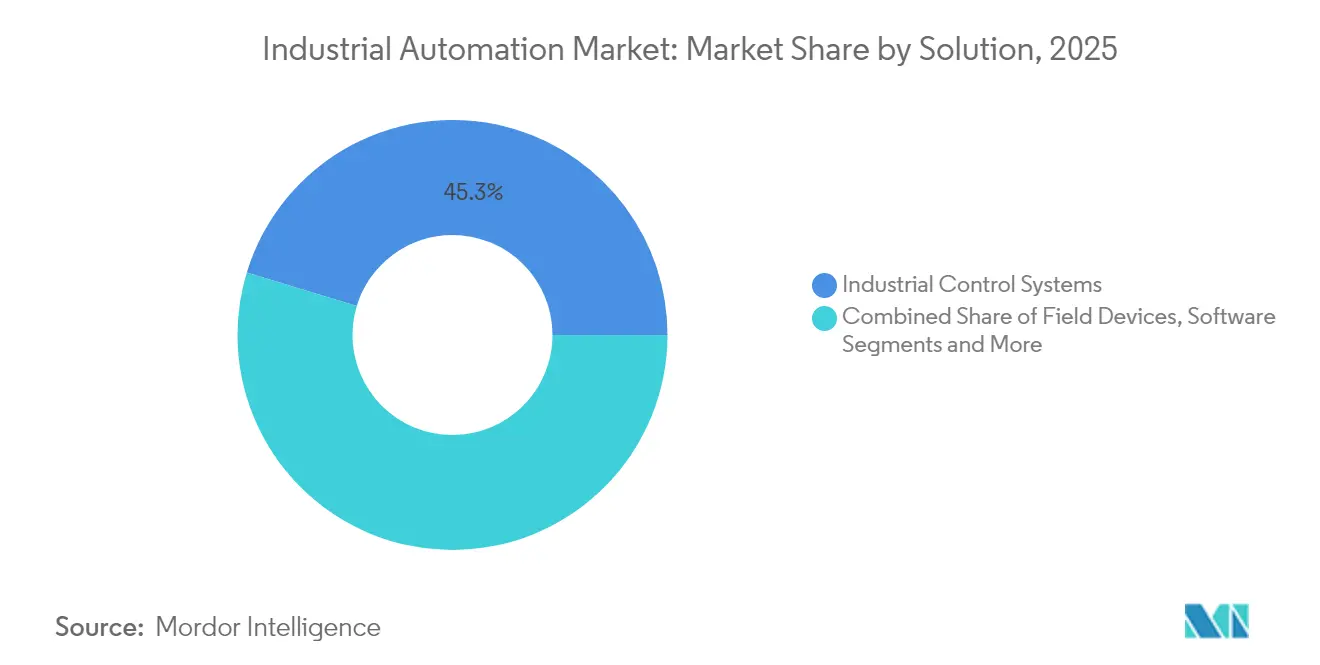
- By solution, industrial control systems led with 45.30% revenue share in 2025, while robotics within field devices is projected to expand at a 11.8% CAGR through 2031.
- By automation type, fixed automation held 42.30% share of the industrial automation market size in 2025, whereas flexible and modular automation is poised for a 13.7% CAGR to 2031.
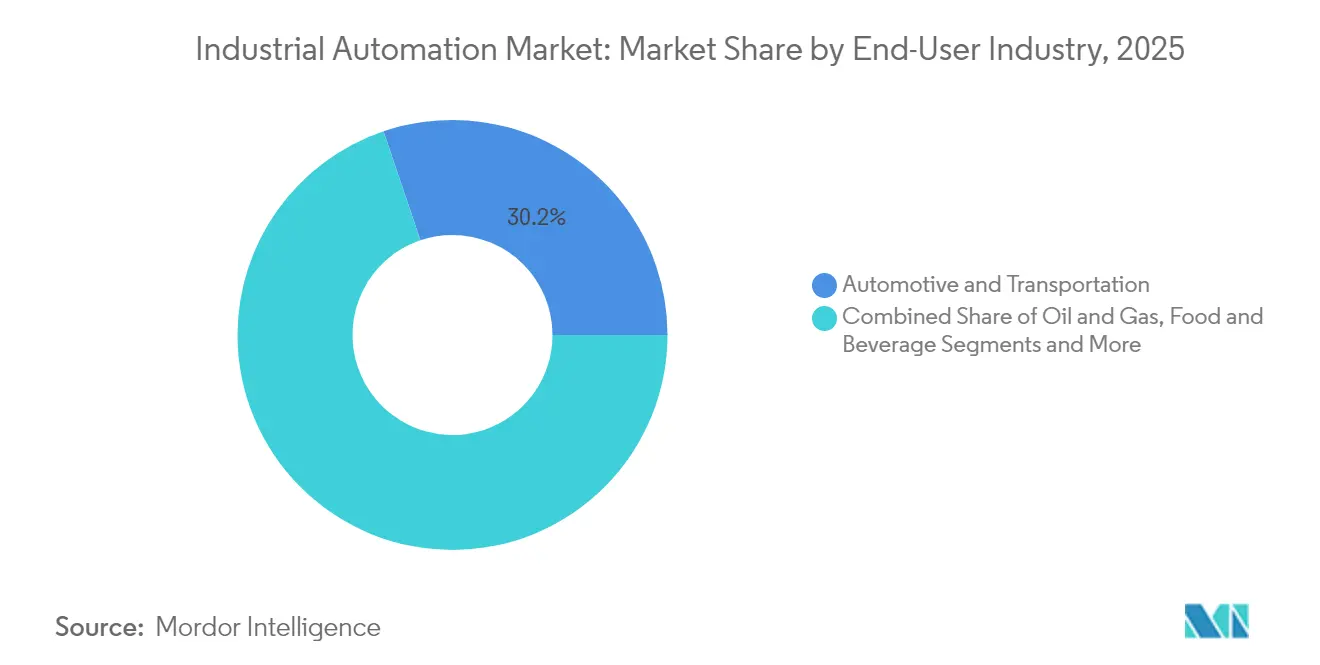
- By end-user industry, automotive and transportation held 30.20% share of the industrial automation market size in 2025, whereas pharmaceuticals is poised for an 8.8% CAGR between 2026-2031.
- By Deployment Mode, on-premises systems held a 64.60% share of the industrial automation market in 2025, whereas cloud deployments are growing at a 15.0% CAGR through 2031.
- By geography, Asia-Pacific commanded 43.10% share of the industrial automation market in 2025 and remains the fastest-growing region at 12.3% CAGR to 2031.
Note: Market size and forecast figures in this report are generated using Mordor Intelligence’s proprietary estimation framework, updated with the latest available data and insights as of 2026.
Global Industrial Automation Market Trends and Insights
Drivers Impact Analysis*
| Driver | (~) % Impact on CAGR Forecast | Geographic Relevance | Impact Timeline |
|---|---|---|---|
| Surge in Industry 4.0 led Smart-Factory Investments | +2.1% | Global, with APAC and North America leading | Medium term (2-4 years) |
| Rising Demand for Energy-Efficient Production Lines | +1.8% | Europe and North America core, expanding to APAC | Long term (≥ 4 years) |
| Government Incentives for Re-Shoring Advanced Manufacturing | +1.4% | North America primary, Europe secondary | Short term (≤ 2 years) |
| AI-Native "Teach-less" Robotics Slashing Change-Over Time | +1.2% | Global, with early adoption in automotive and electronics | Medium term (2-4 years) |
| Carbon-Accounting Mandates Driving Retrofit Automation | +0.9% | Europe leading, North America following | Long term (≥ 4 years) |
| Source: Mordor Intelligence | |||
Surge in Industry 4.0 Smart-Factory Investments
Manufacturers elevated digital-transformation budgets, focusing on pragmatic use cases such as predictive maintenance and automated quality checks. Siemens automated 75% of its Amberg electronics supply chain, while Bosch’s digital-twin roll-out delivered 25% efficiency gains. These proof points shifted investment toward cloud platforms and narrowly scoped AI tools that deliver measurable returns.
Rising Demand for Energy-Efficient Production Lines
Utility price volatility and stricter carbon rules prompted plants to retrofit legacy lines with intelligent controls. ABB audits of 2,000 electric motors found average energy-saving potential of 31%, equal to 2.1 TWh over equipment life [1]ABB, “ABB Expands Electrification Portfolio,” electricalindustry.ca. MES platforms now merge real-time energy data with production schedules to trim peak demand without sacrificing output.
Government Incentives for Reshoring Advanced Manufacturing
The United States tied semiconductor and clean-energy grants to advanced automation, spurring local investment in automated fabs. Germany and Japan unveiled similar funding streams in 2024, further linking capital subsidies to digital-production milestones. [2]Government of Japan, “Integrated Innovation Strategy 2024,” cao.go.jp
AI-Native “Teach-less” Robotics Slashing Change-Over Time
Autonomous-motion software cut robot programming time by up to 70%, enabling same-day changeovers in automotive plants. BMW and Volkswagen applied multi-robot optimization that balances throughput with collision avoidance. Voice-enabled cobots now let operators tweak tasks without code, moving factories toward adaptive, batch-one production.
Restraints Impact Analysis*
| Restraint | (~) % Impact on CAGR Forecast | Geographic Relevance | Impact Timeline |
|---|---|---|---|
| High CAPEX and Integration Costs for Brown-Field Plants | -1.7% | Global, particularly affecting SMEs | Short term (≤ 2 years) |
| Cyber-Security Vulnerabilities in Converged IT/OT Networks | -1.3% | Global, with higher impact in critical infrastructure | Medium term (2-4 years) |
| Shortage of Skilled Automation Engineers | -0.8% | North America and Europe primary | Long term (≥ 4 years) |
| Lithium-Ion Supply Constraints Delaying AGV Roll-outs | -0.6% | Global, with APAC manufacturing most affected | Short term (≤ 2 years) |
| Source: Mordor Intelligence | |||
High CAPEX and Integration Costs for Brown-Field Plants
Retrofitting decades-old facilities cost 40-60% more than green-field builds, largely due to legacy protocol mapping and unavoidable downtime. SMEs deferred projects when budgets tightened, even though delay risks competitive erosion.
Cyber-Security Vulnerabilities in Converged IT/OT Networks
OT systems, originally designed for availability rather than security, became prime ransomware targets. In 2024, 80% of recorded attacks on factories involved ransomware that halted production. Air-gapped or segmented architectures safeguarded critical assets, but they slowed data-driven optimization.
*Our forecasts treat driver/restraint impacts as directional, not additive. The impact forecasts reflect baseline growth, mix effects, and variable interactions.
Segment Analysis
By Solution: Control Systems Anchor Adoption While Robotics Accelerates
Industrial control systems held a 45.30% share of the industrial automation market in 2025, underlining their status as the command layer for all sectors. Demand for SCADA and distributed control systems persisted in the process industries, while programmable logic controllers evolved with edge processing to handle real-time tasks.
Robotics within field devices is tracking an 11.8% CAGR through 2031, fuelled by AI-enabled vision and safer collaborative designs that extend automation to mixed-model lines. Software, chiefly MES and product lifecycle platforms, grew fastest as plants sought end-to-end data visibility. Services, particularly integration, bridged new platforms with legacy assets, a crucial step in brown-field upgrades.


By Automation Type: Flexible Systems Challenge Fixed Lines
Fixed automation held 42.30% share of the industrial automation market size in 2025, still favored for high-volume, low-mix goods. Flexible and modular automation, however, is advancing at 13.7% CAGR. Automakers adopted modular conveyor cells and cobots to handle multiple vehicle variants without long re-tooling lulls.
Programmable automation retained relevance for mid-volume production that balances cost with adaptability. Hyper-automation, blending AI orchestration with robotic swarms, began appearing in electronics assembly for rapid product turnovers.
By End-User Industry: Automotive Leads, Pharma Picks Up Pace
Automotive and transportation accounted for 30.20% share in 2025, buoyed by electric-vehicle line expansions and stringent quality needs. Pharmaceuticals is the fastest mover at 8.8% CAGR, driven by traceability regulations and the push for flexible, small-batch biologics.
Food and beverage producers upgraded for safety, yield, and waste reduction, while oil and gas firms employed predictive analytics to maximize asset uptime. Electronics manufacturers leaned on AI-native robots to support reshoring and supply-chain diversification.
By Deployment Mode: Cloud Soars as On-Premise Prevails
On-premise systems kept 64.60% share in 2025 because many plants insisted on direct control of mission-critical data. Cloud deployment is growing 15.0% CAGR, propelled by scalable analytics and lower upfront costs. Hybrid edge architectures merged local decision-making with cloud-based twins and ML training, offering performance without compromising latency or security.
5G roll-outs and multi-cloud strategies further smoothed adoption, letting manufacturers balance workload placement against compliance and cost objectives.
Geography Analysis
Asia-Pacific captured 43.10% of industrial automation market share in 2025 and is growing 12.3% CAGR through 2031. China, Japan, and India anchored regional progress after governments tied tax credits and subsidies to smart-factory metrics. Japan’s automation spending is projected to triple from USD 15.1 billion in 2024 to USD 35.2 billion by 2033, illustrating sustained momentum.
North America accelerated investment after policy incentives such as the CHIPS Act required automated production to secure funding. Schneider Electric announced USD 700 million in new U.S. facilities by 2027, mirroring the region’s tilt toward high-value manufacturing. Energy-efficiency mandates further pushed retrofit activity in legacy plants.
Europe emphasized carbon-reduction targets, integrating automation with sustainability tracking. Manufacturers deployed smart motors, energy-aware scheduling, and digital twins to meet rigorous Green Deal commitments. While the region expanded at a modest pace, it set the benchmark for environmental compliance that other regions are beginning to follow.

Competitive Landscape
The industrial automation market remained moderately concentrated. Powerhouses such as ABB, Siemens, Rockwell Automation, and Schneider Electric supplied integrated hardware-software-service portfolios, while niche entrants attacked narrow pain points with AI, edge, or cyber-security offerings. ABB deepened its motor efficiency roster by purchasing Siemens’ low-voltage NEMA motor line in January 2025.
Strategic alliances flourished. Schneider Electric teamed with Microsoft on generative-AI copilots, and Honeywell carved out a stand-alone automation unit slated for spin-off by 2026. [4]Honeywell, “Honeywell Announces Portfolio Update,” honeywell.com Emerging firms such as Realtime Robotics drew investment from Mitsubishi Electric to speed “teach-less” path-planning tools.
MandA valuations stayed elevated amid a seller’s market for scarce, field-proven technologies. Cyber-security specialist Nozomi Networks secured USD 100 million from industrial incumbents to bolster critical-infrastructure defense, underscoring the rising priority of OT security solutions.
Industrial Automation Industry Leaders
Schneider Electric SE
Rockwell Automation Inc.
Honeywell International Inc.
Emerson Electric Co.
ABB Limited
- *Disclaimer: Major Players sorted in no particular order

Recent Industry Developments
- March 2025: Schneider Electric committed over USD 700 million to U.S. expansion, adding more than 1,000 jobs by 2027.
- February 2025: Honeywell unveiled a plan to separate its Automation and Aerospace divisions into three public companies, positioning Honeywell Automation to focus on digital industrial solutions.
- January 2025: ABB finalized the purchase of Siemens’ low-voltage NEMA motor business, enhancing energy-efficient drive options.
- May 2024: Mitsubishi Electric invested in Realtime Robotics to integrate multirobot optimization into automotive plants.


Research Methodology Framework and Report Scope
Market Definitions and Key Coverage
According to Mordor Intelligence, the industrial automation market tracks the value generated from selling hardware, software, and services that monitor, control, and optimize production equipment and industrial processes, namely programmable logic controllers, distributed control systems, SCADA platforms, sensors, drives, industrial robots, advanced analytics suites, and maintenance services. The figure excludes purely mechanical tools, general-purpose IT infrastructure, and post-warranty spare-parts trade.
Scope Exclusion: standalone warehouse-only material-handling systems are not counted here.
Segmentation Overview
- By Solution
- Industrial Control Systems
- Distributed Control System (DCS)
- Supervisory Control and Data Acquisition (SCADA)
- Programmable Logic Controller (PLC)
- Human Machine Interface (HMI)
- Other Control Systems
- Field Devices
- Sensors & Transmitters
- Valves and Actuators
- Motors and Drives
- Robotics
- Other Field Devices
- Software
- Product Lifecycle Management (PLM)
- Enterprise Resource and Planning (ERP)
- Manufacturing Execution System (MES)
- Other Software
- Services
- Integration
- Maintenance and Training
- Industrial Control Systems
- By Automation Type
- Fixed Automation
- Programmable Automation
- Flexible/Modular Automation
- Integrated/Hyper-Automation
- By End-User Industry
- Automotive and Transportation
- Oil and Gas
- Food and Beverage
- Pharmaceuticals and Life Sciences
- Power and Utilities
- Electronics and Semiconductors
- Chemicals and Petrochemicals
- Metals and Mining
- Other End-user Industries
- By Deployment Mode
- On-Premise
- Cloud-Based
- Hybrid / Edge
- By Geography
- North America
- United States
- Canada
- Mexico
- South America
- Brazil
- Argentina
- Rest of South America
- Europe
- Germany
- United Kingdom
- France
- Italy
- Russia
- Rest of Europe
- Asia-Pacific
- China
- Japan
- South Korea
- India
- ASEAN-5
- Rest of Asia-Pacific
- Middle East and Africa
- Middle East
- Saudi Arabia
- United Arab Emirates
- Turkey
- Rest of Middle East
- Africa
- South Africa
- Rest of Africa
- Middle East
- North America
Detailed Research Methodology and Data Validation
Primary Research
We interview plant engineers, control-system integrators, and regional distributors across Asia-Pacific, North America, Europe, and the Gulf. These conversations clarify average selling prices, retrofit cycles, and emerging preferences such as cloud SCADA or cobots, which then fine-tune adoption curves and validate secondary findings.
Desk Research
Our analysts begin with government trade statistics (for instance, UN Comtrade shipment codes linked to sensors and drives), manufacturing production indices from bodies such as the Federal Reserve and Eurostat, and capital-goods investment series released by OECD and national statistics offices. We enrich these with association whitepapers, like the International Federation of Robotics robot-installation data and Automation Federation safety-system surveys, plus public company filings that disclose automation-related revenue splits. Paid repositories that Mordor subscribes to, including D&B Hoovers for company financials and Dow Jones Factiva for global news, help benchmark vendor revenues and spot capacity additions. The sources mentioned illustrate the mix; many further documents supplement the evidence base used for verification.
Market-Sizing & Forecasting
We construct a top-down model that rebuilds demand from global manufacturing value-added, fixed-asset formation, and automation intensity ratios by end-industry. Select bottom-up checks, sampled vendor revenue roll-ups and channel ASP × unit estimates, calibrate totals. Key variables feeding the model include: 1. Annual robot installs per 10,000 manufacturing workers, 2. Average PLC replacement interval, 3. Global sensor ASP trends, 4. Energy-sector green-field project count, 5. Cloud subscription penetration in MES. A multivariate regression links these indicators to historical market value and projects forward; scenario analysis brackets macro shocks. Where supplier granularity is thin, assumed service attach rates are benchmarked against primary interview medians.
Data Validation & Update Cycle
Separate analyst pairs cross-check outputs against peer ratios and historical spend patterns; variances beyond +/-5 % trigger re-work. Before release, a senior reviewer signs off, and the dataset is refreshed at least yearly, with interim updates if material supply-chain or policy shifts occur.
Why Our Industrial Automation Baseline Stands Up to Scrutiny
Published figures differ because firms pick varying product baskets, price assumptions, and refresh cadences.
Mordor's study centers on core control hardware, software, and associated services for factory and process environments, uses 2025 as its harmonized base year, and recalibrates each input annually.
Benchmark comparison
| Market Size | Anonymized source | Primary gap driver |
|---|---|---|
| USD 221.64 B (2025) | Mordor Intelligence | - |
| USD 255.88 B (2024) | Global Consultancy A | Includes communication networks and 3D-printing systems; older base year |
| USD 226.76 B (2025) | Trade Journal B | Focuses on control systems only, minimal service revenue, vendor-statement reliance |
In sum, the disciplined scope, dual-path modelling, and live validation steps give decision-makers a balanced, transparent baseline they can retrace and replicate with confidence.


Key Questions Answered in the Report
What is the current industrial automation market size and growth outlook?
The market reached USD 238.37 billion in 2026 and is forecast to climb to USD 343.14 billion by 2031, a 7.55% CAGR.
Which region leads the industrial automation market?
Asia-Pacific held 43.10% share in 2025 and is expanding at 12.3% CAGR, driven by strong manufacturing bases and supportive government policies.
Which solution type dominates spending?
Industrial control systems captured 45.30% of 2025 revenue, while robotics is the fastest-growing solution at 11.8% CAGR through 2031.
Why are manufacturers accelerating cloud adoption?
Cloud platforms offer scalable analytics and reduced infrastructure costs, pushing cloud-based deployments to a 15.0% CAGR despite on-premise dominance.
What are the main barriers to wider automation uptake?
High retrofit costs for brown-field plants and rising cyber-security risks in converged IT/OT networks are the two most significant restraints.
How is AI reshaping factory robotics?
AI-native “teach-less” robots cut programming times by up to 70%, enabling same-day changeovers and more flexible production workflows.
Page last updated on:


