Industrial Networking Solutions Market Size and Share
Market Overview
| Study Period | 2020 - 2031 |
|---|---|
| Market Size (2026) | USD 36.48 Billion |
| Market Size (2031) | USD 78.43 Billion |
| Growth Rate (2026 - 2031) | 16.54% CAGR |
| Fastest Growing Market | Middle East |
| Largest Market | Asia Pacific |
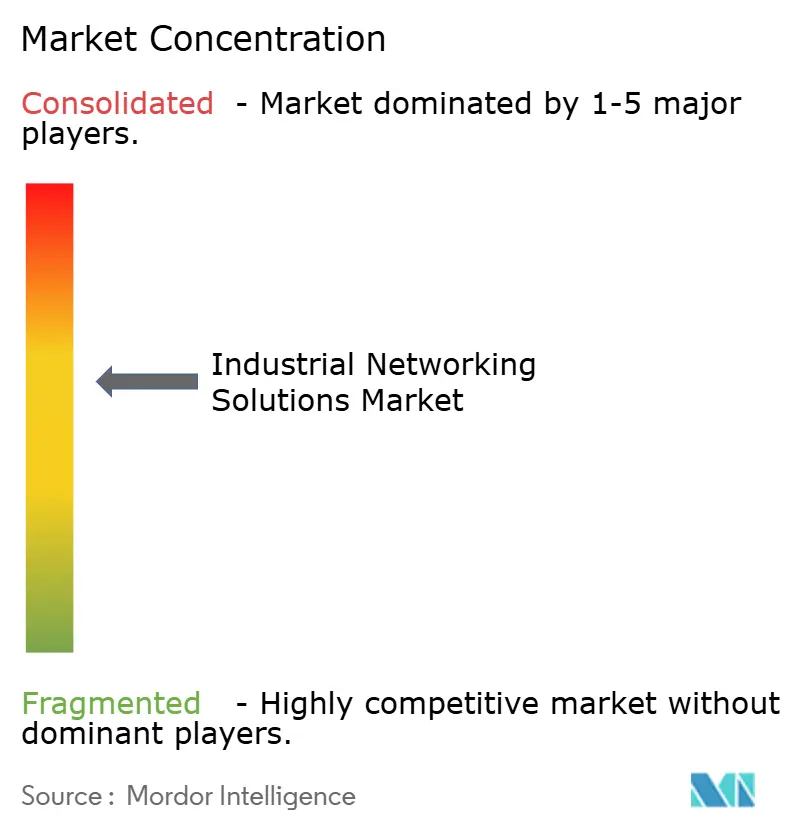
| Market Concentration | Medium |
Major Players *Disclaimer: Major Players sorted in no particular order Image © Mordor Intelligence. Reuse requires attribution under CC BY 4.0. | |
Industrial Networking Solutions Market Analysis by Mordor Intelligence
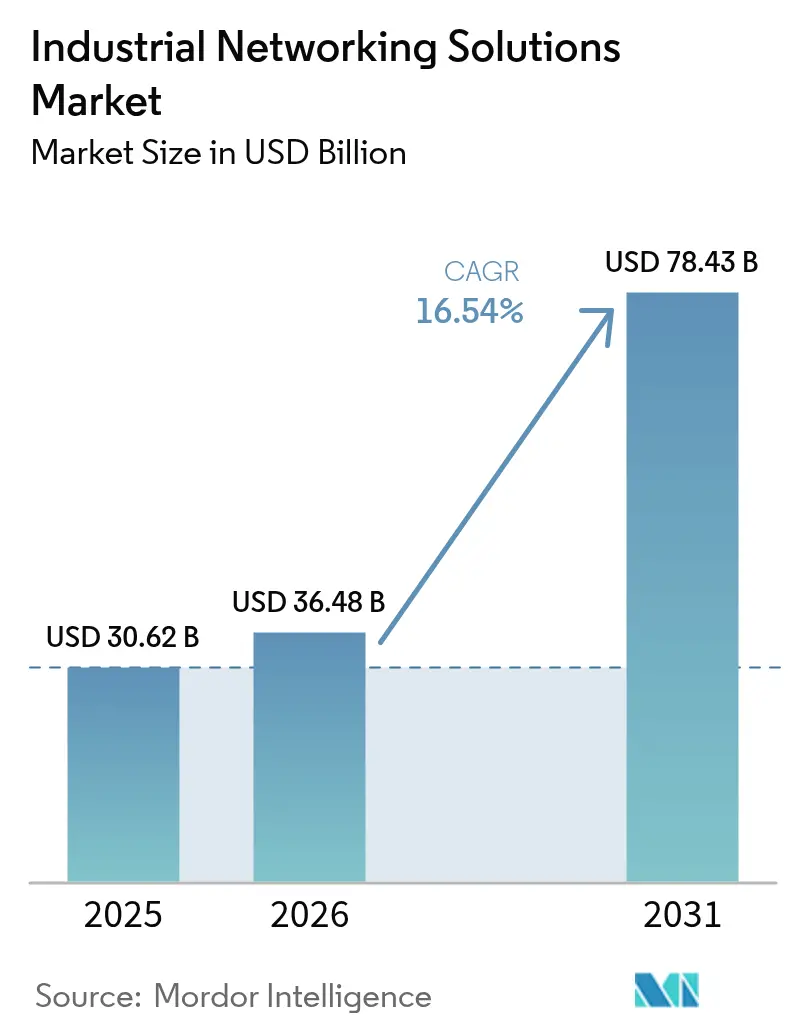
The industrial networking solutions market size is projected to expand from USD 30.62 billion in 2025 and USD 36.48 billion in 2026 to USD 78.43 billion by 2031, registering a CAGR of 16.54% between 2026 to 2031. Capital spending is shifting rapidly toward Ethernet-based, software-defined fabrics that collapse historically separate operational technology and information technology domains into a single converged backbone. Vendors are prioritizing recurring-revenue engines built on edge analytics, zero-touch provisioning, and security subscriptions, a pivot that reduces exposure to the historically cyclical nature of hardware refresh cycles. Wireless is narrowing the historic performance gap with copper and fiber, as private 5G and Wi-Fi 6E reach latency thresholds that satisfy closed-loop control, opening the industrial networking solutions market to mobile robotics and augmented-reality workflows. Regional dynamics are equally decisive: Asia Pacific maintains leadership on the back of state subsidies, while the Middle East emerges as the fastest-growing theater because diversification agendas attach explicit Industry 4.0 requirements to greenfield investments.
Key Report Takeaways
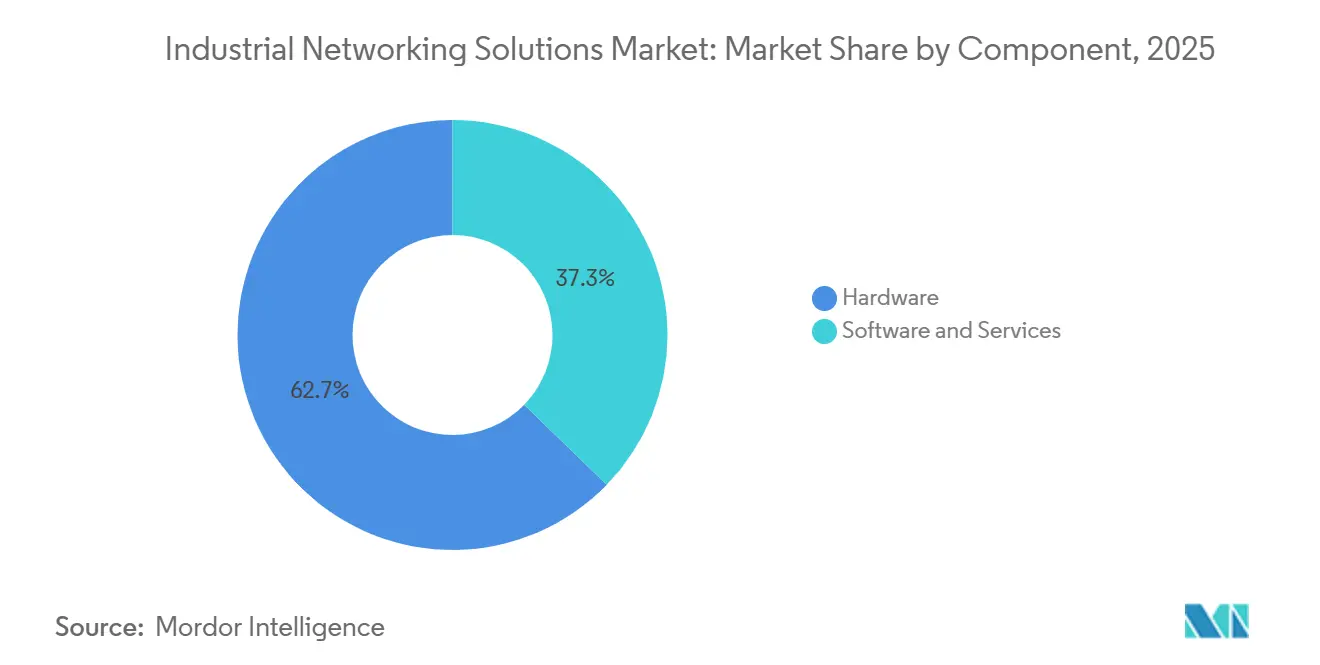
- By component, hardware led with 62.73% of industrial networking solutions market share in 2025, while software and services are expanding at a 16.58% CAGR through 2031.
- By connectivity type, wired infrastructure commanded 56.81% share of the industrial networking solutions market size in 2025, whereas wireless is advancing at a 16.61% CAGR to 2031.
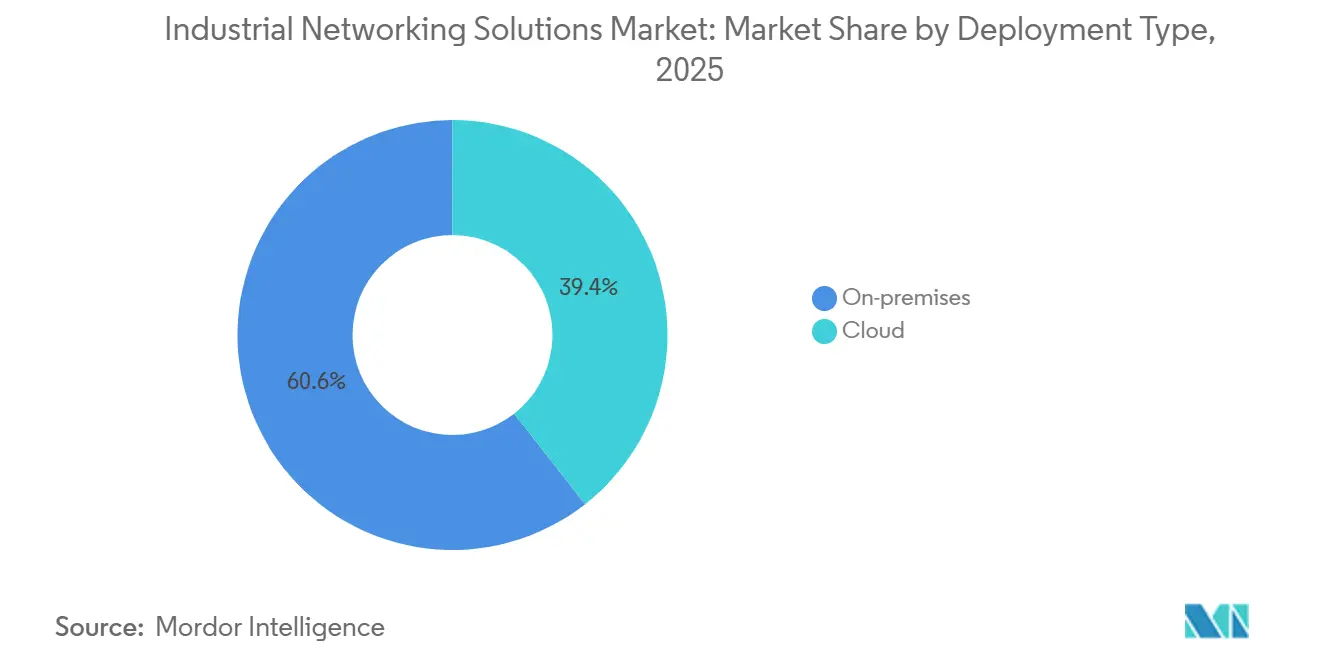
- By deployment model, on-premises architectures captured 60.58% of 2025 spending, yet cloud-orchestrated hybrids are growing at a 16.65% CAGR over the same horizon.
- By end-user industry, manufacturing accounted for 37.53% revenue in 2025, and logistics and transportation is forecast to expand at a 16.71% CAGR to 2031.
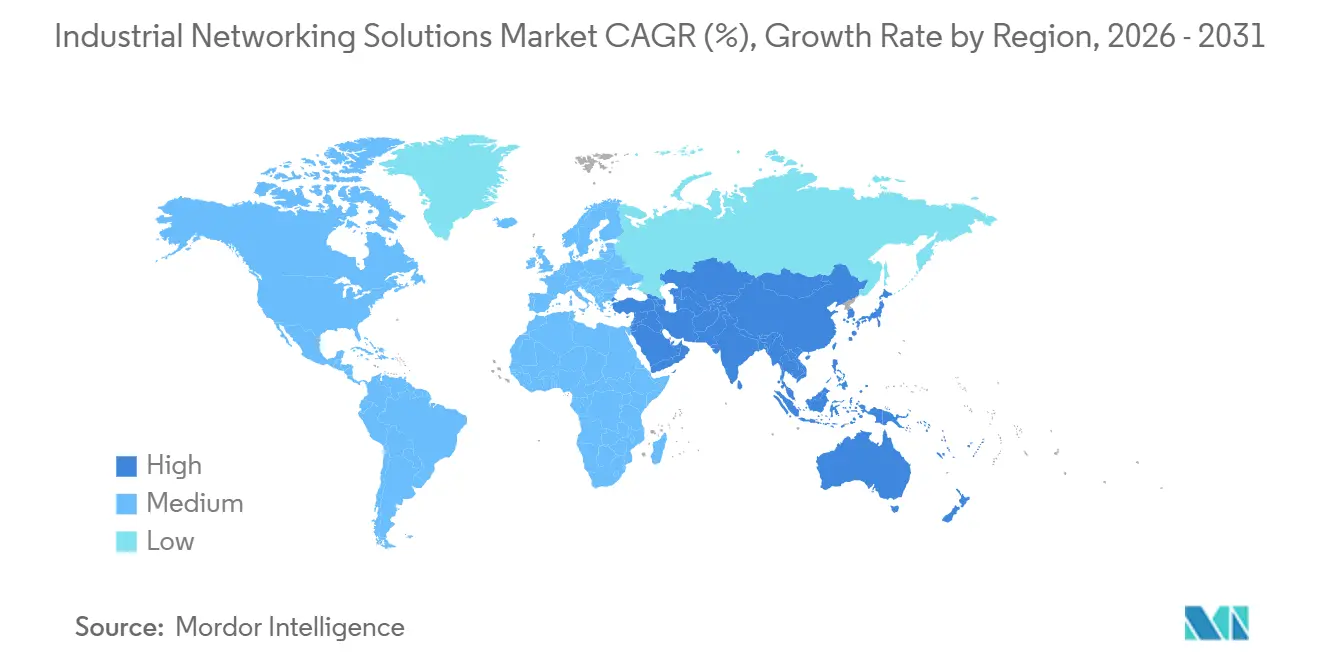
- By geography, Asia Pacific represented 33.84% of 2025 value, while the Middle East is projected to post the fastest 16.69% CAGR through 2031.
Note: Market size and forecast figures in this report are generated using Mordor Intelligence’s proprietary estimation framework, updated with the latest available data and insights as of 2026.
Global Industrial Networking Solutions Market Trends and Insights
Drivers Impact Analysis*
| Driver | (~)% Impact on CAGR Forecast | Geographic Relevance | Impact Timeline |
|---|---|---|---|
| Rapid Shift to IIoT-Ready Ethernet-Based Factory Floors | +3.2% | Global, with concentration in Asia Pacific and Europe | Medium term (2-4 years) |
| Convergence of OT/IT Driving SD-WAN Adoption in Plants | +2.8% | North America and Europe, expanding to Asia Pacific | Medium term (2-4 years) |
| 5G Private Networks Enabling Ultra-Low-Latency Control | +3.5% | Asia Pacific core, North America and Middle East early adopters | Long term (≥ 4 years) |
| Edge-AI-Powered Predictive Maintenance Lowering TCO | +2.9% | Global, led by automotive and discrete manufacturing hubs | Medium term (2-4 years) |
| Government Smart-Manufacturing Stimulus Packages | +2.4% | China, India, United States, European Union | Short term (≤ 2 years) |
| Open-Source Time-Sensitive Networking (TSN) Stacks | +1.8% | Global, strongest uptake in machinery and robotics sectors | Long term (≥ 4 years) |
| Source: Mordor Intelligence | |||
Rapid Shift to IIoT-Ready Ethernet-Based Factory Floors
Industrial Ethernet accounted for 76% of new node installations in 2025, climbing from 65% in 2022, as manufacturers coalesce around IEEE 802.3 physical layers to avoid parallel fieldbus inventories. Time-sensitive networking extensions such as IEEE 802.1Qbv traffic shaping and 802.1AS clock synchronization now deliver sub-microsecond jitter, giving automotive assembly plants the determinism once reserved for proprietary buses. Tier-one suppliers are therefore scrapping gateway-laden topologies and leaning on TSN-capable switches that let robotic welders and automated guided vehicles coexist on a unified Layer 2 fabric. The migration also unlocks remote recipe changes, an essential capability for contract manufacturers that pivot daily among high-mix, low-volume orders. In the European Union, compliance with IEC 61784-2 communication profiles has become an implicit procurement requirement, tying interoperability to regulatory conformity.
Convergence of OT and IT Driving SD-WAN Adoption in Plants
Plant operators installed software-defined wide-area overlays at 320 industrial sites in 2025, tripling the 2023 count, as zero-trust segmentation extends from enterprise data centers into operational enclaves.[1]Fortinet, “2025 State of Operational Technology and Cybersecurity Report,” Fortinet.com SD-WAN appliances abstract heterogeneous links into policy-driven tunnels, prioritizing supervisory-control traffic over historian uploads whenever bandwidth is scarce. Cisco integrates its Identity Services Engine with industrial SD-WAN, blocking a technician’s laptop from reaching safety controllers even when sharing the same switch.[2]Cisco Systems, “Industrial Networking Solutions,” Cisco.com Consolidation follows, 42% of North American discrete manufacturers placed both IT and OT networks under unified leadership in 2025, a structural shift that trims shadow IT and accelerates incident response. The result is a flatter vendor landscape where enterprises expect a single platform to police policy end to end.
5G Private Networks Enabling Ultra-Low-Latency Control
Standalone 5G anchored 1,840 private industrial networks worldwide by year-end 2025, and 62% of them sat in Asia Pacific.[3]GSMA, “Private 5G Networks in Industrial Settings: 2025 Survey,” GSMA.com Licensed 3.7-3.8 GHz spectrum silences the interference that plagued unlicensed Wi-Fi, letting manufacturers retire miles of copper without ceding deterministic control. John Deere’s Waterloo tractor plant achieved 8-millisecond round-trip latency for inspection cameras after activating 5G, eliminating reliance on wired drops. German regulators added 100 MHz of industrial spectrum in 2024, and Japan followed with allocations in 2025, lowering the entry barrier for mid-sized enterprises. Device density- up to 1 million endpoints per square kilometer- feeds real-time digital twins without choking backhaul, reinforcing the industrial networking solutions market as factories pursue granular visibility.
Edge-AI-Powered Predictive Maintenance Lowering TCO
Machine-learning accelerators shipped in 28% of new industrial gateways in 2025, up from 11% two years earlier, as manufacturers pivot from scheduled maintenance to condition-based strategies that trim unplanned downtime by roughly one-third. On-device inference processes vibration and thermal signatures locally, reducing cloud egress charges by 70% while satisfying sovereignty mandates that forbid exporting raw telemetry. Intel’s OpenVINO toolkit lets automation engineers deploy models for bearing-fault detection without needing to master deep learning frameworks. Automakers complement inference with on-premises time-series stores that retain 90 days of high-resolution data, enabling rapid root-cause analysis after a stoppage. Vendors are monetizing this capability through outcome-based contracts that link fees to units produced, resetting revenue logic across the industrial networking solutions market.
Restraints Impact Analysis*
| Restraint | (~) % Impact on CAGR Forecast | Geographic Relevance | Impact Timeline |
|---|---|---|---|
| Cyber-Physical Security Skill-Gap in Brown-Field Sites | -1.9% | Global, acute in North America and Europe | Medium term (2-4 years) |
| Proprietary Protocol Lock-In Inflating Migration Cost | -1.6% | Global, strongest in automotive and discrete manufacturing | Long term (≥ 4 years) |
| Semiconductor Supply-Chain Volatility for Industrial NICs | -1.3% | Global, most severe in Asia Pacific supply chains | Short term (≤ 2 years) |
| Power-Density Limits in Fan-Less Industrial Switch Design | -0.8% | Global, critical in hazardous-location deployments | Long term (≥ 4 years) |
| Source: Mordor Intelligence | |||
Cyber-Physical Security Skill-Gap in Brown-Field Sites
A 2025 International Society of Automation survey found that 68% of plant engineers lack formal training in IEC 62443 controls, leaving flat networks vulnerable to ransomware that hijacks programmable logic controllers.[4]International Society of Automation, “2025 OT Cybersecurity Workforce Analysis,” Isa.org Oil and gas operators rely on Windows XP human-machine interfaces that cannot host modern endpoint defenses, yet budgets rarely stretch to wholesale upgrades. TXOne Networks logged a 140% year-over-year jump in PLC-targeting ransomware, with attackers exploiting unpatched PROFINET stacks. Integration firms quote 18-24-month retrofit timelines, double 2022 benchmarks, because certified professionals are scarce. Certification enrollments climbed 85% in 2025, but real-world mastery still requires several years of apprenticeship, delaying risk reduction at scale.
Proprietary Protocol Lock-In Inflating Migration Cost
Enterprises absorb about USD 2.8 million per facility to rip and replace proprietary fieldbus infrastructure. Dominant vendors encrypt configuration databases, forcing dual toolchains whenever a second supplier enters the plant. Even when ten-year TCO models favor open standards, line managers balk at four-to-six-week commissioning windows that interrupt production. Although the Open Process Automation Forum champions vendor-neutral reference architectures, brownfield adoption remains thin because safety certifications require full recertification. The resulting inertia slows the transition of the industrial networking solutions market, particularly in automotive stamping and discrete electronics assembly lines.
*Our forecasts treat driver/restraint impacts as directional, not additive. The impact forecasts reflect baseline growth, mix effects, and variable interactions.
Segment Analysis
By Component: Recurring Revenue Reshapes Vendor Economics
The hardware slice of the industrial networking solutions market size held 62.73% of 2025 spending, anchored by ruggedized switches and gateways that operate from -40 to 85 °C and survive IEC 60068-2-6 vibration. Software and services, however, are advancing at a 16.58% CAGR in 2026-2031. Vendors that once lived on capital outlays now pitch analytics, security, and orchestration licenses that refresh annually, smoothing revenue curves. Cisco, for example, derived 38% of industrial bookings from recurring software in 2025, up from 22% in 2023. Services stretch from installation to managed detection and response, making headcount-light operators willing buyers.
Platform strategies dominate the second competitive layer. Belden’s zero-touch provisioning compressed switch commissioning from three days to four hours, cutting labor cost and freeing system integrators to bid more jobs. Phoenix Contact’s PLCnext marketplace listed 140 certified apps in 2025, moving control logic toward composable microservices. Hardware innovation is concentrating on 90-watt power-over-Ethernet injectors that energize machine-vision cameras and 2.5-gigabit copper PHYs that extend installed Cat5e runs. A parallel push for fanless thermal designs answers growing demand in Zone 2 hazardous locations where active cooling is forbidden.


By Connectivity Type: Wireless Gains Ground in Hazardous Zones
Wired topologies retained 56.81% of 2025 investment, relying on fiber cores and shielded twisted pair for deterministic motion control. Yet wireless infrastructure is racing forward at a 16.61% CAGR as private 5G and Wi-Fi 6E deliver bounded latency in sprawling facilities. Licensed spectrum appeals to mission-critical applications such as autonomous mobile robots, while unlicensed Wi-Fi suits predictive maintenance and worker connectivity. Nokia’s deployment at BMW’s Regensburg plant upgraded from private LTE to standalone 5G in 2025, illustrating the technology escalator common across discrete manufacturing.
Single-pair Ethernet widens wired relevance by stretching 10 Mbps over 1 km of unshielded cable, perfect for hazardous-area sensors where intrinsic safety limits power budgets. Wireless adoption faces policy friction in markets where spectrum licenses favor enterprises above certain revenue thresholds, constraining small and midsized factories. Hybrid architectures therefore emerge as the dominant compromise, with wired spines aggregating traffic from wireless edges. Moxa’s TSN-ready Wi-Fi 6E access point synchronizes IEEE 802.1AS clocks across wireless segments, a critical step toward end-to-end determinism.
By Deployment Type: Hybrid Models Bridge On-Premises and Cloud
On-premises deployments controlled 60.58% of 2025 revenue, primarily because programmable logic controllers and safety systems remain intolerant of public-cloud latency. Cloud-orchestrated hybrids, however, are posting a 16.65% CAGR as plants decouple real-time control from data-heavy analytics. Schneider Electric’s EcoStruxure funnels aggregated telemetry to Azure while local gateways close control loops, proving that sovereignty and performance can coexist. Discrete manufacturers lead adoption: 34% of sites ran hybrid architectures in 2025, compared with 19% in the process industries.
Honeywell’s cloud-native Experion variant can instantiate virtual controllers in minutes for non-safety workloads, opening a pathway to elastic capacity. Regulatory bodies echo the shift. IEC 62443-4-2 Amendment 1, published in 2024, outlines security baselines for cloud-hosted automation components, providing compliance-driven operators with a roadmap. Edge appliances blur the boundary further, running containerized workloads locally while inheriting policy from cloud control planes. Dell Technologies brands the model “cloud-adjacent,” capturing enterprises that want SaaS simplicity without relinquishing data custody.
By End-User Industry: Logistics Outpaces Traditional Manufacturing
Manufacturing absorbed 37.53% of 2025 outlays, sustained by entrenched automation and high switching costs. Yet logistics and transportation are the star performers, expanding at a 16.71% CAGR as e-commerce warehouses mobilize fleets of autonomous robots that demand deterministic wireless coverage across half-million-square-foot facilities. Automotive final assembly continues to dominate the manufacturing subset, its electrification roadmap forcing flexible networks able to accommodate model-mix volatility.
Telecommunications carriers invested USD 4.2 billion in ruggedized networking gear for mobile-edge compute in 2025, a testament to cross-vertical convergence. Mining, energy, and utilities collectively take an 18% share as remote wellheads and substations adopt industrial cellular routers to replace leased lines. Logistics providers, managing multi-tenant warehouses, lean on software-defined segmentation instead of proliferating VLANs, lowering mean time to isolation during security events. As skill shortages intensify, industries with lighter regulatory burdens adopt managed-service models that outsource 24/7 network operations.
Geography Analysis
Asia Pacific led the industrial networking solutions market in 2025 with a 33.84% share, driven by large-scale smart manufacturing subsidies from China and production-linked incentives from India. Domestic vendors such as Huawei now field TSN-capable switches that comply with national cybersecurity frameworks, fragmenting global supply chains while pulling component sourcing inward. Government mandates stipulating Ethernet-ready infrastructure for greenfield plants accelerate refresh cycles beyond what pure market forces would dictate.
North America is supported by automotive and aerospace corridors, and semiconductor fabs benefitting from CHIPS Act incentives. Regulatory emphasis on zero-trust segmentation is pushing enterprises to modernize both their hardware and policy stacks, expanding the addressable market for OT-aware cybersecurity vendors. In Europe, Germany’s Mittelstand is actively retrofitting brownfield machinery to meet the European Union’s cybersecurity-by-design rules set to activate in 2027. Subsidy linkage between machinery purchases and IEC 62443 conformity converts compliance from a cost center to revenue enablement.
The Middle East achieved the fastest regional CAGR at 16.69% between 2026 and 2031. Saudi Arabia’s Vision 2030 anchored USD 6.4 billion in NEOM commitments that require IIoT-ready networks as table stakes. The United Arab Emirates grants 10-year tax holidays to factories that secure Industry 4.0 certification, strengthening the pull for Ethernet-and-analytics bundles. South America and Africa are witnessing growing demand for ruggedized cellular routers and fiber backbones, driven by Brazil’s auto sector and South Africa’s mining operations. However, currency volatility and inconsistent spectrum policy continue to moderate uptake.

Competitive Landscape
Competition in the industrial networking solutions market is moderately fragmented, the top five suppliers- Cisco, Siemens, Rockwell Automation, Schneider Electric, and ABB- held a considerable share of global revenue in 2025. Incumbent automation houses leverage decades of installed base and domain know-how to defend brownfield accounts, while hyperscale cloud providers bundle edge gateways into broader compute contracts to win greenfield factories. Cybersecurity specialists carve out operational technology niches, addressing the depth of protocols that traditional IT security firms lack.
Siemens’ USD 10.6 billion purchase of Altair Engineering in 2024 underscores an industrywide preference for buying software velocity rather than building it. Patent filings around IEEE 802.1 TSN rose 63% in 2025, led by Huawei, Cisco, and Siemens, signaling that intellectual property is becoming a moat as determinism moves from optional to obligatory. White-space remains in protocol-translation middleware, brownfield sites still need gateways that reconcile PROFINET, EtherCAT, and OPC UA without forklift upgrades, an opening small vendors chase with software-defined bridges.
Edge-AI inference is the new battleground. Semiconductor giants integrate accelerators directly into gateways, while automation incumbents roll proprietary inference engines that dovetail with ladder logic. Outcome-based service contracts, modeled on aerospace “power-by-the-hour,” grow in popularity as vendors retain machine ownership and bill by unit produced. Fortinet’s 2024 acquisition of an OT-centric deep-packet-inspection firm highlights a larger consolidation wave as vendors assemble full-stack portfolios able to span policy, analytics, and hardware.
Regulatory compliance is emerging as a premium feature. Vendors certified to IEC 62443-4-1 secure-development lifecycles command 15-20% price uplifts in Europe, effectively segmenting the field into compliance-ready incumbents and budget-oriented challengers. Market messaging therefore centers on unified management panes that collapse IT and OT visibility, echoing data-center software-defined networking playbooks but tuned for deterministic, safety-critical environments.
Industrial Networking Solutions Industry Leaders
Cisco Systems, Inc.
Huawei Technologies Co., Ltd.
Siemens AG
Rockwell Automation, Inc.
Schneider Electric SE
- *Disclaimer: Major Players sorted in no particular order

Recent Industry Developments
- January 2026: Cisco committed USD 1.2 billion to launch Catalyst IE9400 rugged switches with integrated 5G radios and TSN functions, targeting electric-vehicle and logistics plants.
- September 2025: Siemens completed Altair integration and rolled out a platform that marries simulation with edge hardware, cutting virtual-to-physical commissioning time by up to 40%.
- August 2025: Schneider Electric and Microsoft deployed edge-AI energy management across 450 sites, reporting 18-22% savings in HVAC and compressed-air loads.
- July 2025: Rockwell Automation partnered with Palo Alto Networks to embed zero-trust segmentation into FactoryTalk, trimming average incident response by 40% at pilot locations.


Global Industrial Networking Solutions Market Report Scope
An industrial network solution is an essential part of any automation system architecture, as it provides effective means of data exchange and control, and flexibility for connecting multiple devices. Generally, communication networks enable data communication between computers and other devices. These networks are used for the distribution of multiple products and for offering technical support, including wired and wireless networking systems.
The Industrial Networking Solutions Market Report is Segmented by Component (Hardware, Software and Services), Connectivity Type (Wired and Wireless), Deployment Type (On-Premises and Cloud), End-User Industry (Automotive, Financial Services, Manufacturing, Telecommunications, Logistics and Transportation, Mining, Oil and Gas, and Energy and Utilities), and Geography. The Market Forecasts are Provided in Terms of Value (USD).
| Hardware |
| Software and Services |
| Wired |
| Wireless |
| On-Premises |
| Cloud |
| Automotive |
| Financial Services |
| Manufacturing |
| Telecommunications |
| Logistics and Transportation |
| Mining |
| Oil and Gas |
| Energy and Utilities |
| North America | United States |
| Canada | |
| Mexico | |
| South America | Brazil |
| Argentina | |
| Rest of South America | |
| Europe | United Kingdom |
| Germany | |
| France | |
| Italy | |
| Rest of Europe | |
| Asia-Pacific | China |
| Japan | |
| India | |
| South Korea | |
| Rest of Asia-Pacific | |
| Middle East | Israel |
| Saudi Arabia | |
| United Arab Emirates | |
| Rest of Middle East | |
| Africa | South Africa |
| Egypt | |
| Rest of Africa |
| By Component | Hardware | |
| Software and Services | ||
| Connectivity Type | Wired | |
| Wireless | ||
| By Deployment Type | On-Premises | |
| Cloud | ||
| By End-User Industry | Automotive | |
| Financial Services | ||
| Manufacturing | ||
| Telecommunications | ||
| Logistics and Transportation | ||
| Mining | ||
| Oil and Gas | ||
| Energy and Utilities | ||
| By Geography | North America | United States |
| Canada | ||
| Mexico | ||
| South America | Brazil | |
| Argentina | ||
| Rest of South America | ||
| Europe | United Kingdom | |
| Germany | ||
| France | ||
| Italy | ||
| Rest of Europe | ||
| Asia-Pacific | China | |
| Japan | ||
| India | ||
| South Korea | ||
| Rest of Asia-Pacific | ||
| Middle East | Israel | |
| Saudi Arabia | ||
| United Arab Emirates | ||
| Rest of Middle East | ||
| Africa | South Africa | |
| Egypt | ||
| Rest of Africa | ||


Key Questions Answered in the Report
How fast is spending expected to grow for industrial networking solutions through 2031?
Global value is forecast to rise from USD 36.48 billion in 2026 to USD 78.43 billion in 2031, reflecting a 16.54% CAGR across the period.
Which component segment is expanding quickest?
Software and services are advancing at a 16.58% CAGR, outpacing hardware as vendors pivot to subscription models.
Why are logistics facilities adopting industrial networking upgrades so aggressively?
Autonomous mobile robots and real-time inventory visibility require deterministic wireless connectivity, driving a 16.71% CAGR in the vertical through 2031.er share.
What makes 5G private networks attractive for factories?
Licensed spectrum removes interference, delivering sub-10 ms latency and supporting dense sensor meshes that feed digital twins.
Which region is likely to post the fastest growth?
The Middle East leads with a projected 16.69% CAGR, propelled by Saudi Vision 2030 and United Arab Emirates tax incentives that mandate IIoT readiness.centage points from forecast CAGR.
Page last updated on:


