
Industrial Analytics Market Size and Share
Market Overview
| Study Period | 2020 - 2031 |
|---|---|
| Market Size (2026) | USD 44.57 Billion |
| Market Size (2031) | USD 97.38 Billion |
| Growth Rate (2026 - 2031) | 16.92 % |
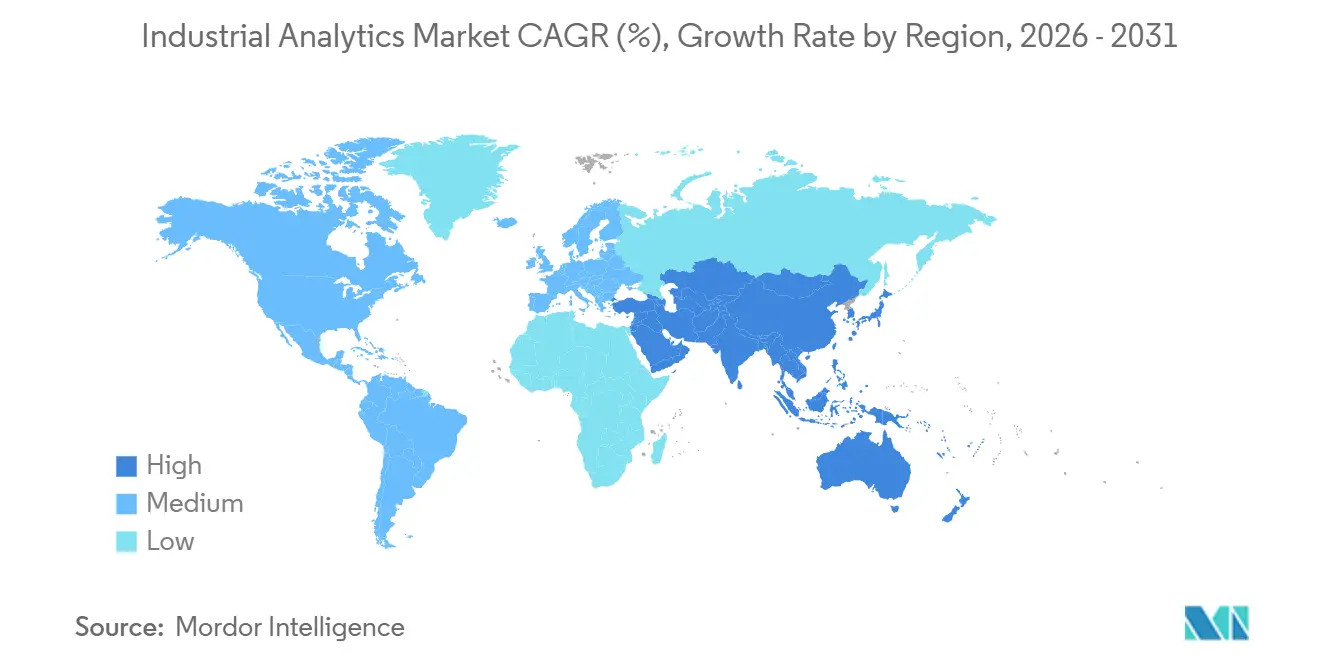
| Fastest Growing Market | Asia Pacific |
| Largest Market | North America |
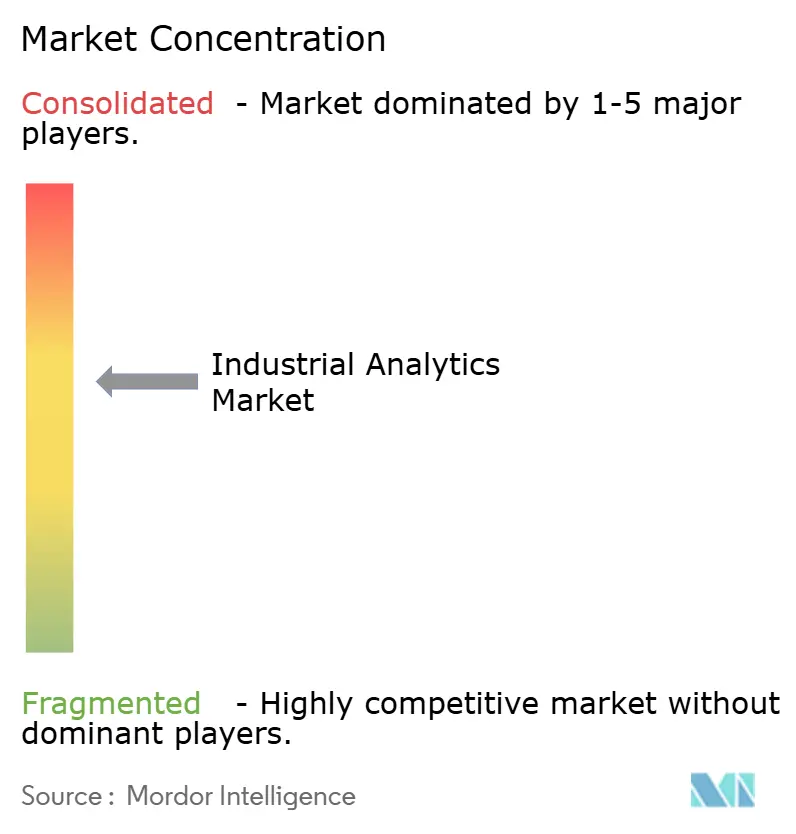
| Market Concentration | Medium |
Major Players *Disclaimer: Major Players sorted in no particular order Image © Mordor Intelligence. Reuse requires attribution under CC BY 4.0. | |
Industrial Analytics Market Analysis by Mordor Intelligence
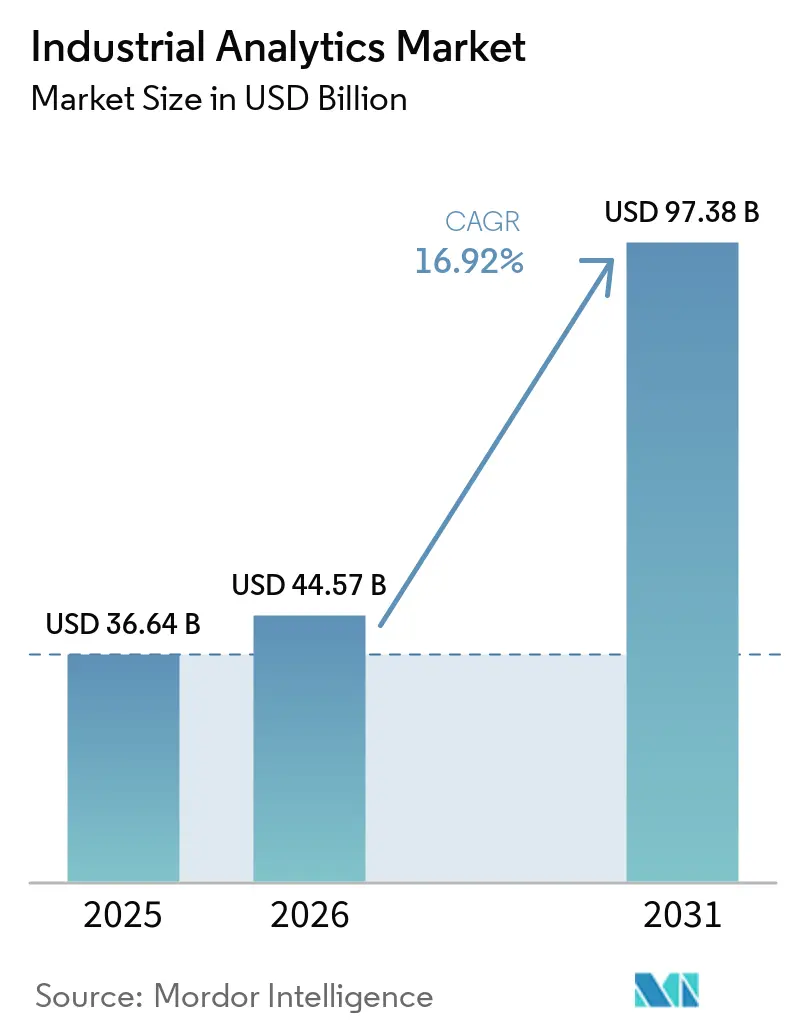
The industrial analytics market size was valued at USD 36.64 billion in 2025 and is estimated to grow from USD 44.57 billion in 2026 to reach USD 97.38 billion by 2031, at a CAGR of 16.92% during the forecast period (2026-2031). The rising demand for real-time optimization, growing edge-to-cloud connectivity, and escalating sustainability regulations are the primary drivers behind this expansion. Vendors are embedding prescriptive intelligence directly into automation layers, allowing operators to act on insights within milliseconds. A steady migration toward hybrid architectures, where low-latency workloads run on-site and model retraining occurs in the cloud, underpins long-term growth. Heightened cyber-physical threats, talent shortages, and data-sovereignty mandates temper the outlook but do not alter the upward trajectory of the industrial analytics market.
Key Report Takeaways
- By deployment, cloud led with 59.12% revenue share in 2025 and is projected to advance at a 17.09% CAGR through 2031.
- By component, software captured 62.34% share in 2025, whereas services are forecast to expand at a 17.21% CAGR to 2031.
- By analytics type, predictive analytics accounted for 47.19% revenue in 2025, while prescriptive analytics is poised to grow at a 17.36% CAGR through 2031.
- By end-user industry, manufacturing commanded 29.36% share in 2025, whereas utilities are set to register an 18.23% CAGR to 2031.
- By organization size, large enterprises held 61.57% share in 2025, while small and medium-sized enterprises are projected to increase at a 17.14% CAGR through 2031.
- By application, asset performance management led with 33.48% share in 2025, whereas energy management is anticipated to rise at a 17.89% CAGR to 2031.
- By geography, North America retained 38.29% market share in 2025, while Asia-Pacific is forecast to expand at a 17.96% CAGR through 2031.
Note: Market size and forecast figures in this report are generated using Mordor Intelligence’s proprietary estimation framework, updated with the latest available data and insights as of January 2026.
Market Trends and Insights
Drivers Impact Analysis of Industrial Analytics Market*
| Driver | (~) % Impact on CAGR Forecast | Geographic Relevance | Impact Timeline |
|---|---|---|---|
| Expansion of Edge Computing Capabilities | +3.2% | Global, with concentration in North America and Asia-Pacific manufacturing hubs | Medium term (2-4 years) |
| Integration of Industrial AI in Low-Code Platforms | +2.8% | Global, early adoption in North America and Europe | Short term (≤ 2 years) |
| Proliferation of 5G-Enabled Industrial IoT Networks | +3.5% | Asia-Pacific core, spill-over to Europe and North America | Medium term (2-4 years) |
| Regulatory Push for Energy-Efficient Operations | +2.4% | Europe and North America, emerging in Asia-Pacific | Long term (≥ 4 years) |
| Standardization of Digital Twins Across Asset-Intensive Sectors | +2.1% | Global, led by manufacturing and utilities in developed markets | Long term (≥ 4 years) |
| Mainstream Adoption of Pay-per-Use Analytics Models | +1.9% | Global, accelerated uptake in emerging markets and SME segments | Short term (≤ 2 years) |
| Source: Mordor Intelligence | |||
Expansion of Edge Computing Capabilities
Edge-localized inference eliminates network bottlenecks for latency-sensitive tasks such as robotic path planning, vision-based quality checks, and substation fault isolation. Honeywell and Google Cloud deployed micro-nodes that process sensor streams on-site, reducing bandwidth costs by 30%.[1]Source: Honeywell, “Honeywell and Google Cloud Collaborate on Industrial AI,” honeywell.com IBM shipped 15-watt edge devices that run predictive models on offshore platforms where connectivity is sporadic. Microsoft Azure Stack integrates seamlessly with Siemens Industrial Edge, allowing manufacturers to train centrally and then push compressed weights to shop-floor gateways. Such architectures ensure uninterrupted operations when networks fail and allow real-time control loops to operate within single-digit millisecond windows. Resulting productivity gains make edge computing one of the highest-impact catalysts for the industrial analytics market.
Integration of Industrial AI in Low-Code Platforms
Drag-and-drop workflows seamlessly embed analytics into maintenance, quality, and logistics processes, eliminating the need for Python or SQL skills. Bain research showed a 60% reduction in deployment time when plants used low-code tools versus traditional programming. Microsoft Power Platform now ships with anomaly-detection models tuned for pumps, motors, and compressors.[2]Honeywell, “Honeywell and Google Cloud Collaborate on Industrial AI,” honeywell.com IFS and ServiceNow link sensor events to work-order generation, allowing technicians to receive prescriptive actions instantly. McKinsey’s 2025 Lighthouse Network found that factories that embraced low-code recorded 25% faster root-cause analyses. The ease of configuration lowers barriers for small plants and accelerates the diffusion of industrial analytics market best practices.
Proliferation of 5G-Enabled Industrial IoT Networks
Private 5G networks deliver sub-10-millisecond latency, enabling mobile robots and AR-assisted maintenance to function safely. Nokia rolled out private 5G across 12 European factories, improving AGV collision avoidance metrics by 40%.[3]Microsoft, “Microsoft and Siemens Deepen Partnership,” news.microsoft.com Verizon streamed HD video to cloud vision models in a U.S. auto plant, increasing defect detection rates by 23%. Cisco and Ericsson added TSN support, letting OT and IT traffic converge on a single backbone. Standardized slicing from Deutsche Telekom guarantees throughput for analytics even in congested environments. As spectrum fees fall, 5G becomes an essential enabler for the industrial analytics market, especially in high-density plants.
Regulatory Push for Energy-Efficient Operations
The European Union’s Corporate Sustainability Reporting Directive requires approximately 50,000 firms to disclose asset-level energy data, driving demand for embedded metering analytics. The U.S. EPA proposed continuous emissions monitoring rules, nudging utilities toward the use of real-time dashboards. China’s dual-control policy requires hourly energy consumption reporting through provincial portals. ISO 50001 certification became a prerequisite for public procurement bids in several EU states. These policies lift long-run demand for the industrial analytics market because compliance requires granular insights that spreadsheets cannot deliver.
Restraints Impact Analysis of Industrial Analytics Market*
| Restraint | (~) % Impact on CAGR Forecast | Geographic Relevance | Impact Timeline |
|---|---|---|---|
| Data-Sovereignty Concerns in Cross-Border Cloud Deployments | -1.8% | Europe, China, and emerging markets with localization mandates | Medium term (2-4 years) |
| Shortage of Industrial-Domain-Specific Data Scientists | -1.5% | Global, acute in emerging markets and SME segments | Long term (≥ 4 years) |
| Cyber-physical Security Vulnerabilities in OT Networks | -1.2% | Global, heightened in critical infrastructure sectors | Short term (≤ 2 years) |
| Legacy Equipment Integration Costs | -1.4% | North America and Europe brownfield sites, emerging in Asia-Pacific | Medium term (2-4 years) |
| Source: Mordor Intelligence | |||
Data-Sovereignty Concerns in Cross-Border Cloud Deployments
China’s Data Security Law forces multinationals to store operational data on domestic servers, preventing global data-lake consolidation. The EU’s GDPR restricts the exporting of employee biometrics used in access control, driving vendors to set up regional inference clusters. India’s draft Digital Personal Data Protection Act may adopt similar localization clauses. Each silo raises infrastructure costs, fragments model training, and slows feature rollouts. For the industrial analytics market, this introduces friction that vendors can only mitigate with edge or hybrid architectures.
Shortage of Industrial-Domain-Specific Data Scientists
A World Economic Forum survey revealed that 63% of manufacturers cite talent scarcity as the primary barrier to scaling AI. Few university programs teach both data science and programmable logic controllers, forcing employers to invest up to 18 months in upskilling. McKinsey projects a 40% supply gap for industrial data scientists through 2030. SMEs are hit hardest because they cannot match the salaries of large enterprises. Vendors are embedding more domain logic into templates; however, highly customized processes, such as underground mining or continuous-batch pharmaceuticals, still rely on scarce human expertise, thereby diluting the growth rate of the industrial analytics market.
*Our forecasts treat driver/restraint impacts as directional, not additive. The impact forecasts reflect baseline growth, mix effects, and variable interactions.
Industrial Analytics Market Segment Analysis
By Deployment:
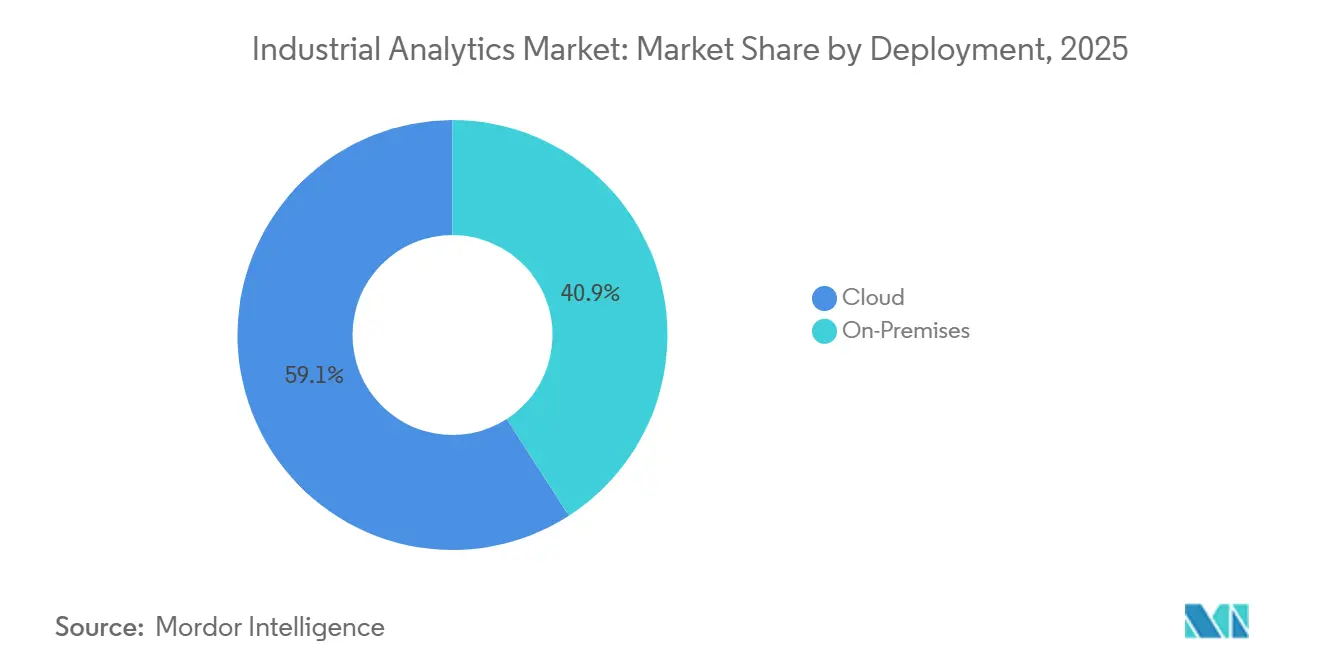
Hybrid Architectures Bridge Cloud and EdgeCloud-based implementations accounted for 59.12% of the industrial analytics market share in 2025, as manufacturers adopted consumption pricing and pre-trained models. The industrial analytics market size for cloud deployments is projected to expand at a 17.09% CAGR, driven by integrations with Microsoft Azure, AWS IoT SiteWise, and Google Cloud Vertex AI. On-premises systems continue to serve latency-critical workflows in defense and pharmaceutical industries, accounting for 40.88% of demand. Hybrid use cases are multiplying. Schneider Electric’s EcoStruxure synchronizes models bi-directionally, allowing regulatory data to remain on-site while benefiting from cloud-based retraining. ABB’s Ability Genix offers similar advantages, demonstrating how federated architectures can satisfy sovereignty, uptime, and scalability within a single stack.
The growing mesh of local gateways and centralized MLOps pipelines enables firms to retain sensitive data while benchmarking performance against anonymized peer metrics in the cloud. This blended approach resonates with multinational manufacturers juggling multiple jurisdictions. As orchestration tooling matures, hybrid architectures are expected to dominate new deployments, cementing their role at the core of future industrial analytics market growth.


By Component:
Service Revenues Rise With ComplexitySoftware represented 62.34% revenue in 2025, but services are catching up fast with a 17.21% CAGR through 2031. Enterprises outsource sensor integration, feature engineering, and continuous model tuning to partners such as Accenture, Deloitte, and PwC. As a result, the industrial analytics market size for services is expanding faster than the software layer. Vendors, ranging from SAP and IBM to Siemens, bundle managed offerings that include equipment profile libraries, anomaly threshold calibration, and security patching.
Because industrial assets age and process variables drift, analytics initiatives require perpetual recalibration. Customers rely on system integrators to embed change management and domain expertise. This service-centric model transforms analytics from a capital purchase into an operational expenditure, deepening vendor-client relationships and fostering recurring revenue streams that will shape the industrial analytics market through 2031.
By Analytics Type:
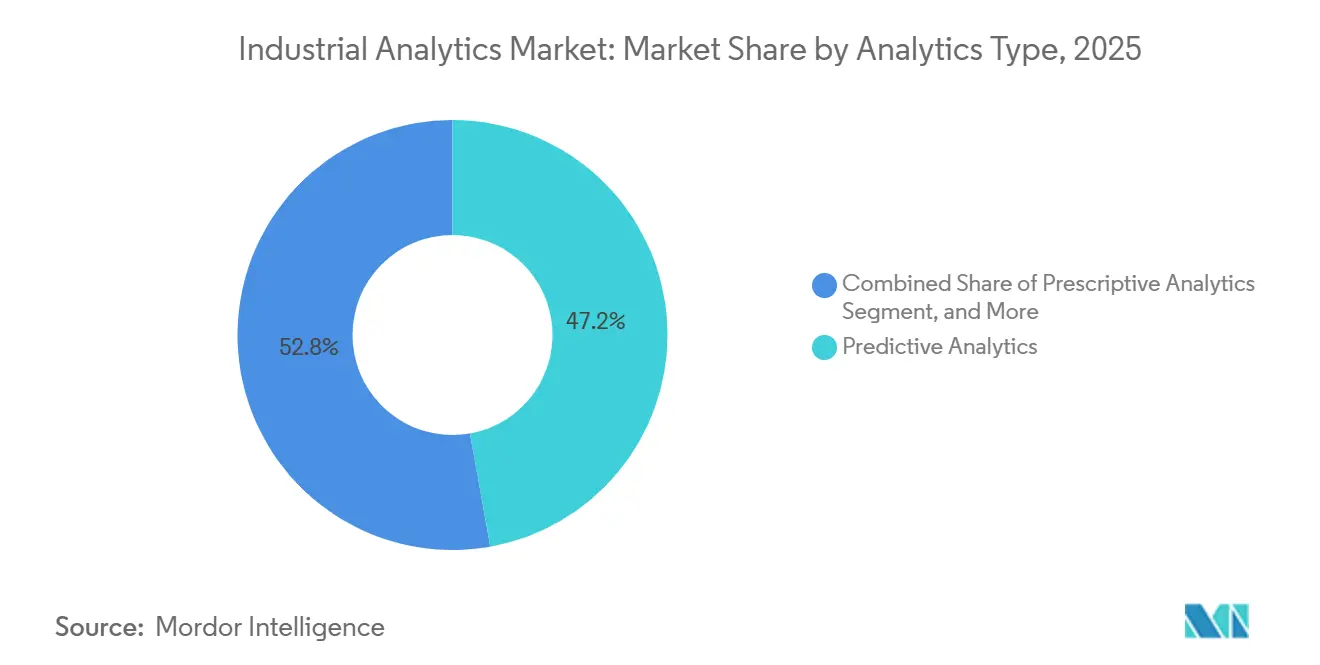
Prescriptive Engines Close the LoopPredictive analytics held a 47.19% share in 2025; however, prescriptive tools are advancing at a 17.36% CAGR, as operators demand automated set-point adjustments rather than dashboard alerts. The industrial analytics market size for prescriptive solutions is poised to grow rapidly, as they free human experts from routine decision-making cycles. GE Digital’s turbines now self-calibrate combustion parameters, while Rockwell’s FactoryTalk dispatches technician-specific work orders based on parts availability. Reinforcement learning in PTC ThingWorx adds autonomous optimization loops that improve over time.
While descriptive dashboards are crucial for regulatory reporting, they offer only modest operational savings. Consequently, there's a swift shift in budget allocations towards prescriptive engines, which leverage advanced analytics to provide actionable insights and optimize decision-making processes. This transition is significantly reducing payback periods from years to mere months, enabling organizations to achieve faster returns on investment. Vendors emphasizing closed-loop control and integrated workflow automation are well-positioned to capture a substantial portion of the growing industrial analytics market, as these capabilities address the increasing demand for efficiency and streamlined operations.

By End-User Industry:
Utilities Outpace ManufacturingManufacturing controlled 29.36% of demand in 2025, leveraging analytics for yield improvement and downtime reduction. However, utilities are forecast to post an 18.23% CAGR as renewable intermittency forces grid operators to implement real-time balancing algorithms. National Grid ESO reduced balancing costs by integrating wind and solar forecasts into its dispatch models, and Duke Energy reduced transformer failures by 30% through the use of predictive maintenance. These successes make utilities the fastest-expanding cohort in the industrial analytics market.
Other sectors, including mining and logistics, are also advancing adoption. Rio Tinto uses route-optimizing analytics for autonomous haulage, while Maersk applies shipboard sensors to schedule engine servicing during port calls. Each vertical adds nuanced requirements, such as safety compliance in mines and cold-chain integrity in logistics, fueling a broad-based rise in industrial analytics market penetration across asset-intensive industries. With the significant presence of manufacturing sector especially heavy industries across the region is expected to be the front-runners in the growth of manufacturing analytics market.
By Organization Size:
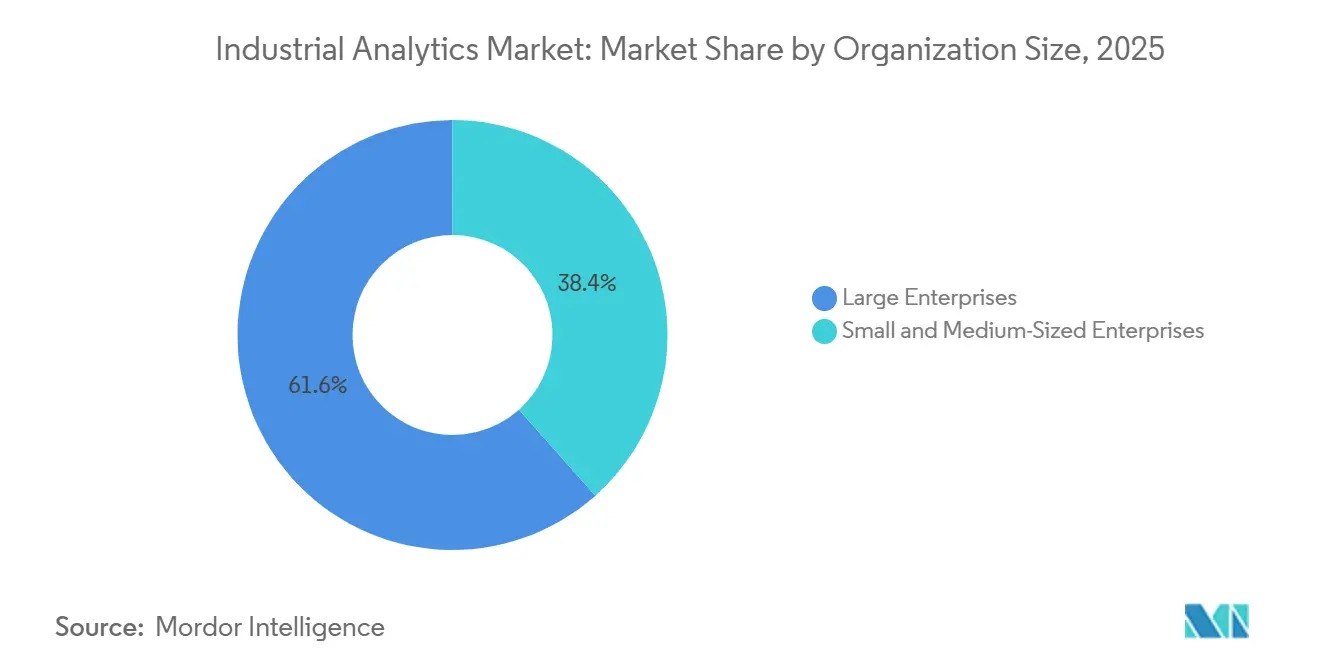
SMEs Benefit From Pay-Per-UseLarge enterprises commanded a 61.57% share in 2025, but small and medium-sized firms are registering a 17.14% CAGR, thanks to pay-as-you-go tiers that eliminate capital barriers. The adoption of industrial analytics among SMEs accelerates when suppliers, such as Siemens and AWS, offer free or low-volume starter packages. Vertical templates shorten deployment cycles, and consumption pricing keeps monthly outlays aligned with production volumes. Challenges persist, especially in areas such as cybersecurity staffing and governance; however, managed services and cloud-native security controls are helping to lower these hurdles.
As the SME segment continues to grow, it broadens the total addressable market for industrial analytics. This shift indicates a rising demand trend, prioritizing affordability and simplicity over extensive customization. Driven by the pursuit of operational efficiency, cost reduction, and competitive edge, SMEs are increasingly adopting industrial analytics solutions. These solutions enable businesses to optimize processes, improve decision-making, and identify growth opportunities, thereby fueling the market's growth.
By Application:
Energy Management SurgesAsset performance management retained a 33.48% share in 2025, but energy-management solutions are expanding at a 17.89% CAGR, driven by carbon-pricing schemes and volatile electricity rates. Schneider Electric’s Resource Advisor and ABB’s Energy Manager target multi-site enterprises that need load-shifting and demand-response insights. Because energy costs often account for 10-40% of operating expenses in heavy industry, even marginal efficiency gains can pay for analytics subscriptions within a quarter. Consequently, energy-focused modules are poised to capture a growing share of the industrial analytics market by 2031.
Quality optimization, supply-chain visibility, and safety analytics round out application demand. Each draws on the same sensor and time-series foundations, reinforcing the platform approach that vendors favor. Cross-application synergies enhance customer loyalty by enabling seamless integration and functionality across multiple modules. This reduces churn rates among multi-module users, as they are more likely to remain engaged with the platform. Consequently, these synergies drive sustained revenue growth in the industrial analytics market over the long term.
Geography Analysis
North America Industrial Analytics Market
North America contributed 38.29% of the industrial analytics market share in 2025, driven by investments in the semiconductor, automotive, and oil and gas sectors, linked to the CHIPS and Science Act. Federal incentives stipulate digital-twin capabilities, catalyzing analytics deployments across greenfield fabs. Canada’s Strategic Innovation Fund backed aerospace and EV battery pilots, while Mexican nearshoring projects embraced cloud-edge hybrids to accelerate plant commissioning. Fragmented state privacy laws raise compliance overhead but also spur demand for governance modules, indirectly benefiting software vendors.
APAC Industrial Analytics Market
Asia-Pacific is forecast to record a 17.96% CAGR through 2031. China ties subsidies to smart-manufacturing metrics, pushing factories to retrofit lines with digital twins. India’s Production-Linked Incentive scheme requires real-time quality analytics for reimbursement eligibility, creating a multiplier effect for the industrial analytics market. Japan’s Society 5.0 promotes human-robot collaboration powered by fatigue-prediction models, while South Korea’s smart-factory program subsidizes the adoption of SME analytics. Australia’s mining sites utilize edge analytics to enhance haul-truck efficiency, while Southeast Asian exporters implement compliance dashboards to meet EU due diligence requirements.
Europe Industrial Analytics Market
Europe’s growth story revolves around sustainability compliance. The Corporate Sustainability Reporting Directive promotes equipment-level energy audits, while Germany’s Industrie 4.0 grants encourage mid-size manufacturers to adopt digital twins. France’s Industry of the Future tax incentives and the United Kingdom’s Made Smarter grants further expand demand. Eastern markets remain nascent, but local vendors in Russia tailor offerings to national standards to circumvent import restrictions, adding regional flavor to the industrial analytics market.
MEA and South America Industrial Analytics Market
The Middle East and Africa, along with South America, represent emerging growth pockets. Saudi Arabia’s Vision 2030 drives analytics for petrochemicals and utilities, and South Africa’s mines deploy safety analytics to detect gas leaks. Brazil’s agribusiness chains integrate precision agriculture with food-processing analytics, and Argentina’s lithium producers utilize models to reduce water usage. Although absolute spend is lower than in developed regions, pilot projects are accelerating across these territories, widening the global footprint of the industrial analytics market.

Regulatory Landscape
Industrial analytics deployments increasingly fall under cybersecurity, data-access, and AI-governance obligations that influence architecture choices (cloud vs hybrid vs edge). In the European Union, the EU Artificial Intelligence Act (Regulation (EU) 2024/1689) introduces requirements for high-risk AI uses, including risk management, technical documentation, and post-market monitoring. That, in turn, pushes providers and deployers toward traceability and audit-ready MLOps for analytics embedded in industrial operations. Separately, the EU Data Act creates data-access and portability obligations for connected products and related services, with enforcement milestones that drive changes to data handling and user-access layers.
In the United States, OT operators face tighter critical-infrastructure cyber expectations through government and sector guidance. CISA has published OT-focused material, including its 2025 secure-by-demand priority considerations and 2026 principles for secure integration of AI in operational technology. For electric utilities, the NERC reliability standards process also affects how industrial analytics are applied in grid operations; in March 2026, NERC submitted proposed Reliability Standard CIP-003-11 for approval, expanding cybersecurity management controls to additional categories of BES cyber systems. Across regions, references to ISA/IEC 62443 in OT security guidance continue to shape procurement and certification requirements for industrial analytics vendors, integrators, and end users.
Value Chain Analysis
The industrial analytics value chain covers (1) data generation and connectivity (sensors, PLC/DCS/SCADA, historians, gateways, private 5G), (2) data engineering and industrial data platforms (time-series management, contextualization, digital thread), (3) analytics and AI (model development, MLOps, digital twins, APM, energy management), and (4) delivery and lifecycle services (system integration, managed services, cybersecurity hardening, continuous model tuning). Large automation suppliers (for example, Siemens, ABB, Schneider Electric, Rockwell Automation, Honeywell) and hyperscalers tend to anchor platform layers, while telecom and edge ecosystem participants influence latency, determinism, and secure transport for plant-floor and fleet workloads.
Recent ecosystem moves point to closer coupling between industrial software and adjacent enterprise and network layers. In June 2026, Siemens and IFS announced a strategic partnership to integrate Siemens industrial AI and MES with IFS enterprise asset management and service data, reflecting a shift toward closed-loop workflows that connect engineering, operations, and maintenance. In Europe, T-Systems and SupplyOn partnered in June 2026 to connect the SupplyOn network to the T-Systems Industrial AI Cloud, while T-Systems also operationalized a high-performance computing facility in Munich using 10,000 NVIDIA Blackwell GPUs (February 2026). This strengthens regional AI compute availability for model training and simulation tied to industrial analytics. On the connectivity side, Nokia introduced a commercial AI-native RAN platform (July 2026), signaling the telecom layer's move toward AI-native infrastructure that supports increasingly data-intensive industrial edge use cases.
Competitive Landscape
Incumbent automation firms, such as Siemens, ABB, Schneider Electric, Rockwell Automation, and Honeywell, bundle analytics with control hardware, leveraging their installed bases to deepen lock-in. Cloud hyperscalers, including Microsoft Azure, AWS, Google Cloud, IBM, and Oracle, compete on scalable MLOps, pre-trained models, and pay-as-you-go economics. Specialized software providers such as PTC, SAP, SAS Institute, and Splunk target vertical niches: PTC for discrete manufacturing, SAP for process industries, and Splunk for log analytics tied to OT cybersecurity.
Strategic partnerships abound. Siemens and Microsoft co-developed industrial-metaverse applications that merge CAD, simulation, and live sensor data. Honeywell and Accenture formed a joint venture to deliver analytics-as-a-service to mid-sized factories, while SAP and NVIDIA integrated physics-accurate digital twins into their supply-chain suites. Investment in R&D remains robust: ABB expanded its Bangalore analytics lab by USD 150 million, filing patents on reinforcement learning for industrial control.
Competition now revolves around platform completeness, cybersecurity certification, and domain-specific model libraries. Vendors scoring IEC 62443 compliance gain an edge with risk-averse customers. As platforms converge, differentiation shifts to the speed of deployment, breadth of templates, and ecosystem openness. Despite intense rivalry, the top 10 suppliers control roughly 45-50% of the revenue, indicating a moderately concentrated industrial analytics market where both scale and domain depth are important factors.
Industrial Analytics Industry Leaders
Cisco Systems
IBM Corporation
General Electric Company
Oracle Corporation
Robert Bosch GmbH
- *Disclaimer: Major Players sorted in no particular order
Industrial Analytics Market Companies Covered in this Report
- Cisco Systems
- IBM Corporation
- General Electric Company
- Amazon Web Services Inc.
- Oracle Corporation
- Hewlett-Packard Enterprise
- Robert Bosch GmbH
- Microsoft Corporation
- SAP SE
- ABB Ltd.
- Siemens AG
- Hitachi Ltd.
- Honeywell International Inc.
- Schneider Electric SE
- SAS Institute Inc.
- Splunk Inc.
- Rockwell Automation Inc.
- PTC Inc.
- Intel Corporation
- Uptake Technologies Inc.

Market Opportunities and Future Outlook
A key whitespace is operationalizing industrial analytics beyond dashboards into governed, closed-loop execution across maintenance, quality, energy, and production control, especially in sites that run mixed fleets of legacy equipment and newer connected assets. Named programs and roadmaps emphasize trustworthy and explainable AI in smart manufacturing. That creates room for vendors that package audit-ready model governance, OT-safe deployment patterns, and hybrid architectures that keep sensitive process data on-site while still enabling centralized retraining and benchmarking. Rising sustainability and energy reporting requirements also keep energy management and asset-level measurement analytics at the center of buying criteria, which reinforces demand for contextualized time-series platforms and templates that reduce deployment effort in brownfield environments.
In 2026, supplier actions point to continued consolidation and platform build-out around industrial data foundations. Schneider Electric's definitive agreement to acquire Cognite (announced June 2026) highlights competitive focus on industrial data modeling, contextualization, and scalable analytics delivery for multi-site enterprises. NIST's 2026 roadmap on AI and machine learning for smart manufacturing further underlines integration across heterogeneous sensing and control systems, and it reinforces the importance of trustworthy operation. This supports opportunity for providers that combine OT cybersecurity practices with industrial AI toolchains and domain libraries. More broadly, software-defined automation architectures expand the surface area for embedding analytics into control-adjacent layers, extending industrial analytics from centralized platforms to distributed edge runtimes.
Recent Industry Developments in Industrial Analytics Market
- July 2026: Rockwell Automation and Cisco announced a strategic collaboration for Indias manufacturing sector, including a Full-Stack Software-Defined Manufacturing reference design and a demonstration facility at Rockwell Automations Gurugram site. The tie-up links secure networking with industrial automation and analytics patterns, supporting scaled deployment and repeatable architectures for multi-plant rollouts.
- May 2026: Cisco completed its acquisition of Galileo Technologies after announcing the intent to acquire the AI observability and model-quality platform in April 2026. The addition strengthens monitoring, evaluation, and failure detection capabilities that enterprises use to manage industrial AI behavior across cloud and edge environments.
- October 2025: Siemens acquired Altair Engineering for USD 10.6 billion, expanding simulation-to-operations capabilities across the digital twin lifecycle. This strengthens the integration pathway between engineering models and operational analytics, supporting faster model deployment and richer contextualization in industrial environments.


Industrial Analytics Market Report Scope and Research Methodology
Market Definition and Coverage
For this study, the industrial analytics market is defined as software and related services that convert industrial data (from production, assets, and operations systems) into insights that help improve uptime, quality, throughput, safety, and energy use.
Scope exclusions: We exclude basic sensor hardware, PLC and DCS control hardware, and general IT infrastructure that is not sold as part of an industrial analytics solution.
Segments Covered in This Report
- By Deployment
- On-Premises
- Cloud
- By Component
- Software
- Services
- By Analytics Type
- Descriptive Analytics
- Predictive Analytics
- Prescriptive Analytics
- By End-User Industry
- Manufacturing
- Construction
- Mining
- Transportation and Logistics
- Utilities
- Other End-User Industry
- By Organization Size
- Large Enterprises
- Small and Medium-Sized Enterprises
- By Application
- Asset Performance Management
- Quality and Process Optimization
- Supply-Chain and Inventory Analytics
- Energy Management
- Safety and Risk Analytics
- By Geography
- North America
- United States
- Canada
- Mexico
- Europe
- Germany
- United Kingdom
- France
- Russia
- Rest of Europe
- Asia-Pacific
- China
- Japan
- India
- South Korea
- Australia
- Rest of Asia-Pacific
- Middle East and Africa
- Middle East
- Saudi Arabia
- United Arab Emirates
- Rest of Middle East
- Africa
- South Africa
- Egypt
- Rest of Africa
- Middle East
- South America
- Brazil
- Argentina
- Rest of South America
- North America
Data Sources, Market Sizing, and Validation
Desk Research
Desk research was used to understand the demand environment and to set the starting ranges for our model, before assumptions were tested through direct industry feedback. We referred to public sources such as the US Bureau of Labor Statistics, Eurostat, the International Energy Agency, the US Energy Information Administration, and ISO and IEC standards pages that explain commonly tracked operational metrics and reporting needs.
To shape industry adoption patterns, we also reviewed company filings, earnings decks, product documentation, and reputable press coverage that discusses plant digitalization and analytics programs. Where helpful, we used paid subscriptions for company financials and intelligence, news and financials, and patent databases to cross-check solution focus areas and investment direction. These examples are not exhaustive, and many other sources were also used for data collection, validation, and research clarification.
Primary Interviews and Surveys
Primary work focused on confirming what counts as industrial analytics revenue and what should be kept out, especially when solutions sit inside larger automation or software bundles. We spoke with a mix of solution providers, system integrators, industrial end users, and subject matter experts across major regions so assumptions on adoption pace, pricing, and deployment changes could be stress-tested and adjusted.
Distribution of primary research fieldwork respondents
| Company type | Respondent position | Region |
|---|---|---|
| Top tier: 25% | CXOs: 14% | APAC: 42% |
| Mid tier: 61% | Functional/Unit leaders: 35% | EMEA: 37% |
| Smaller Players: 14% | Managers: 51% | Americas: 21% |
Market-Sizing & Forecasting
Sizing was built using a top-down approach where industrial output and digitization indicators are translated into an addressable analytics spending pool, and then filtered using adoption rates by industry and deployment model. The totals were then corroborated with selective bottom-up approximations, such as sampled vendor revenue splits, channel checks with integrators, and ASP ranges applied to typical project volumes, which helped us correct for under or over counting.
Key inputs in the model included manufacturing and process industry production activity, the installed base of connected assets and IIoT data generation, cloud migration pace in industrial software stacks, the share of maintenance budgets shifting toward predictive programs, and average deal sizes for analytics platforms and related services. When a variable was not available consistently across countries, proxy indicators were used and then normalized through expert feedback so regional totals stayed comparable.
For forecasting, scenario analysis was applied around cloud adoption, AI feature penetration in industrial workflows, and capex and opex cycles in major end-user industries. Assumptions were reviewed with interviewees, and the final path was selected when demand signals and practical buying behavior moved in the same direction.
Data Validation & Update Cycle
Outputs were checked against independent signals such as industrial software spending growth, cloud workload trends in enterprises, and publicly discussed analytics rollout programs in asset-heavy sectors. If a region or end-user industry showed a sudden jump that did not match these signals, the drivers were rechecked, and follow-up outreach was triggered to confirm whether the change was real or model-driven.
Before sign-off, the dataset goes through multi-step reviews where assumptions, math, and year-on-year movements are verified by another analyst. The report is refreshed annually, and interim updates are made when material events affect demand or pricing. Right before delivery, a final pass is completed so clients receive the most current view available.
Mordor Intelligence's Industrial Analytics Market Estimate Compared With Other Published Estimates
It is normal to see different market values for industrial analytics because publishers do not always count the same revenue streams and they do not always anchor their models to the same base year. Differences also come from how cloud and on-premises deployments are treated, what is assumed for service attach rates, and how fast pricing changes are allowed to flow into forecasts.
The key gap drivers in this market are usually whether broader industrial software categories are included, whether analytics that is embedded inside automation suites is counted in full, and how the shift from one-time licenses to subscription pricing is handled over time. Another source of variation is refresh timing, where older inputs on plant digitalization and spending cycles can hold back the reported current-year value.
Benchmark comparison
| Source | Market Size | Gaps in Research Methodology |
|---|---|---|
| Mordor Intelligence | USD 44.57 B (2026) | |
| Global Market Compendium A | USD 29.82 B (2024) | Uses an earlier base year and tends to report a narrower revenue capture by excluding some bundled analytics value inside broader industrial software and services, which can reduce the stated total versus later-year estimates. |
| Market Tracker B | USD 23.59 B (2024) | Applies a lower growth path and a smaller addressable pool, which is often linked to conservative adoption assumptions and limited adjustment for subscription pricing expansion over the forecast window. |
The spread in published figures mainly reflects base-year choice, what is counted when analytics is bundled, and how pricing model shifts are carried forward. By tying the demand pool to industrial activity signals and then validating adoption and pricing assumptions through direct checks, the estimate stays traceable to clear inputs, which is the approach used by Mordor Intelligence.


Key Questions Answered in the Report
What is the current size of the industrial analytics market?
It stands at USD 44.57 billion in 2026 and is projected to reach USD 97.38 billion by 2031.
Which deployment model is growing fastest?
Cloud deployments are forecast to expand at a 17.09% CAGR through 2031.
Why are utilities investing heavily in analytics?
Integrating intermittent renewables demands real-time load balancing, driving an 18.23% CAGR for analytics adoption in the sector.
How do low-code platforms help manufacturers?
They cut analytics application deployment time by 60%, letting process engineers build models without coding expertise.
What is the biggest restraint on market growth?
Data-sovereignty regulation forces regional data silos, increasing infrastructure costs and complicating global rollouts.
Which application segment offers the fastest growth?
Energy-management analytics, advancing at a 17.89% CAGR, leads due to carbon-pricing and volatile electricity costs.
Page last updated on:


 Your data is secure and never sold or shared.


