Market Overview
| Study Period | 2020 - 2031 |
|---|---|
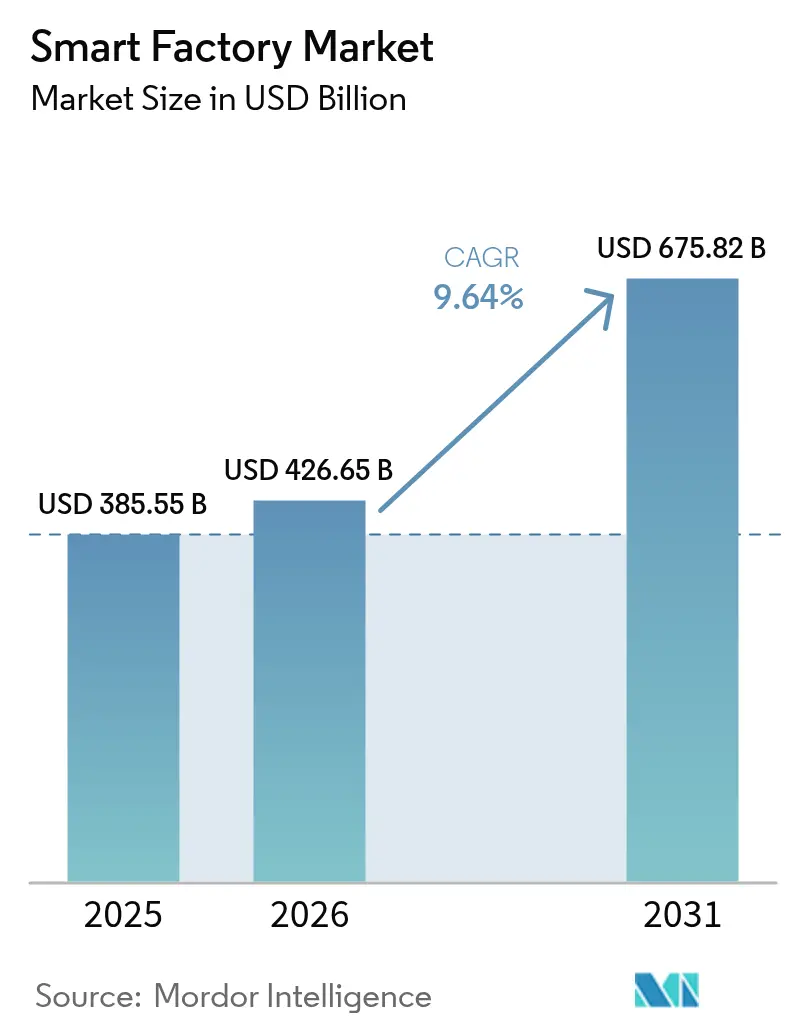
| Market Size (2026) | USD 426.65 Billion |
| Market Size (2031) | USD 675.82 Billion |
| Growth Rate (2026 - 2031) | 9.64% CAGR |
| Fastest Growing Market | Middle East |
| Largest Market | Asia-Pacific |
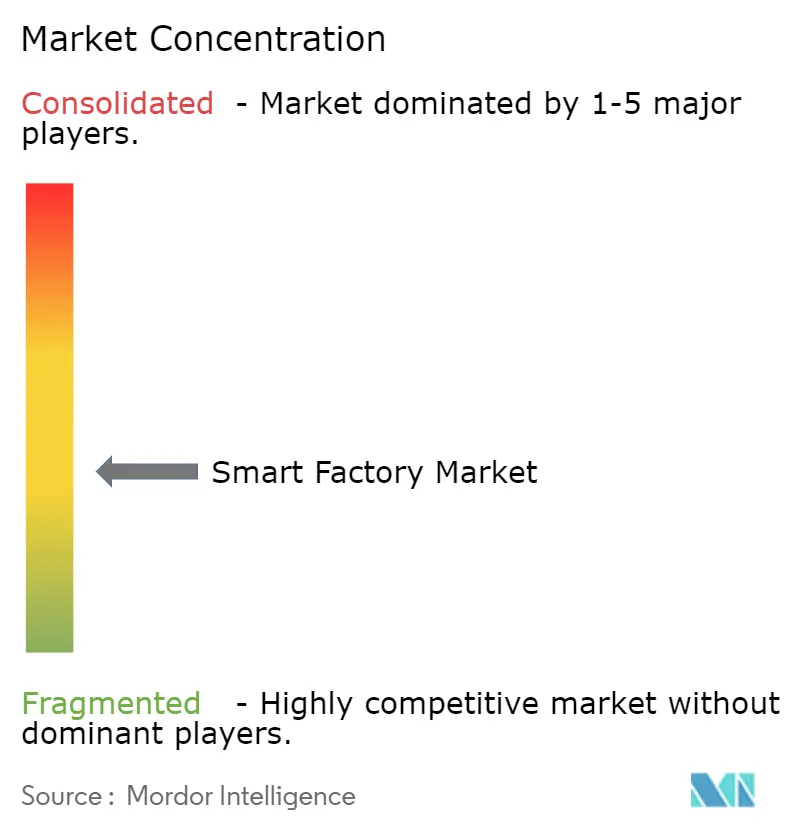
| Market Concentration | Medium |
Major Players *Disclaimer: Major Players sorted in no particular order Image © Mordor Intelligence. Reuse requires attribution under CC BY 4.0. | |
Smart Factory Market Analysis by Mordor Intelligence
The smart factory market size was valued at USD 385.55 billion in 2025 and estimated to grow from USD 426.66 billion in 2026 to reach USD 675.82 billion by 2031, at a CAGR of 9.64% during the forecast period 2026-2031. Rising Industrial Internet of Things adoption is knitting once-isolated machines into unified data fabrics, accelerating predictive maintenance and shortening payback cycles. Government incentives in Asia-Pacific and the Middle East are lowering capital risk, while carbon-border tariffs in Europe compel factories to document energy efficiency, pushing analytics investments. Edge artificial intelligence chips now deliver millisecond inference at the line, shifting quality-control logic from cloud to floor. Intensifying competitive activity is evident as automation incumbents acquire software start-ups to broaden portfolios, while open-source digital twins reduce integration cost for mid-tier manufacturers.
Key Report Takeaways
- By product type, industrial robotics led with 28.41% revenue share in 2025, whereas collaborative robots are advancing at a 10.27% CAGR through 2031.
- By technology, manufacturing execution systems captured 24.18% of spending in 2025, while advanced analytics and artificial intelligence platforms are expanding at a 10.31% CAGR to 2031.
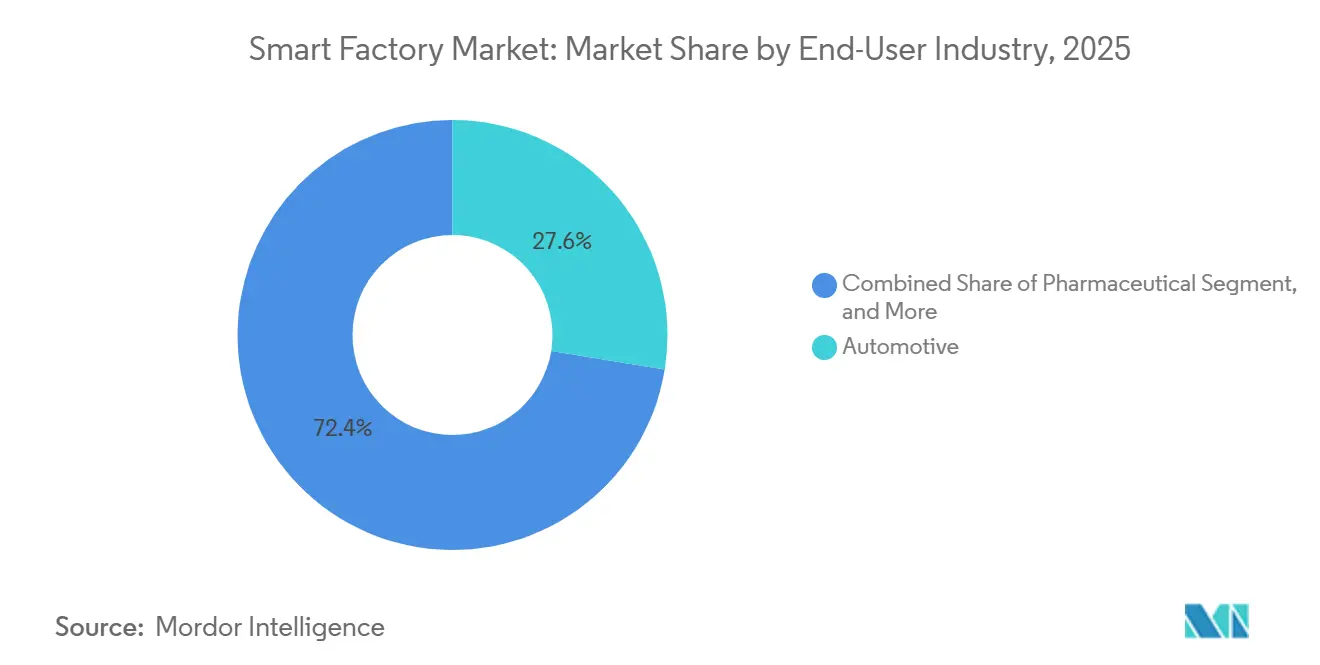
- By end-user industry, automotive accounted for 27.56% demand in 2025, yet pharmaceuticals represent the fastest trajectory with a 9.91% CAGR over 2026-2031.
- By deployment model, on-premises architectures retained 61.40% share in 2025, but cloud-based models are progressing at a 9.81% CAGR through 2031.
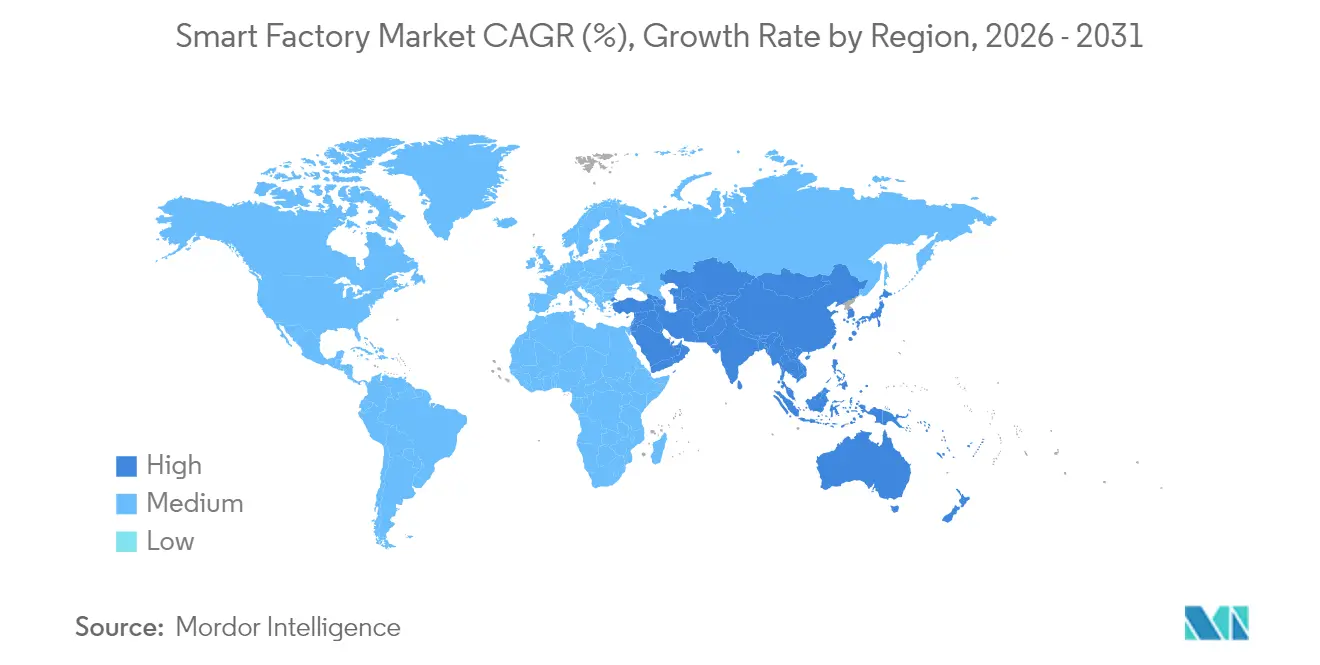
- By geography, Asia-Pacific commanded 43.19% of 2025 revenue, whereas the Middle East is projected to grow at a 9.96% CAGR to 2031.
Note: Market size and forecast figures in this report are generated using Mordor Intelligence’s proprietary estimation framework, updated with the latest available data and insights as of 2026.
Global Smart Factory Market Trends and Insights
Drivers Impact Analysis*
| Driver | (~) % Impact on CAGR Forecast | Geographic Relevance | Impact Timeline |
|---|---|---|---|
| Growing Adoption of Industrial IoT Platforms | +2.10% | Global, with concentration in Asia-Pacific and Europe | Medium term (2-4 years) |
| Demand for End-to-End Energy Optimisation | +1.80% | Europe and North America, spillover to Asia-Pacific | Medium term (2-4 years) |
| Rising Government Incentives for Smart Manufacturing | +1.50% | Asia-Pacific, Middle East, selective North America | Short term (≤ 2 years) |
| Edge AI Chips Enabling Real-Time Quality Control | +1.30% | Global, early adoption in semiconductors and automotive | Medium term (2-4 years) |
| Open-Source Digital Twins Lowering Integration Cost | +0.90% | Global, strongest uptake in Europe and North America | Long term (≥ 4 years) |
| Quantum-Safe Encryption Boosting OEM Trust | +0.60% | North America and Europe, pilot phase in Asia-Pacific | Long term (≥ 4 years) |
| Source: Mordor Intelligence | |||
Growing Adoption of Industrial IoT Platforms
Industrial Internet of Things platforms are consolidating data from programmable logic controllers, supervisory systems, and enterprise resource planning layers into single repositories. Siemens connected more than 1.2 million assets on its MindSphere cloud in 2025, a 40% jump from 2024.[1]Siemens AG, “Annual Report 2025,” siemens.com Edge gateways running OPC Unified Architecture over time-sensitive networking now handle sub-millisecond latency, so predictive algorithms can trim unplanned downtime by 25-35%.[2]McKinsey and Company, “Discrete Manufacturing Analysis 2025,” mckinsey.com Subscription pricing also converts capital outlay into operating expense, widening access among small manufacturers. The result is an installed base ready for artificial intelligence, digital twins, and autonomous workflows.
Demand for End-to-End Energy Optimisation
Energy accounts for 15-25% of manufacturing cost in chemicals, metals, and food processing. The European Union’s Carbon Border Adjustment Mechanism, effective January 2026, taxes carbon-intensive imports, driving exporters to document kilowatt-hour consumption.[3]European Commission, “Carbon Border Adjustment Mechanism,” ec.europa.eu Rockwell Automation pilots cut electricity use by 18% at a Brazilian pulp mill during 2025.[4]Rockwell Automation, “Q4 2025 Earnings Call Transcript,” rockwellautomation.com Machine-level sensors feed analytics engines that reschedule production to exploit off-peak tariffs and renewable availability. Closed-loop links between energy modules and manufacturing execution systems help firms meet decarbonization targets while protecting margins.
Restraints Impact Analysis*
| Restraint | (~) % Impact on CAGR Forecast | Geographic Relevance | Impact Timeline |
|---|---|---|---|
| High Upfront CAPEX for Brownfield Transformation | -1.40% | Global, acute in North America and Europe legacy sites | Short term (≤ 2 years) |
| Cybersecurity Vulnerabilities within OT Networks | -1.10% | Global, heightened in critical infrastructure sectors | Medium term (2-4 years) |
| Shortage of Interoperable OT-IT Talent | -0.80% | North America, Europe, emerging in Asia-Pacific | Medium term (2-4 years) |
| Volatile Rare-Earth Supply for Robotics Actuators | -0.60% | Global, supply concentrated in China | Long term (≥ 4 years) |
| Regulatory Uncertainty Around Industrial Data Sovereignty | -0.50% | Europe, China, selective enforcement in other regions | Long term (≥ 4 years) |
| Source: Mordor Intelligence | |||
Rising Government Incentives for Smart Manufacturing
Fiscal programs from Beijing to Riyadh offset automation risk. China earmarked CNY 200 billion (USD 28 billion) for intelligent manufacturing upgrades during 2024-2026. Saudi Arabia’s Vision 2030 set aside SAR 15 billion (USD 4 billion) in 2025 for petrochemical and mining facilities, and India’s Production Linked Incentive scheme extends 6-8% rebates on automation equipment. Accelerated depreciation rules in the United States and Germany shorten payback periods for small and medium enterprises, lifting adoption rates in otherwise capital-constrained segments.
Edge AI Chips Enabling Real-Time Quality Control
Intel’s 4th-generation Xeon processors integrate inference accelerators that execute vision models directly on factory servers. Cognex deep-learning systems halved semiconductor false-reject rates in 2025. Federated learning prevents sensitive process data from leaving premises, aiding pharmaceutical compliance. Falling cost per inference now makes sub-millimetre defect detection viable for high-volume producers, compressing scrap rates and warranty claims.
*Our forecasts treat driver/restraint impacts as directional, not additive. The impact forecasts reflect baseline growth, mix effects, and variable interactions.
Segment Analysis
By Product Type: Collaborative Robots Reshape Human-Machine Boundaries
Industrial robotics captured 28.41% of 2025 revenue, giving it the largest smart factory market share among product categories. Cobots, however, are expanding at 10.27% CAGR and are projected to capture a growing slice of the smart factory market size through 2031 as automotive and pharmaceutical lines favour flexible, uncaged automation. Universal Robots reported 35% year-over-year cobot growth in small and medium enterprises during 2025.
Across complementary devices, control components deliver precise actuation, and multi-modal sensors create real-time data streams for conditional monitoring. Wired protocols such as EtherCAT dominate deterministic motion, while 5G supports mobile platforms and retrofit scenarios. Hardware, software, and integration services are converging into full-stack offerings that extend lifecycle value.


By Technology: AI Platforms Overtake Legacy SCADA in Growth
Manufacturing execution systems accounted for 24.18% of 2025 spending, but advanced analytics and artificial intelligence platforms are growing at a 10.31% CAGR, indicating a rapid reallocation of the smart factory market size toward prescriptive software. SAP’s Digital Manufacturing Cloud added more than 800 customers in 2025.
Distributed control systems and programmable logic controllers remain indispensable for real-time loops, yet edge controllers that host containerized applications enable hybrid workloads. Augmented-reality interfaces reduce mean-time-to-repair, and digital twin simulators cut commissioning timelines. Open application programming interfaces dictate how quickly new modules can be deployed, shaping competitiveness.
By End-User Industry: Pharmaceutical Automation Accelerates Post-Pandemic
Automotive led demand with 27.56% of 2025 revenue, reflecting battery gigafactories and precision welding lines that rely on robotics. Pharmaceuticals, however, are projected to grow at 9.91% CAGR as continuous manufacturing and personalized medicine require validated automation, marking the fastest rise within the smart factory market.
Semiconductor fabs feature near-total robotic handling, while oil and gas sites instrument remote wells for predictive maintenance. Food and beverage processors integrate vision systems for label verification, and mining firms deploy autonomous haulage. Each vertical carries unique compliance and safety demands that shape solution design and service revenue.
By Deployment Model: Hybrid Architectures Bridge On-Premises and Cloud
On-premises solutions retained 61.40% of the 2025 smart factory market share due to latency and sovereignty concerns, yet cloud architectures trail only slightly in momentum, expanding at 9.81% CAGR. Hybrid patterns partition deterministic control to the edge while delegating analytics to elastic clouds, reducing the total cost of ownership.
Private 5G networks blend on-site latency with cloud scalability, and edge frameworks such as Azure IoT Edge synchronize data during off-peak hours. Concerns around connectivity and provider lock-in persist, but rising availability of hardened gateways and multicloud orchestration is easing adoption.
Geography Analysis
Asia-Pacific contributed 43.19% of 2025 revenue, making it the largest regional block within the smart factory market. China’s Made in China 2025 subsidies, Japan’s Society 5.0 cobot incentives, and South Korea’s display and semiconductor grants collectively amplify spending. India’s Production Linked Incentive schemes add momentum in electronics and pharmaceuticals. Australia and New Zealand apply Industrial Internet of Things networks to remote mining, highlighting the region’s breadth.
North America combines brownfield retrofits with greenfield electric vehicle and battery investments. The United States CHIPS and Science Act directs USD 52 billion into semiconductor automation, and Mexico emerges as a nearshoring magnet for automotive and aerospace suppliers. Canada co-funds aerospace and mining projects that emphasize emissions reduction, underscoring a sustainability tilt.
Europe invests in Industry 4.0 interoperability. Germany’s Plattform Industrie 4.0 published open standards in 2025, accelerating vendor integration. The United Kingdom and France target pharmaceutical and aerospace lines, while Italy and Spain revitalize food processing plants. The Middle East, though smaller, is the fastest-growing region at 9.96% CAGR, underpinned by Saudi Vision 2030 and United Arab Emirates free-zone incentives. South America and Africa trail but showcase focused deployments in automotive, pulp, and mining.

Competitive Landscape
The top 10 vendors held roughly 45% of smart factory revenue in 2025, indicating moderate concentration. Siemens, ABB, and Schneider Electric leverage large programmable logic controller bases to cross-sell digital twins and analytics, reinforcing lock-in. Rockwell Automation and Honeywell emphasize process expertise, differentiating through vertical templates. Japanese firms such as Fanuc, Mitsubishi Electric, and Keyence dominate robotics and sensing across Asian electronics clusters.
Machine-vision leaders Cognex and Teledyne FLIR embed deep learning for defect detection, elevating value beyond hardware. Cloud hyperscalers partner with automation brands to inject Platform-as-a-Service economics, while open-source initiatives like Eclipse Ditto gain traction and dilute proprietary margins. Cybersecurity specialists collaborate with control vendors to harden operational technology layers, meeting insurer mandates for segmentation and zero-trust architectures.
Market entry barriers remain high due to certification, safety, and lifecycle support requirements, yet software-defined automation threatens entrenched hardware. Vendors now bundle subscription pricing, remote services, and outcome guarantees, turning capital hardware sales into recurring revenue streams. The race centers on who best orchestrates data across the lifecycle, from design through operations.
Smart Factory Industry Leaders
ABB Ltd
Cognex Corporation
Siemens AG
Schneider Electric SE
Yokogawa Electric Corporation
- *Disclaimer: Major Players sorted in no particular order

Recent Industry Developments
- April 2025: Blackbird (Factbird) raised DKK 35 million to expand its plug-and-play sensor platform globally, bringing real-time productivity analytics to small manufacturers.
- March 2025: Mercedes-Benz rolled out the MO360 digital production ecosystem across more than 30 plants, standardizing AI-based quality analytics, logistics automation, and connected maintenance.
- February 2025: Schneider Electric released SCADAPack firmware with role-based access control, unifying IT and OT security practices for critical infrastructure.
- December 2024: Siemens closed its USD 10.6 billion Altair acquisition, adding advanced simulation to the Xcelerator portfolio.


Global Smart Factory Market Report Scope
The Smart Factory Market Report is Segmented by Product Type (Machine Vision Systems, Industrial Robotics, Control Devices, Sensors, Communication Technologies, Other Product Types), Technology (PLM, HMI, ERP, MES, DCS, SCADA, PLC, Advanced Analytics and AI Platforms, Other Technologies), End-User Industry (Automotive, Semiconductors, Oil and Gas, Chemical and Petrochemical, Pharmaceutical, Aerospace and Defense, Food and Beverage, Mining, Other End-User Industries), Deployment Model (On-Premise, Cloud-based), and Geography (North America, South America, Europe, Asia-Pacific, Middle East, Africa). The Market Forecasts are Provided in Terms of Value (USD).
By Product Type
| Machine Vision Systems | Cameras |
| Processors | |
| Software | |
| Enclosures | |
| Frame Grabbers | |
| Integration Services | |
| Lighting | |
| Industrial Robotics | Articulated Robots |
| Cartesian Robots | |
| Cylindrical Robots | |
| SCARA Robots | |
| Parallel Robots | |
| Collaborative Industry Robots | |
| Control Devices | Relays and Switches |
| Servo Motors and Drives | |
| Sensors | |
| Communication Technologies | Wired |
| Wireless | |
| Other Product Types |
By Technology
| Product Lifecycle Management (PLM) |
| Human Machine Interface (HMI) |
| Enterprise Resource Planning (ERP) |
| Manufacturing Execution System (MES) |
| Distributed Control System (DCS) |
| Supervisory Control and Data Acquisition (SCADA) |
| Programmable Logic Controller (PLC) |
| Advanced Analytics and AI Platforms |
| Other Technologies |
By End-User Industry
| Automotive |
| Semiconductors |
| Oil and Gas |
| Chemical and Petrochemical |
| Pharmaceutical |
| Aerospace and Defense |
| Food and Beverage |
| Mining |
| Other End-User Industries |
By Deployment Model
| On-Premise |
| Cloud-based |
By Geography
| North America | United States |
| Canada | |
| Mexico | |
| South America | Brazil |
| Argentina | |
| Rest of South America | |
| Europe | Germany |
| United Kingdom | |
| France | |
| Italy | |
| Rest of Europe | |
| Asia-Pacific | China |
| Japan | |
| India | |
| South Korea | |
| Australia and New Zealand | |
| Rest of Asia-Pacific | |
| Middle East | Saudi Arabia |
| United Arab Emirates | |
| Turkey | |
| Rest of Middle East | |
| Africa | South Africa |
| Nigeria | |
| Kenya | |
| Rest of Africa |
| By Product Type | Machine Vision Systems | Cameras |
| Processors | ||
| Software | ||
| Enclosures | ||
| Frame Grabbers | ||
| Integration Services | ||
| Lighting | ||
| Industrial Robotics | Articulated Robots | |
| Cartesian Robots | ||
| Cylindrical Robots | ||
| SCARA Robots | ||
| Parallel Robots | ||
| Collaborative Industry Robots | ||
| Control Devices | Relays and Switches | |
| Servo Motors and Drives | ||
| Sensors | ||
| Communication Technologies | Wired | |
| Wireless | ||
| Other Product Types | ||
| By Technology | Product Lifecycle Management (PLM) | |
| Human Machine Interface (HMI) | ||
| Enterprise Resource Planning (ERP) | ||
| Manufacturing Execution System (MES) | ||
| Distributed Control System (DCS) | ||
| Supervisory Control and Data Acquisition (SCADA) | ||
| Programmable Logic Controller (PLC) | ||
| Advanced Analytics and AI Platforms | ||
| Other Technologies | ||
| By End-User Industry | Automotive | |
| Semiconductors | ||
| Oil and Gas | ||
| Chemical and Petrochemical | ||
| Pharmaceutical | ||
| Aerospace and Defense | ||
| Food and Beverage | ||
| Mining | ||
| Other End-User Industries | ||
| By Deployment Model | On-Premise | |
| Cloud-based | ||
| By Geography | North America | United States |
| Canada | ||
| Mexico | ||
| South America | Brazil | |
| Argentina | ||
| Rest of South America | ||
| Europe | Germany | |
| United Kingdom | ||
| France | ||
| Italy | ||
| Rest of Europe | ||
| Asia-Pacific | China | |
| Japan | ||
| India | ||
| South Korea | ||
| Australia and New Zealand | ||
| Rest of Asia-Pacific | ||
| Middle East | Saudi Arabia | |
| United Arab Emirates | ||
| Turkey | ||
| Rest of Middle East | ||
| Africa | South Africa | |
| Nigeria | ||
| Kenya | ||
| Rest of Africa | ||


Key Questions Answered in the Report
How big is the global smart factory market today?
The smart factory market size stood at USD 426.66 billion in 2026.
What is the expected CAGR for smart factory investments to 2031?
Spending is projected to advance at a 9.64% CAGR between 2026 and 2031.
Which product type dominates current revenue?
Industrial robotics led with 28.41% of 2025 revenue.
Which region grows the fastest through 2031?
The Middle East shows the quickest expansion at a 9.96% CAGR.
Why are collaborative robots gaining traction?
Cobots enable flexible automation without safety cages, delivering sub-18-month paybacks for small manufacturers.
What is the key barrier to brownfield deployments?
High upfront capital expenditure extends payback to as long as seven years in legacy plants.
Page last updated on:


