Restaurant Management Software Market Size and Share
Market Overview
| Study Period | 2020 - 2031 |
|---|---|
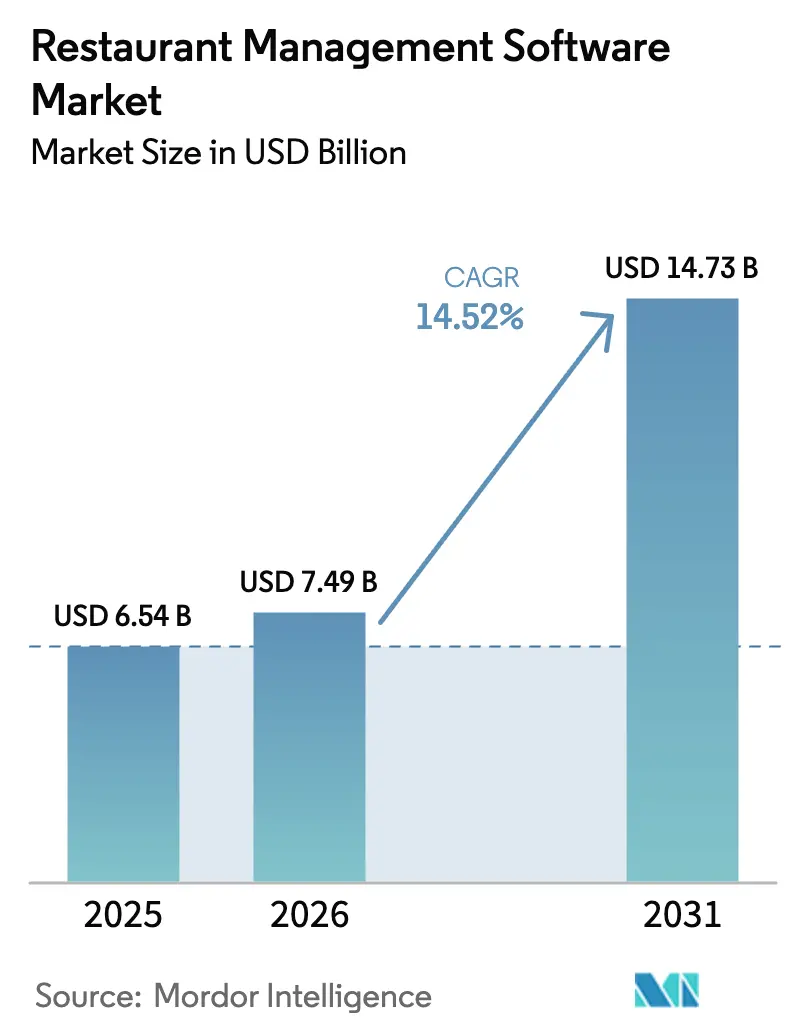
| Market Size (2026) | USD 7.49 Billion |
| Market Size (2031) | USD 14.73 Billion |
| Growth Rate (2026 - 2031) | 14.52% CAGR |
| Fastest Growing Market | Asia Pacific |
| Largest Market | Asia Pacific |
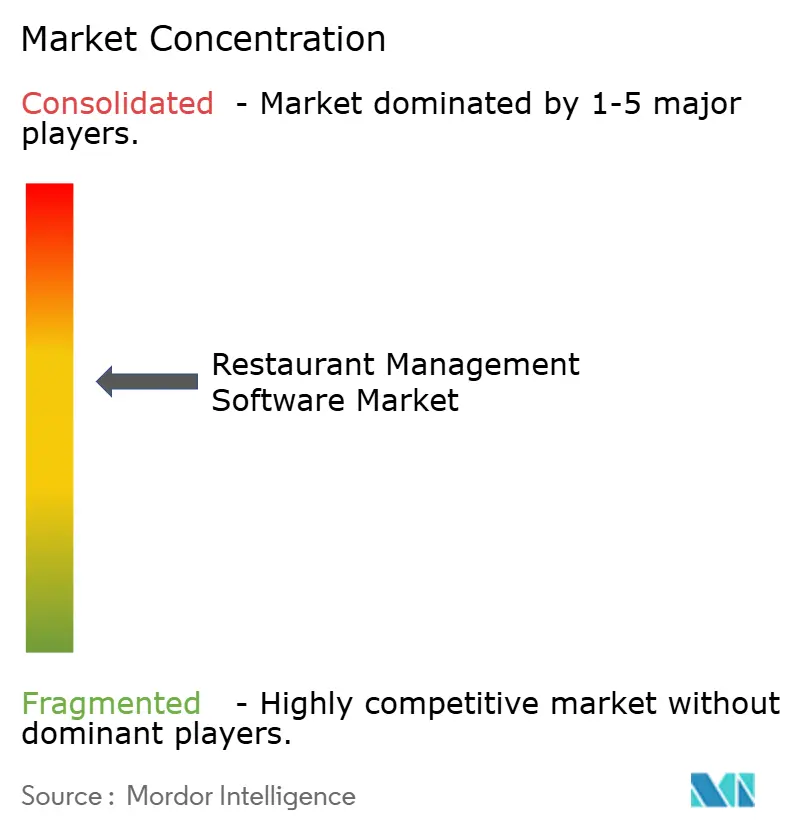
| Market Concentration | Medium |
Major Players *Disclaimer: Major Players sorted in no particular order Image © Mordor Intelligence. Reuse requires attribution under CC BY 4.0. | |
Restaurant Management Software Market Analysis by Mordor Intelligence
The restaurant management software market size was valued at USD 6.54 billion in 2025 and estimated to grow from USD 7.49 billion in 2026 to reach USD 14.73 billion by 2031, at a CAGR of 14.52% during the forecast period (2026-2031). Heightened demand for cloud-first infrastructure, rapid omnichannel ordering growth, and rising labor-cost pressures all accelerated adoption. Vendors broadened front-end and back-office functionality through open-API ecosystems, allowing operators to compose tailored tech stacks without large upfront investments. At the same time, analytics modules moved from optional add-ons to core purchase criteria as restaurants sought predictive insights to protect margin in a cost-inflation environment. Competitive intensity sharpened around delivery-integration depth, workflow-automation breadth, and data-security assurances, especially for enterprise chains running multi-brand portfolios. Strategic partnerships among POS, payments, and last-mile logistics firms created additional market-entry paths for best-of-breed specialists.
Key Report Takeaways
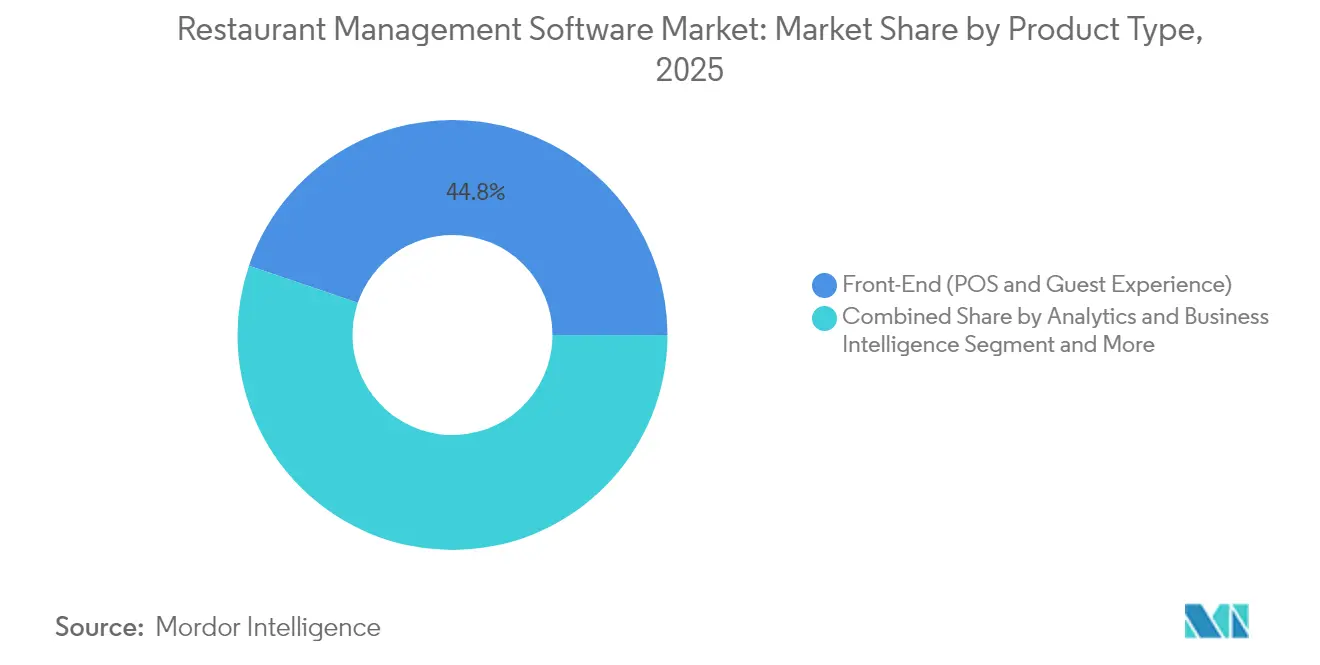
- By product category, front-end POS and guest-experience solutions led with a 44.78% revenue share in 2025, while analytics and business intelligence is projected to expand at a 17.25% CAGR through 2031.
- By deployment model, cloud captured 60.87% of the restaurant management software market share in 2025 and continues to grow at 14.94% CAGR to 2031.
- By restaurant format, quick-service restaurants held 37.86% share of the restaurant management software market size in 2025, whereas cloud kitchens and virtual brands are on track for an 18.58% CAGR over the same horizon.
- By end-user size, enterprise chains with 100+ locations accounted for 39.92% of 2025 revenue, yet small chains with 2-20 sites show the fastest 15.78% CAGR through 2031.
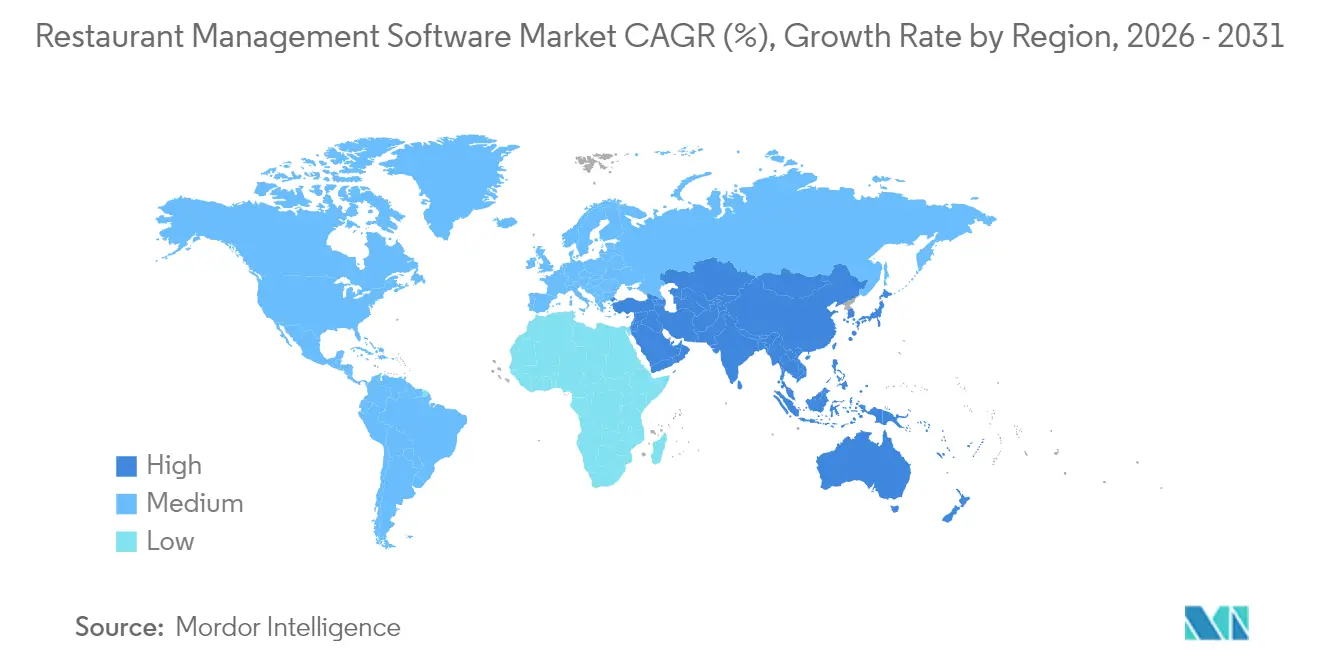
- By geography, Asia-Pacific commanded 42.12% share in 2025 and is set to post a 16.24% CAGR to 2031, well ahead of North America’s mature expansion pace.
Note: Market size and forecast figures in this report are generated using Mordor Intelligence’s proprietary estimation framework, updated with the latest available data and insights as of 2026.
Global Restaurant Management Software Market Trends and Insights
Drivers Impact Analysis*
| Driver | (~) % Impact on CAGR Forecast | Geographic Relevance | Impact Timeline |
|---|---|---|---|
| Proliferation of QSR and fast-casual chains | +3.7% | Global, with APAC and Latin America leading | Medium term (2-4 years) |
| Rapid adoption of cloud-based SaaS pricing models | +2.9% | Global, accelerated in North America and Europe | Short term (≤ 2 years) |
| Surge in omnichannel ordering and delivery integrations | +2.7% | Global, with urban markets prioritized | Short term (≤ 2 years) |
| Rising labor costs driving workflow automation | + 2.2% | North America and Europe core, expanding to APAC | Medium term (2-4 years) |
| Compliance-driven real-time food traceability (FSMA 204) | +1.8% | United States, with spillover to export-focused operators | Long term (≥ 4 years) |
| Open-API ecosystems enabling composable tech stacks | + 1.5% | Global, with technology-forward markets leading | Long term (≥ 4 years) |
| Source: Mordor Intelligence | |||
Proliferation of QSR and fast-casual chains
Franchise operators continued to add units across emerging and developed economies, standardizing technology stacks to ensure uniform guest experiences and compliance. Toast alone added 8,000 new QSR outlets in Q2 2024, each requiring a full cloud POS roll-out.[1]Toast, “Toast Announces Second Quarter 2024 Financial Results,” toasttab.com Franchise agreements often mandate centrally managed menus and pricing, creating recurring revenue streams for vendors. Cloud-hosted deployments removed capex barriers for franchisees, accelerating the restaurant management software market adoption timeline. International QSR operators followed the same playbook, multiplying demand for multilingual interfaces and tax-compliant fiscal printers in APAC and Latin America.
Rapid adoption of cloud-based SaaS pricing models
Subscription pricing converted one-time license investments into manageable monthly fees that match restaurant cash-flow cycles. MenuSifu highlighted how operators can push instant menu updates and promotions to every site from a single portal, avoiding on-premise patching delays. Reduced upgrade risk, automatic compliance features, and pay-as-you-grow seat licensing opened the restaurant management software market to single-site independents and small chains. Providers benefit from predictable revenue and higher lifetime value, leading to intensified competition around churn-reduction features such as embedded analytics and loyalty tools.
Surge in omnichannel ordering and delivery integrations
Delivery, take-out, and kiosk sales reached nearly half of total restaurant transactions, pressuring operators to synchronize inventory, pricing, and guest data in real time. Unified order-management layers mediated traffic from direct websites, mobile apps, and third-party aggregators, preventing menu mismatches that drive customer churn. Vendors with open APIs gained competitive advantage as restaurants sought to avoid juggling multiple one-off middleware contracts. The shift cemented delivery-partner certification as a key buying criterion in the restaurant management software market.
Rising labor costs driving workflow automation
Restaurant staff replacement costs climbed to USD 1,056 for front-of-house and USD 1,491 for back-of-house positions in 2025. Operators turned to AI-assisted scheduling, digital prep-lists, and self-ordering kiosks to stretch labor budgets. Providers integrated kitchen display systems with task timers and voice alerts, cutting ticket-routing errors. Back-office modules now auto-reconcile invoices and flag cost variances, freeing managers for customer-facing duties and reinforcing the momentum behind the restaurant management software market.
Restraints Impact Analysis*
| Restraint | (~) % Impact on CAGR Forecast | Geographic Relevance | Impact Timeline |
|---|---|---|---|
| Shortage of skilled implementation talent | -1.2% | Global, acute in specialized markets | Medium term (2-4 years) |
| High migration cost from legacy systems | -0.9% | North America and Europe, established operators | Short term (≤ 2 years) |
| Escalating cybersecurity/ransomware incidents | -0.7% | Global, with high-profile targets prioritized | Short term (≤ 2 years) |
| Fragmented fiscal-compliance mandates by region | -0.6% | Global, varying by regulatory complexity | Long term (≥ 4 years) |
| Source: Mordor Intelligence | |||
Shortage of skilledimplementation talent
Demand for certified POS integrators outpaced supply, delaying enterprise deployments and inflating total cost of ownership. Vendors invested in auto-provisioning scripts and low-code connectors to reduce reliance on scarce personnel. Certification programs and partner marketplaces became differentiators, although talent gaps persisted in regions with rapid restaurant management software market expansion.
High migration cost from legacy systems
Full-service operators with complex menus hesitated to replace aging on-premise servers because data conversion, staff retraining, and downtime risk can exceed USD 100,000 per group roll-out. Vendors answered with dual-run capabilities that mirror data between old and new stacks until cut-over. Even so, reluctance among established chains tempers the short-term penetration pace of the restaurant management software market.
*Our forecasts treat driver/restraint impacts as directional, not additive. The impact forecasts reflect baseline growth, mix effects, and variable interactions.
Segment Analysis
By Product Type: Analytics Drives Next-Generation Restaurant Intelligence
The analytics and business-intelligence suite recorded the fastest 17.25% CAGR to 2031, although front-end POS and guest-experience modules retained a 44.78% share in 2025. The restaurant management software market size for analytics solutions is projected to increase from USD 1.42 billion in 2025 to USD 3.68 billion by 2031, representing nearly a quarter of new spending. Operators are increasingly relying on predictive dashboards that link item-level sales to labor schedules and procurement orders, resulting in low single-digit reductions in waste rates. Vendors consolidated point solutions into integrated platforms, allowing kitchen-display data to feed machine-learning demand models without middleware fees.
Integrated back-end operations tools, inventory, procurement, and supplier portals grew steadily as restaurants faced commodity price volatility. Workforce-management and payroll add-ons moved into the core bundle because automated scheduling reduced overtime costs by double digits. Lightspeed Commerce expanded its payroll connector set in 2024, letting operators process compliance-ready payslips without exporting CSV files. The convergence trend positions analytics as the nerve center orchestrating data flows among modules, creating cross-sell lift that amplifies overall restaurant management software market revenue.


By Deployment Model: Cloud Infrastructure Dominates Market Evolution
Cloud solutions accounted for 60.87% revenue in 2025 and are growing 14.94% CAGR, far outpacing hybrid and on-premise stacks. The restaurant management software market share gap widened as multi-location operators prioritized anytime-anywhere access for menu updates and promotions. POS firmware patches now deploy overnight with zero downtime, eliminating costly store-by-store site visits. Comcast Business underscored how cloud POS can reroute orders to alternate kitchens during network outages, safeguarding revenue even during localized disruptions.
Hybrid models persist where offline redundancy and local fiscal printers are mandatory, particularly in markets that enforce real-time tax receipt uploads. On-premise holdouts typically include high-volume entertainment venues with proprietary kiosk networks. However, even those operators adopted cloud-hosted reporting dashboards that pull encrypted sales snapshots overnight. Consequently, the restaurant management software market migration curve remains asymmetric, with pure-cloud adoption surging in new builds while retrofit cycles advance gradually.
By Restaurant Format: Cloud Kitchens Reshape Technology Requirements
Cloud kitchens and virtual brands registered an 18.58% CAGR, driven by delivery-first economics. These formats require multi-brand order routing, auto-fire production queues, and courier pick-up tracking, capabilities that legacy dine-in POS rarely support. Providers responded with composable modules that spin up brand-specific virtual menus in minutes. Quick-service restaurants still dominated 37.86% of 2025 spending thanks to high transaction throughput, yet they, too, embedded delivery orchestration layers to unify dine-in, drive-thru, and third-party channels. The restaurant management software market size for cloud-kitchen-specific suites is likely to triple by 2031, helped by franchise aggregators that sublease kitchen pods to multiple creators.
Full-service outlets integrated reservation, wait-list, and payment-at-table apps to lift seat turns. Catering operators demanded batch-production planning and event billing links, whereas bars and nightclubs leaned on age-verification prompts and keg-level inventory meters. 365 Retail Markets launched a kitchen-management module in 2025 aimed at high-volume commissaries, reflecting vertical-specific product roadmaps.
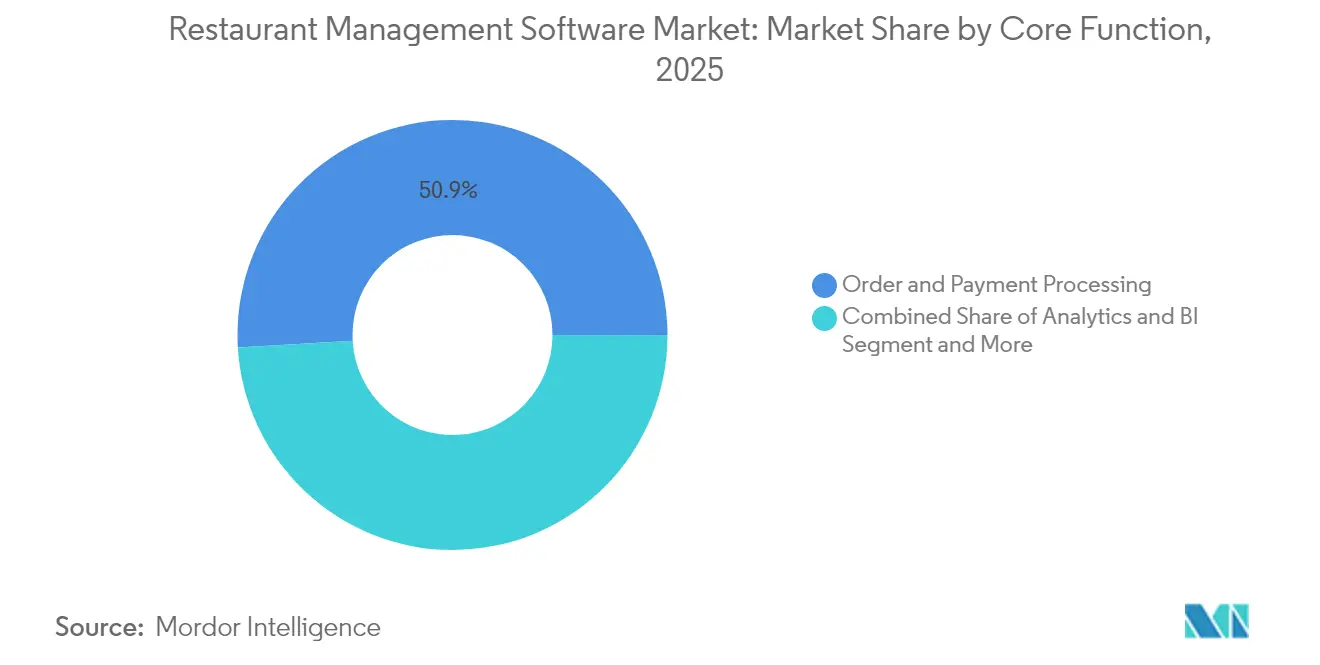
By Core Function: Order Processing Dominance Faces Analytics Challenge
Order and payment processing retained a 50.92% slice of 2025 revenue, making it the entry ticket to any serious vendor evaluation. Nonetheless, cross-module upsell momentum rested with business-intelligence dashboards, mirroring operators’ need for actionable data. Inventory and supply-chain tools intertwined with recipe-level food-cost monitors, generating auto-reorder triggers that shave waste. CRM and loyalty engines captured guest preferences regardless of channel, informing AI-driven promotions. Toast bundled a digital storefront and marketing suite in 2025, letting independents run email journeys and SMS campaigns without outside agencies. As a result, the center of gravity within the restaurant management software market moved from transactional efficiency to lifetime-value optimization.
By End-User Size: Small Chains Drive Technology Democratization
Enterprise groups with more than 100 sites still generated 39.92% of revenue during 2025, yet adoption growth was strongest among 2-20-site chains. SaaS billing let smaller operators access enterprise-grade analytics for double-digit monthly fees instead of six-figure capex. Block Inc. pointed to a 13% uplift in food-and-beverage payment volume in Q4 2024, attributing gains partly to smaller chains upgrading to cloud POS. The restaurant management software market size expansion within this tier signals democratization: what once required dedicated IT staff now spins up via browser wizards in under an hour.
Mid-size groups scaled cross-border, pushing vendors for multilanguage receipts and tax jurisdictions in a single tenant. Single-site independents bought stripped-down bundles that embed card processing, payroll, and basic loyalty. Providers targeting the long-tail tier focused on templated onboarding flows, AI chat support, and marketplace plug-ins for bookkeeping and delivery. Consequently, lifetime-value curves began to flatten between size classes as churn-mitigation features matured.
Geography Analysis
Asia-Pacific led the restaurant management software market with a 42.12% share in 2025, propelled by QSR franchising booms in China, India, and Southeast Asia. The region’s 16.24% CAGR arises from mobile-first consumer behavior, government cashless-payment incentives, and a greenfield technology baseline that favors leapfrog cloud adoption. Domestic aggregators such as Meituan and Zomato demanded deep API hooks, pushing vendors to localize order-capture flows. Japan and South Korea served as early adopters of robotic food runners and kitchen automation, often piloting features that later scaled region-wide.
North America held a significant but mature stake, concentrating spend on analytics, automation, and FSMA-204 traceability modules. The United States mandated end-to-end ingredient provenance, nudging operators toward platforms with built-in lot tracking and recall workflows. Canadian chains embraced bilingual receipt printing and interprovincial sales-tax engines, while Mexican franchisees, such as Corporativo GES operating Burger King, moved to Oracle’s cloud POS in early 2025 to streamline audits.
Europe posted steady gains despite regulatory fragmentation. Germany and the United Kingdom led cloud transition counts, helped by real-time VAT reporting connectors. Southern markets emphasized integrated QR pay-at-table to cope with tight wage laws. Eastern European chains adopted full-suite cloud stacks during greenfield expansions, bypassing legacy server rooms. GDPR compliance remained a gating criterion, compelling vendors to offer regional hosting options inside the European Economic Area. Together, these dynamics reinforce globally diverse yet converging demand across the restaurant management software market.

Competitive Landscape
The market displayed moderate fragmentation. Toast secured strong positioning among fast-casual and QSR operators through easy-to-use cloud dashboards and a vibrant partner marketplace, while Oracle and NCR retained footholds in enterprise table-service chains requiring global support contracts. NCR Voyix was recognized as a segment leader in IDC assessments during 2025, highlighting momentum in hospitality omnichannel suites. [3]NCR Voyix, “Leader in IDC MarketScape Assessments,” csimarket.com Lightspeed, Block (Square), and Clover pursued independent and micro-chain clients with bundled payments and payroll.
API openness became the new battleground, as restaurants preferred fewer vendors that can interoperate with delivery, accounting, and workforce tools out of the box. Providers integrated machine-vision waste monitoring, robotic drink dispensers, and AI upsell prompts to widen their defensive moats. Acquisition activity intensified: Toast folded xtraCHEF into its platform in March 2025 to add accounts payable automation. Meanwhile, global system integrators formed alliances with POS vendors to address skilled-talent shortages.
Pricing competition softened in the upper mid-market, where multi-site complexity outweighed subscription fees. Instead, vendors bundled value-added modules at marginal cost, seeking stickier average revenue per unit. Outcome-based contracts tied subscription tiers to throughput or gross payment volume, aligning incentives. Cybersecurity credentials SOC 2, PCI DSS, ISO 27001 emerged as must-haves, given ransomware fears in hospitality. Overall, provider differentiation hinged on product depth, service reach, and partnership ecosystems, shaping a dynamic yet consolidating restaurant management software market.
Restaurant Management Software Industry Leaders
Toast, Inc.
Block, Inc. (Square for Restaurants)
NCR Corporation
Oracle Corporation (MICROS)
Lightspeed Commerce Inc.
- *Disclaimer: Major Players sorted in no particular order

Recent Industry Developments
- April 2025: Toast launched Digital Storefront and Marketing Suites featuring AI email orchestration and personalized upsell recommendations
- March 2025: Toast acquired xtraCHEF to embed accounts-payable automation and recipe-level cost tracking
- February 2025: Block Inc. reported 12% gross-profit growth and 13% increase in food-and-beverage payment volume, underlining ecosystem expansion
- January 2025: Corporativo GES deployed Oracle MICROS Simphony cloud POS across Burger King and Church’s Texas Chicken sites in Mexico


Global Restaurant Management Software Market Report Scope
Restaurant management software is a holistic suite of applications and tools crafted to simplify and automate diverse facets of restaurant operations. By consolidating multiple functionalities into a unified platform, it offers a centralized system that not only manages operations but also boosts efficiency and overall productivity. Typically, restaurant management software amalgamates various software solutions into a singular, cohesive system, either natively or through seamless integration with other platforms.
The restaurant management software market is segmented by type (front-end software, accounting and cash flow, purchasing and inventory management, table and delivery management, employee payroll and scheduling, others), deployment (on-premise, cloud), and region (North America, Europe, Asia Pacific, Latin America, Middle East, and Africa). The market size and forecasts are provided in terms of value (USD) for all the above segments.
| Front-End (POS and Guest Experience) |
| Back-End Operations (Inventory and Procurement) |
| Analytics and Reporting |
| Workforce Management and Payroll |
| Integrated All-in-One Suites |
| Cloud |
| On-Premise / Self-Hosted |
| Hybrid |
| Quick Service Restaurants (QSR) |
| Fast-Casual Restaurants |
| Full-Service Restaurants (FSR) |
| Cloud Kitchens / Virtual Brands |
| Catering and Banqueting |
| Bars and Nightclubs |
| Order and Payment Processing |
| Inventory and Supply-Chain |
| CRM and Loyalty |
| Reservation and Table Management |
| Analytics and Business Intelligence |
| Single-site Independent |
| Small Chain (2-20 sites) |
| Mid-size Chain (21-100 sites) |
| Enterprise Chain (100+ sites) |
| North America | United States | |
| Canada | ||
| Mexico | ||
| South America | Brazil | |
| Argentina | ||
| Rest of South America | ||
| Europe | Germany | |
| United Kingdom | ||
| France | ||
| Italy | ||
| Russia | ||
| Rest of Europe | ||
| Asia-Pacific | China | |
| Japan | ||
| South Korea | ||
| India | ||
| ASEAN | ||
| Rest of Asia-Pacific | ||
| Middle East and Africa | Middle East | Saudi Arabia |
| United Arab Emirates | ||
| Turkey | ||
| Rest of Middle East | ||
| Africa | South Africa | |
| Nigeria | ||
| Rest of Africa | ||
| By Product Type | Front-End (POS and Guest Experience) | ||
| Back-End Operations (Inventory and Procurement) | |||
| Analytics and Reporting | |||
| Workforce Management and Payroll | |||
| Integrated All-in-One Suites | |||
| By Deployment Model | Cloud | ||
| On-Premise / Self-Hosted | |||
| Hybrid | |||
| By Restaurant Format | Quick Service Restaurants (QSR) | ||
| Fast-Casual Restaurants | |||
| Full-Service Restaurants (FSR) | |||
| Cloud Kitchens / Virtual Brands | |||
| Catering and Banqueting | |||
| Bars and Nightclubs | |||
| By Core Function | Order and Payment Processing | ||
| Inventory and Supply-Chain | |||
| CRM and Loyalty | |||
| Reservation and Table Management | |||
| Analytics and Business Intelligence | |||
| By End-User Size | Single-site Independent | ||
| Small Chain (2-20 sites) | |||
| Mid-size Chain (21-100 sites) | |||
| Enterprise Chain (100+ sites) | |||
| By Geography | North America | United States | |
| Canada | |||
| Mexico | |||
| South America | Brazil | ||
| Argentina | |||
| Rest of South America | |||
| Europe | Germany | ||
| United Kingdom | |||
| France | |||
| Italy | |||
| Russia | |||
| Rest of Europe | |||
| Asia-Pacific | China | ||
| Japan | |||
| South Korea | |||
| India | |||
| ASEAN | |||
| Rest of Asia-Pacific | |||
| Middle East and Africa | Middle East | Saudi Arabia | |
| United Arab Emirates | |||
| Turkey | |||
| Rest of Middle East | |||
| Africa | South Africa | ||
| Nigeria | |||
| Rest of Africa | |||


Key Questions Answered in the Report
What is the projected value of the restaurant management software market by 2031?
The market is expected to reach USD 14.73 billion by 2031, growing at a 14.52% CAGR.
Which region leads the restaurant management software market?
Asia-Pacific held a 42.12% share in 2025 and is on track for a 16.24% CAGR through 2031.
Why are analytics modules gaining traction?
Restaurants seek predictive insights for menu, labor, and inventory optimization, driving a 17.25% CAGR in analytics and business-intelligence spending.
How fast is cloud deployment growing?
Cloud solutions represent 60.87% of 2025 revenue and are expanding at a 14.94% CAGR as operators favor scalable, remote-managed platforms.
Which restaurant format is expanding the quickest in software spending?
Cloud kitchens and virtual brands show an 18.58% CAGR because delivery-first models need specialized orchestration capabilities.
What is the main barrier to software migration for established operators?
High legacy-system migration costs—covering data conversion, staff retraining, and downtime risk—remain the chief constraint, reducing growth by an estimated 0.9% on the overall CAGR.
Page last updated on:


