Digital Therapeutics Device Market Size and Share
Market Overview
| Study Period | 2020 - 2031 |
|---|---|
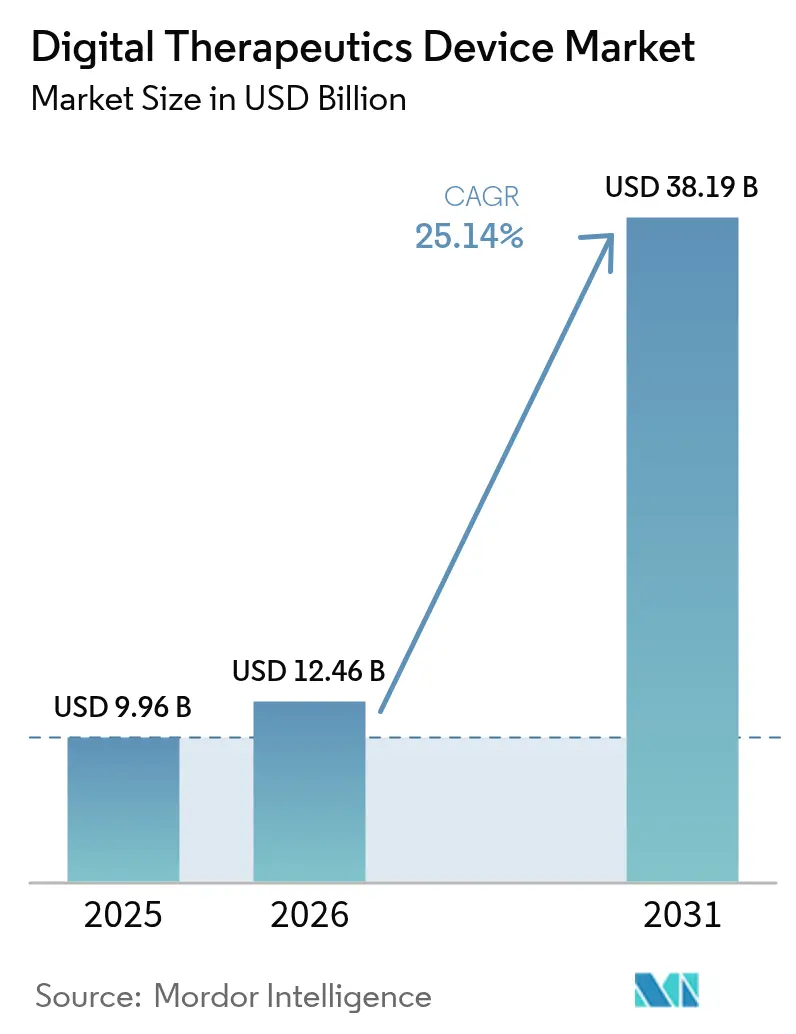
| Market Size (2026) | USD 12.46 Billion |
| Market Size (2031) | USD 38.19 Billion |
| Growth Rate (2026 - 2031) | 25.14% CAGR |
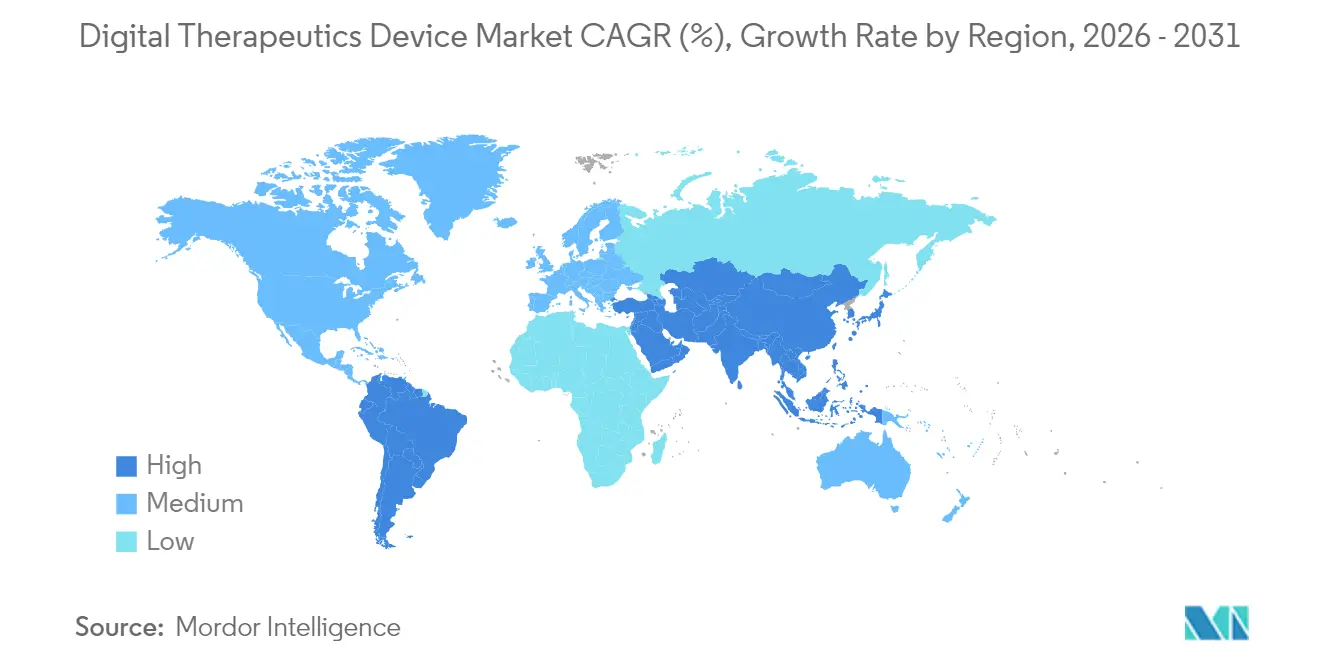
| Fastest Growing Market | Asia Pacific |
| Largest Market | North America |
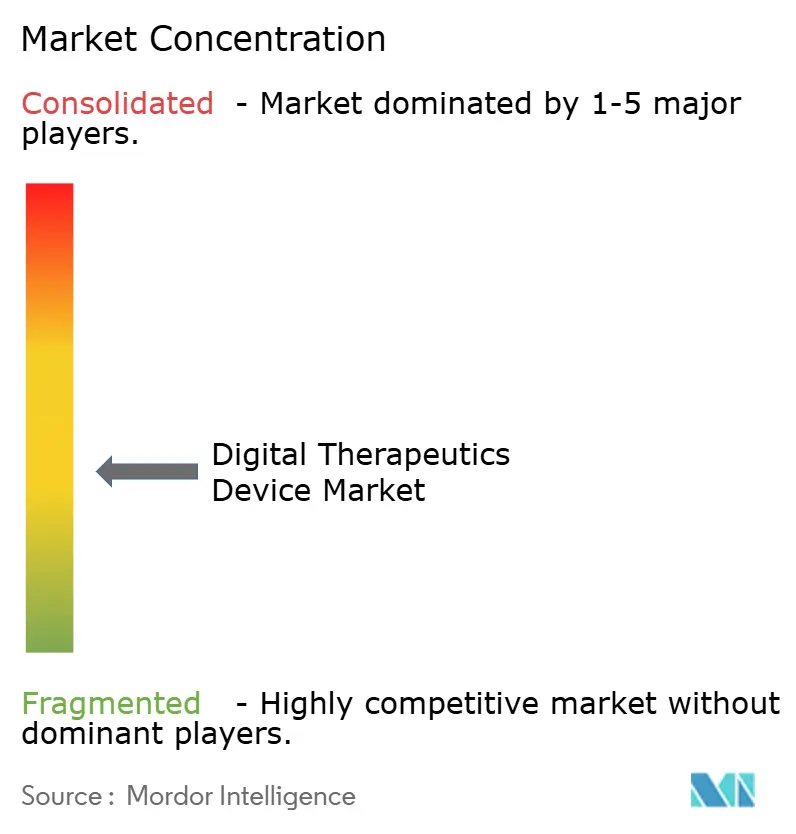
| Market Concentration | Medium |
Major Players *Disclaimer: Major Players sorted in no particular order Image © Mordor Intelligence. Reuse requires attribution under CC BY 4.0. | |
Digital Therapeutics Device Market Analysis by Mordor Intelligence
The Digital Therapeutics Device Market size is expected to grow from USD 9.96 billion in 2025 to USD 12.46 billion in 2026 and is forecast to reach USD 38.19 billion by 2031 at 25.14% CAGR over 2026-2031.
Expansion rests on software-based therapies that complement drugs, deliver measurable outcomes, and integrate smoothly with established clinical pathways. Regulatory harmonization—most notably the alignment between the United States Food and Drug Administration (FDA) and the Centers for Medicare and Medicaid Services (CMS)—adds commercial certainty, while Germany’s Digital Healthcare Act provides a blueprint for Europe. Artificial intelligence (AI) drives hyper-personalization, lifting patient engagement and clinical performance. At the same time, chronic-disease prevalence, maturing mobile infrastructure, and venture funding sustain demand, and payers are unlocking adoption by introducing reimbursement codes for mental-health digital therapies. Competitive intensity is steadily rising as large health-technology firms and pharmaceutical companies absorb niche developers, broadening therapeutic scope and bolstering distribution.
Key Report Takeaways
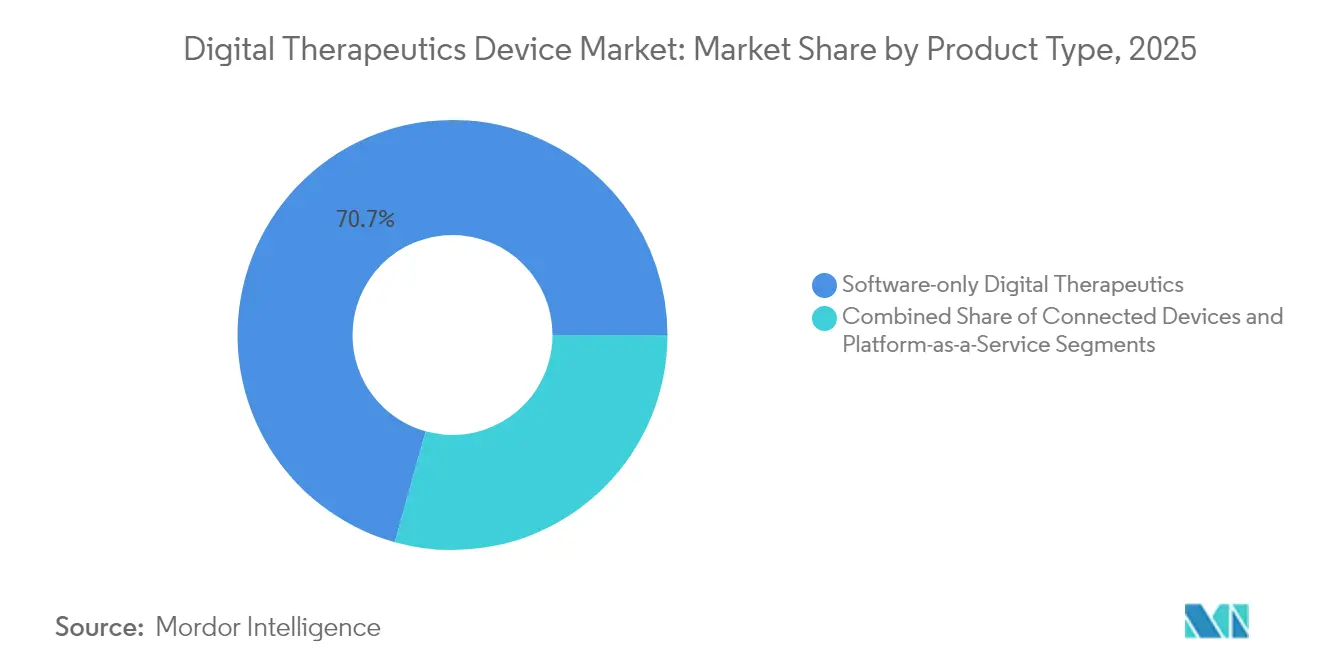
- By product type, software-only platforms led with a 70.68% share of the digital therapeutics devices market in 2025, whereas virtual reality and gaming solutions are expected to expand at a 27.92% CAGR through 2031.
- By therapeutic area, treatment applications accounted for 72.88% of the digital therapeutics devices market size in 2025, while preventive programs are projected to grow at a 27.11% CAGR to 2031.
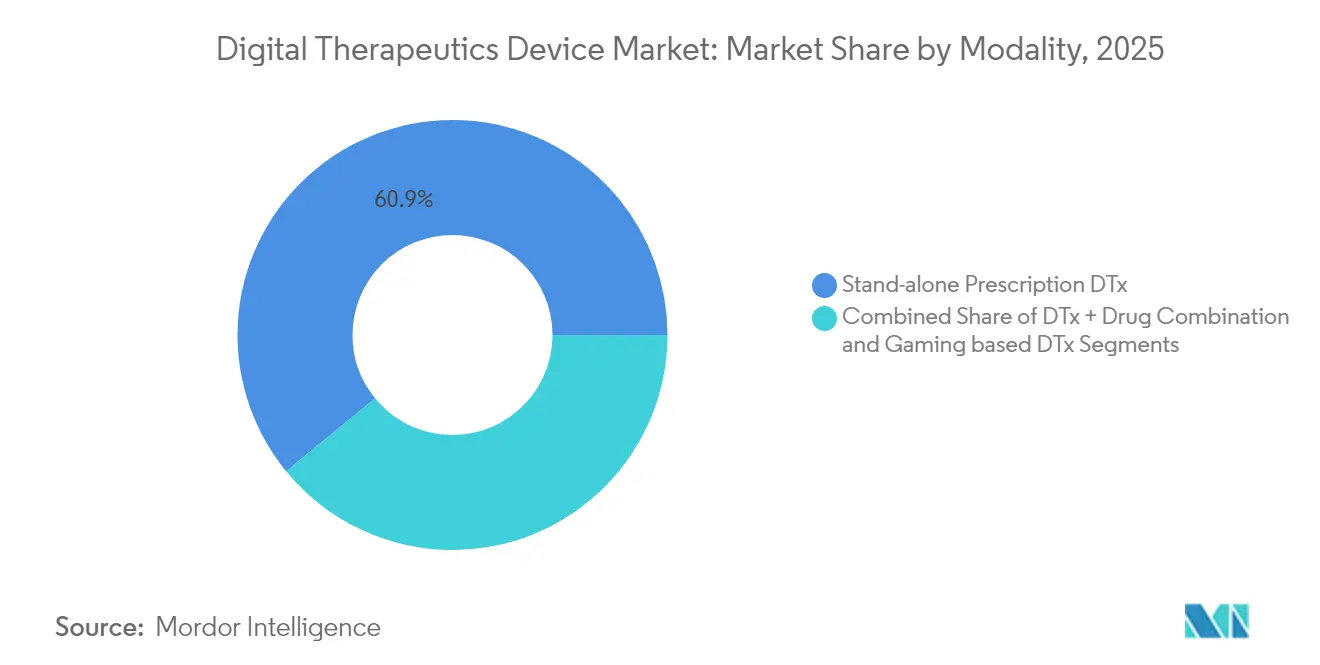
- By modality, standalone prescription solutions captured 60.92% of the digital therapeutics devices market size in 2025; drug–digital combinations are expected to hold the fastest outlook at a 26.02% CAGR.
- By end user, direct-to-consumer channels accounted for 49.12% of revenue in 2025, but payers and insurers are poised for the quickest rise, at a 25.76% CAGR.
- By geography, North America commanded 46.31% revenue in 2025; Asia-Pacific is set to advance at 27.18% CAGR, making it the fastest-growing region.
Note: Market size and forecast figures in this report are generated using Mordor Intelligence’s proprietary estimation framework, updated with the latest available data and insights as of 2026.
Global Digital Therapeutics Device Market Trends and Insights
Drivers Impact Analysis*
| Driver | (~) % Impact on CAGR Forecast | Geographic Relevance | Impact Timeline |
|---|---|---|---|
| Rising burden of chronic diseases | +6.2% | Global, concentrated in North America & Europe | Long term (≥ 4 years) |
| Rapid mobile & cloud technology maturation | +4.8% | Global, led by Asia-Pacific and North America | Medium term (2-4 years) |
| Government-backed preventive-care initiatives & VC funding | +3.9% | North America & EU, expanding to Asia-Pacific | Medium term (2-4 years) |
| Reimbursement expansion by payers | +5.1% | North America & Germany, spreading through the EU | Short term (≤ 2 years) |
| AI-driven hyper-personalization boosting engagement | +4.3% | Global, early uptake in developed markets | Medium term (2-4 years) |
| Corporate well-being budgets shifting to prescription DTx | +2.1% | North America & Western Europe | Short term (≤ 2 years) |
| Source: Mordor Intelligence | |||
Rising Burden of Chronic Diseases
Escalating rates of diabetes, asthma, chronic obstructive pulmonary disease, and cardiovascular disorders sustain continuous-care requirements that episodic clinical visits cannot satisfy. AI-driven digital twins helped 89% of users lower HbA1c below 7% within 12 months, underscoring clinical effectiveness in diabetes management.[1]Paramesh Shamanna, “One-Year Outcomes of a Digital Twin Intervention for Type 2 Diabetes: A Retrospective Real-World Study,” Scientific Reports, nature.com Chronic diseases absorb roughly 90% of developed-market spending, sharpening the argument for cost-saving, always-on digital therapies that curb emergency visits and hospitalizations. Respiratory-care applications with smart inhalers improve adherence and trim exacerbations, as documented in real-world studies.[2]Patrick F. Sach, “Artificial Intelligence in Respiratory Care,” Frontiers in Digital Health, frontiersin.org Demographic aging further heightens demand for intuitive self-management tools that operate across smartphones, wearables, and connected sensors.
Rapid Mobile & Cloud Technology Maturation
The arrival of 5G, edge computing, and advanced mobile chipsets lets therapeutic algorithms run locally, erasing latency and guarding privacy. Wearable AI built on soft microelectronics now processes data on-device, making continuous therapy unobtrusive and responsive. Mature cloud architectures synchronize information across gadgets and electronic health-record platforms via standard FHIR-based APIs, yielding a single longitudinal patient view that refines decision support. App-store validation programs dedicated to health applications create vetted distribution routes that reassure clinicians and reassure patients.
Reimbursement Expansion by Payers
Three CMS payment codes launched in January 2025 provide unified billing for digital mental-health treatments, setting a benchmark that private insurers typically follow. Germany’s Digital Healthcare Act produced 53 reimbursed applications covering 74 million lives, demonstrating the lift that national frameworks can deliver. Payers increasingly shift coverage from pharmacy to medical-benefit lines, adopt risk-sharing contracts, and demand real-world evidence that links digital usage to downstream savings, reinforcing the commercial argument for broad deployment.
AI-Driven Hyper-Personalization Boosting Engagement
Large language models now craft conversational guidance rivaling therapist empathy in controlled mental-health trials.[3]Sara Gerke, “Randomized Trial of a Generative AI Chatbot for Mental Health Treatment,” NEJM AI, ai.nejm.org Machine-learning systems employ just-in-time adaptive interventions, choosing optimal timing and channel to maximize adherence, with GPT-4 outperforming human experts in cardiac rehabilitation prompts. Multi-modal data—ranging from wearables to environmental sensors—feeds continuous learning loops, letting platforms adjust dosage, content, and cadence in real time. This personalization lifts retention, a critical metric for delivering durable clinical outcomes and sustaining revenue.
Restraints Impact Analysis*
| Restraint | (~) % Impact on CAGR Forecast | Geographic Relevance | Impact Timeline |
|---|---|---|---|
| Data-security concerns & clinician resistance | −3.2% | Global, particularly in regulated markets | Medium term (2-4 years) |
| High development & validation costs | −2.8% | Global, stronger effect in emerging markets | Long term (≥ 4 years) |
| Limited long-term clinical-outcome evidence | −2.1% | Global, shaping reimbursement decisions | Medium term (2-4 years) |
| Algorithmic bias triggering regulatory scrutiny | −1.4% | Developed markets with strict AI rules | Short term (≤ 2 years) |
| Source: Mordor Intelligence | |||
Data-Security Concerns & Clinician Resistance
Rising cyber-incidents erode trust among physicians and patients, especially when therapies require constant behavioral and physiologic monitoring. European regulators caution that perpetual data flows create heightened breach risk. Liability worries persist because algorithmic suggestions influence medical decisions without clear fault lines when outcomes falter. Privacy-preserving encryption offers a path forward but is costly and computationally heavy, slowing deployment.
High Development & Validation Costs
Digital therapeutics must satisfy both software-quality and medical-device rules. Randomized trials mirror pharmaceutical rigor and demand multi-year funding cycles that stretch the resources of smaller innovators. Europe’s Medical Device Regulation has raised compliance costs, forcing up to one-third of legacy products toward exit. Post-market surveillance needs constant updates as algorithms evolve, creating an expense profile unlike static hardware devices.
*Our forecasts treat driver/restraint impacts as directional, not additive. The impact forecasts reflect baseline growth, mix effects, and variable interactions.
Segment Analysis
By Product Type: Software Predominance Catalyzes Ecosystem Integration
Software-only solutions accounted for 70.68% of the digital therapeutics devices market revenue in 2025, reflecting the healthcare sector’s inclination toward low-overhead deployments that integrate seamlessly with existing clinical infrastructure. The segment’s lead also stems from rapid update cycles, enabling developers to push algorithm refinements without hardware recalls. Virtual-reality and gaming products hold the highest CAGR outlook at 27.92% to 2031, buoyed by immersive environments that elevate patient motivation and deliver exposure therapy with controlled stimuli. Connected peripherals—such as smart inhalers, glucose monitors, and VR headsets—anchor ecosystem convergence, as platform-as-a-service models provide unified data pipelines that simplify analytics. This progression suggests that sustained leadership will belong to vendors offering end-to-end frameworks, rather than individual point solutions.
The digital therapeutics devices market size for software platforms is projected to increase as electronic health record integration improves. At the same time, the hardware-linked segment commands a growing premium for conditions requiring biometric feedback. Interoperability, powered by open APIs, mitigates earlier fragmentation and encourages hospitals to consolidate multiple therapeutic lines on single dashboards, reducing vendor fatigue and improving clinician acceptance.


By Therapeutic Area: Treatment Dominates, Prevention Gains Traction
Treatment applications accounted for 72.88% of the digital therapeutics devices market share in 2025, thanks to established reimbursement routes and clear diagnostic triggers. Clinicians view treatment-oriented software as a direct substitute or adjunct for pharmaceuticals, expediting prescription within familiar workflows. Preventive solutions—ranging from diabetes risk programs to migraine prophylaxis—are advancing at a 27.11% CAGR, propelled by value-based care models that reward early intervention. FDA clearance of CT-132 marked the first preventive prescription digital therapeutic for episodic migraine, raising confidence among both payers and providers.
As health systems shift toward capitation and shared savings, preventive digital therapeutics become strategic levers for bending cost curves. Corporate wellness contracts further accelerate preventive care uptake, granting developers alternative revenue streams outside of insurer channels. The digital therapeutics devices market size for preventive programs is therefore poised to compound at a faster rate than the treatment segment beyond 2027, even though the absolute value remains smaller throughout the forecast horizon.
By Modality: Combination Therapies Challenge Standalone Supremacy
Standalone prescription software captured 60.92% of the revenue in 2025, favored for its simpler approval pathway and distinct intellectual property boundaries. Providers appreciate the clarity of prescribing a single digital product, logging usage, and measuring outcomes without coordinating pharmaceutical regimens. Yet combination drug-digital approaches are growing at 26.02% CAGR, aligned with the FDA’s Prescription Drug Use-Related Software (PDURS) guidance that clarifies submission expectations. Evidence shows digital add-ons can heighten drug effectiveness and permit dosage reduction, lowering side-effect profiles.
Virtual-reality modalities bolster engagement in pain and anxiety, while sensor-integrated wearables deliver closed-loop therapies that respond instantaneously to physiological triggers. Companies that can effectively integrate pharmacology, real-time data, and adaptive content are poised to displace pure-play software rivals. In turn, device makers are forging alliances with life-science firms to co-develop holistic care pathways, shifting market share toward integrated offerings.
By End User: Consumer Purchases Lead, Payers Accelerate
Direct-to-consumer channels accounted for 49.12% of revenue in 2025, primarily driven by app stores and subscription models that bypass clinical gatekeepers. Adoption benefits from immediate user feedback, facilitating iterative design improvements. Nevertheless, payers and insurers are the fastest-growing cohort, with a 25.76% CAGR, catalyzed by new CMS codes and German DiGA reimbursement, which validate the return on investment. As actuaries document reduced downstream costs, coverage expands from pilots to national formularies. Providers and hospital systems deepen uptake as integrations mature, and they value dashboards that synthesize device outputs into actionable clinical alerts.
Employers reallocate wellness budgets toward evidence-based digital therapeutics, forming direct-pay contracts that emphasize measurable outcomes. These multipronged distribution routes buffer developers from the volatility of any single channel and promote sustainable revenue diversification within the digital therapeutics devices market.
Geography Analysis
North America generated 46.31% of 2025 sales, with the U.S. leading the way, rooted in FDA clarity, CMS reimbursement, and an investment ecosystem willing to fund late-stage trials. The launch of three mental-health billing codes in 2025 vaulted digital interventions into mainstream benefit design, driving swift integration across health plans. Canada and Mexico contribute incremental growth as cross-border telehealth collaborations expand.
The Asia-Pacific region is projected to be the fastest-growing territory, advancing at a 27.18% CAGR through 2031. Japan pioneered regulatory models that recognize software as a therapy, prompting domestic pharmaceutical companies to co-develop digital interventions for neurological disorders. China leverages the expansive adoption of mobile payments and urban telehealth portals to scale its chronic disease management programs. In contrast, India’s surge in smartphone adoption enables the delivery of low-cost behavioral health applications to remote populations. Australia and South Korea act as test beds for advanced VR and AI algorithms due to high broadband penetration.
Europe shows measured but steady progress under the Medical Device Regulation, which harmonizes classification and post-market vigilance requirements. Germany’s DiGA pathway covers more than 74 million insured lives and provides a practical reimbursement precedent that other member states increasingly emulate. France, Italy, and Spain integrate national-health-service pilots, whereas the United Kingdom refines NICE appraisal processes for software therapies. Strict data-protection rules fuel innovation in privacy-preserving analytics, differentiating European vendors on security credentials.

Competitive Landscape
The competitive field is moderately fragmented: dozens of specialists pursue single-condition niches, yet consolidation is gathering pace. Large electronic-health-record vendors embed digital therapeutics modules, and pharmaceutical giants acquire platforms to extend therapy lifecycles. Three strategic archetypes predominate. First, pure-play developers such as Click Therapeutics focus on neurological and metabolic disorders, securing FDA de novo clearances and inking co-marketing deals with pharma. Second, health-tech platforms such as Teladoc bolt on therapeutics—illustrated by the USD 30 million UpLift acquisition that fortifies BetterHelp’s insurance-ready pipeline. Third, pharmaceutical incumbents weave digital companions into value-based contracts to defend share against generics.
Technology differentiation hinges on AI-driven personalization, robust real-world-evidence engines, and frictionless clinical-workflow integration. Hinge Health’s musculoskeletal focus produced 50% top-line growth and profitability by Q1 2025, underpinning a confident IPO filing that signals capital-market acceptance of the model. Omada Health’s Nasdaq debut further validates investor appetite for evidence-backed digital care. White-space opportunities persist in pediatrics, rare diseases, and multi-morbidity, where incumbent presence is limited and clinical unmet need is high.
Digital Therapeutics Device Industry Leaders
CANARY HEALTH
Livongo Health
Pear Therapeutics
Omada Health, Inc.
Koninklijke Philips N.V.
- *Disclaimer: Major Players sorted in no particular order

Recent Industry Developments
- May 2025: Hinge Health reported 50% revenue growth to USD 124 million and Q1 profit of USD 17.1 million ahead of its planned IPO.
- April 2025: Click Therapeutics secured FDA authorization for CT-132, the first preventive prescription digital therapeutic for episodic migraine in the U.S.
- April 2025: Teladoc Health acquired UpLift for USD 30 million to strengthen insurance-covered mental-health services.
- March 2025: Dassault Systèmes invested in Click Therapeutics’ Series C round to scale global prescription digital therapeutics.


Research Methodology Framework and Report Scope
Market Definitions and Key Coverage
Our study defines the digital therapeutic devices market as medical-grade software interventions, sometimes paired with connected hardware such as smart inhalers or continuous glucose monitors, that deliver clinically validated therapy to prevent, manage, or treat diseases. Revenue pools therefore combine prescription or direct-to-consumer subscription fees with device sales whenever hardware is integral to therapy. According to Mordor Intelligence, the analysis tracks only evidence-based programs cleared or under active regulatory review.
Scope Exclusion: General wellness, fitness, or meditation apps that lack peer-reviewed clinical outcomes sit outside scope.
Segmentation Overview
- By Product Type
- Software-only Digital Therapeutics
- Connected Devices (smart inhalers, CGMs, VR headsets)
- Platform-as-a-Service / APIs
- By Therapeutic Area
- Preventive
- Pre-diabetes
- Obesity
- Smoking Cessation
- Others
- Treatment
- Diabetes
- Cardiovascular Diseases
- Neurological Disorders
- Respiratory Diseases
- Oncology Support
- Others
- Preventive
- By Modality
- Standalone Prescription DTx
- DTx + Drug Combination (e.g., inhaled therapies)
- Virtual-Reality / Gaming-based DTx
- By End User
- Patients (D2C)
- Providers / Hospitals
- Payers & Insurers
- Employers & Corporate Wellness Programs
- By Geography
- North America
- United States
- Canada
- Mexico
- Europe
- Germany
- United Kingdom
- France
- Italy
- Spain
- Rest of Europe
- Asia-Pacific
- China
- Japan
- India
- Australia
- South Korea
- Rest of Asia-Pacific
- Middle East and Africa
- GCC
- South Africa
- Rest of Middle East and Africa
- South America
- Brazil
- Argentina
- Rest of South America
- North America
Detailed Research Methodology and Data Validation
Primary Research
Mordor analysts interviewed prescribing clinicians, payer formulary leads, hospital IT heads, and founders of DTx start-ups across North America, Europe, and Asia-Pacific. Their inputs shaped penetration curves, pricing spreads, and regulatory timelines.
Desk Research
We mapped addressable patient pools through open data from the US FDA digital health database, European Medicines Agency, International Diabetes Federation, OECD health statistics, and WHO. Adoption indicators were enriched with insights from the Digital Therapeutics Alliance, HIMSS, and MedTech Europe. Annual reports, 10-Ks, investor decks, and press releases revealed price corridors and active-user counts, which we triangulated with D&B Hoovers financials and customs shipment records accessed via Volza. This list is illustrative; many further open and paid sources were reviewed for consistency.
Market-Sizing & Forecasting
Our top-down build multiplies disease prevalence by verified DTx penetration and average subscription price, then benchmarks totals against sampled supplier roll-ups before modest bottom-up adjustments. Key variables include diagnosed diabetes population, smartphone ownership among chronic-care patients, reimbursement coverage share, monthly program price, new regulatory clearances, and device attach rates. A multivariate ARIMA model projects each driver through 2030.
Data Validation & Update Cycle
Outputs pass variance checks versus independent adoption trackers. Anomalies trigger analyst re-contact before sign-off. Reports refresh annually, with interim updates after material regulatory or reimbursement shifts.
Why Mordor's Digital Therapeutic Devices Baseline Deserves Confidence
Published estimates often diverge because firms mix wellness apps with medical therapies, freeze exchange rates at different dates, or assume aggressive uptake.
We disclose every scope choice, update currencies quarterly, and re-benchmark penetration yearly, giving clients a clear baseline.
Key Gap Drivers: Some publishers count hardware only, others ignore payer discounts, and a few blend preventive wellness apps, moving totals markedly.
Benchmark comparison
| Market Size | Anonymized source | Primary gap driver |
|---|---|---|
| USD 9.96 B (2025) | Mordor Intelligence | - |
| USD 2.08 B (2025) | Global Consultancy A | Hardware-only scope, excludes subscription revenue |
| USD 7.88 B (2024) | Industry Association B | Omits bundled devices and payer discounts |
| USD 6.23 B (2023) | Trade Journal C | Blends wellness apps, uses historic rates |
These contrasts show that our disciplined inclusion rules, rolling currency updates, and yearly expert review deliver the most dependable view for decision-makers.


Key Questions Answered in the Report
What is the current value of the digital therapeutics devices market?
The market is estimated at USD 12.46 billion in 2026 and is projected to reach USD 38.19 billion by 2031.
Which region is growing fastest for digital therapeutics?
Asia-Pacific leads with a forecast 27.18% CAGR, driven by smartphone penetration, supportive policy, and rising chronic-disease prevalence.
How are payers influencing adoption of digital therapeutics?
New CMS reimbursement codes and Germany’s DiGA framework provide standardized payment pathways, prompting broader insurer coverage and accelerating uptake.
Which product modality shows the highest growth?
Drug–digital combination therapies hold the quickest pace at 26.02% CAGR as integrated approaches prove superior to either modality alone.
What are the main barriers to digital therapeutics expansion?
Data-security concerns, clinician resistance, high validation costs, and limited long-term outcome evidence remain key hurdles slowing market advancement.
How does AI enhance digital therapeutics effectiveness?
AI enables real-time personalization, adaptive intervention timing, and conversational interfaces that improve patient engagement and clinical outcomes.
Page last updated on:


