
Portable Medical Electronic Products Market Size and Share
Market Overview
| Study Period | 2020 - 2031 |
|---|---|
| Market Size (2026) | USD 99.05 Billion |
| Market Size (2031) | USD 152.66 Billion |
| Growth Rate (2026 - 2031) | 9.04 % |
| Fastest Growing Market | Asia-Pacific |
| Largest Market | North America |
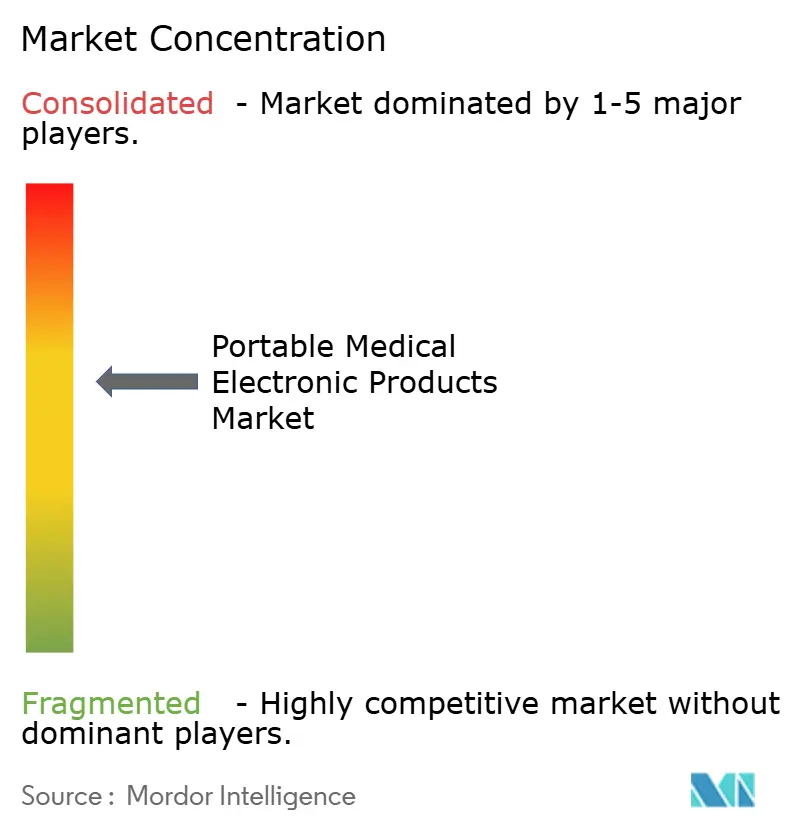
| Market Concentration | Medium |
Major Players *Disclaimer: Major Players sorted in no particular order Image © Mordor Intelligence. Reuse requires attribution under CC BY 4.0. | |
Portable Medical Electronic Products Market Analysis by Mordor Intelligence
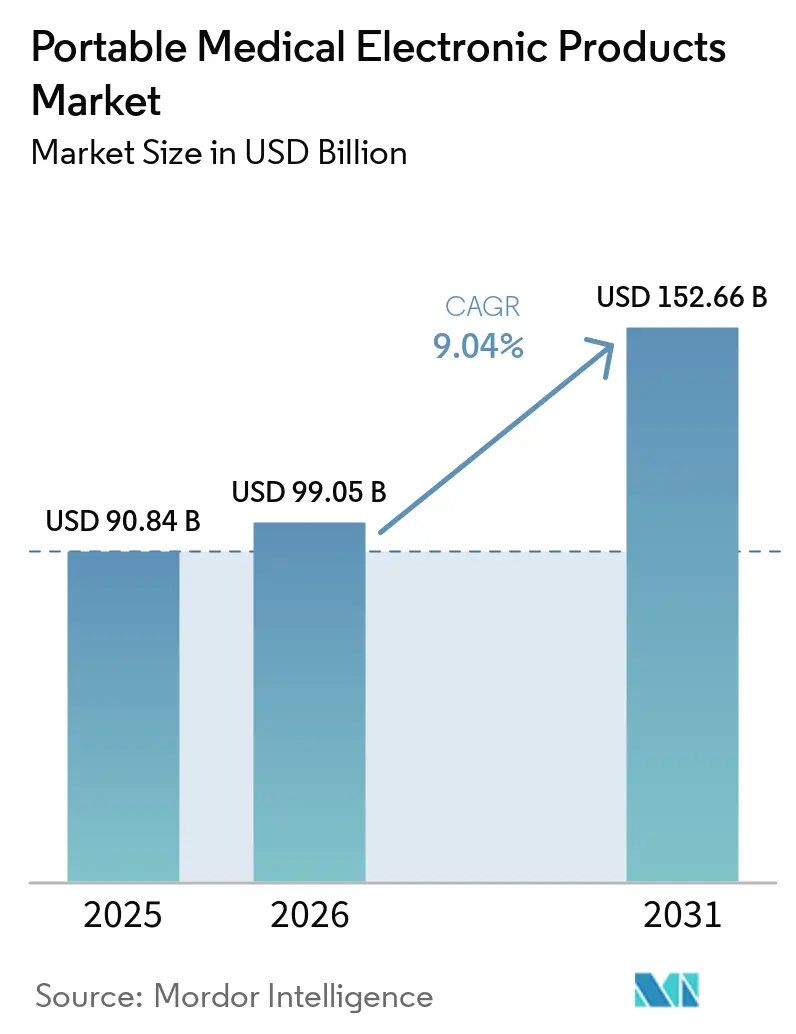
The portable medical electronic products market size was valued at USD 90.84 billion in 2025 and estimated to grow from USD 99.05 billion in 2026 to reach USD 152.66 billion by 2031, at a CAGR of 9.04% during the forecast period (2026-2031). This growth reflects mounting demand for out-of-hospital care, maturing semiconductor miniaturization, and reimbursement models that now reward continuous monitoring. Rapid integration of on-device artificial intelligence is redefining diagnostic accuracy, while home-care adoption expands as health systems look to trim preventable readmissions. Technology giants are entering with software-centric approaches, intensifying competition and accelerating product lifecycles. Meanwhile, supply-chain vulnerabilities in specialized chips and rising cybersecurity compliance costs temper near-term momentum.
Key Report Takeaways
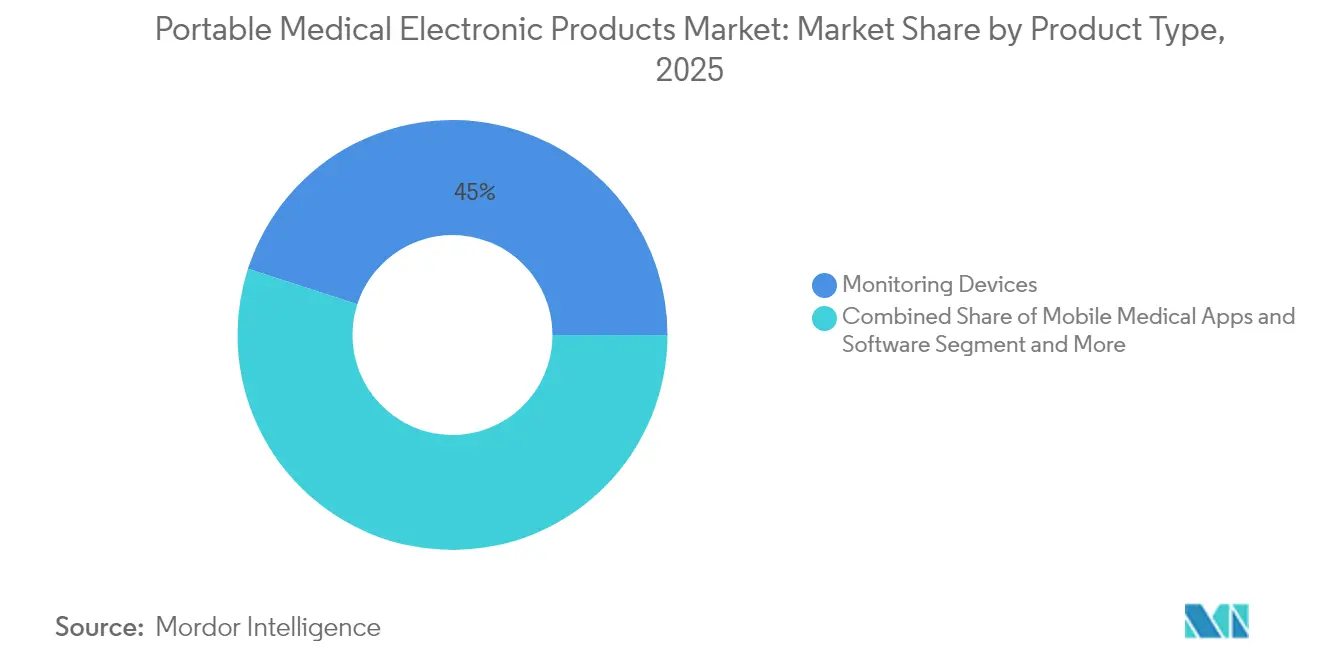
- By product type, monitoring devices held 45.02% of the portable medical electronic products market share in 2025; mobile medical apps and software are advancing at a 13.72% CAGR through 2031.
- By component, sensors accounted for 35.08% share of the portable medical electronic products market size in 2025, while processors and AI chips post the fastest 15.12% CAGR.
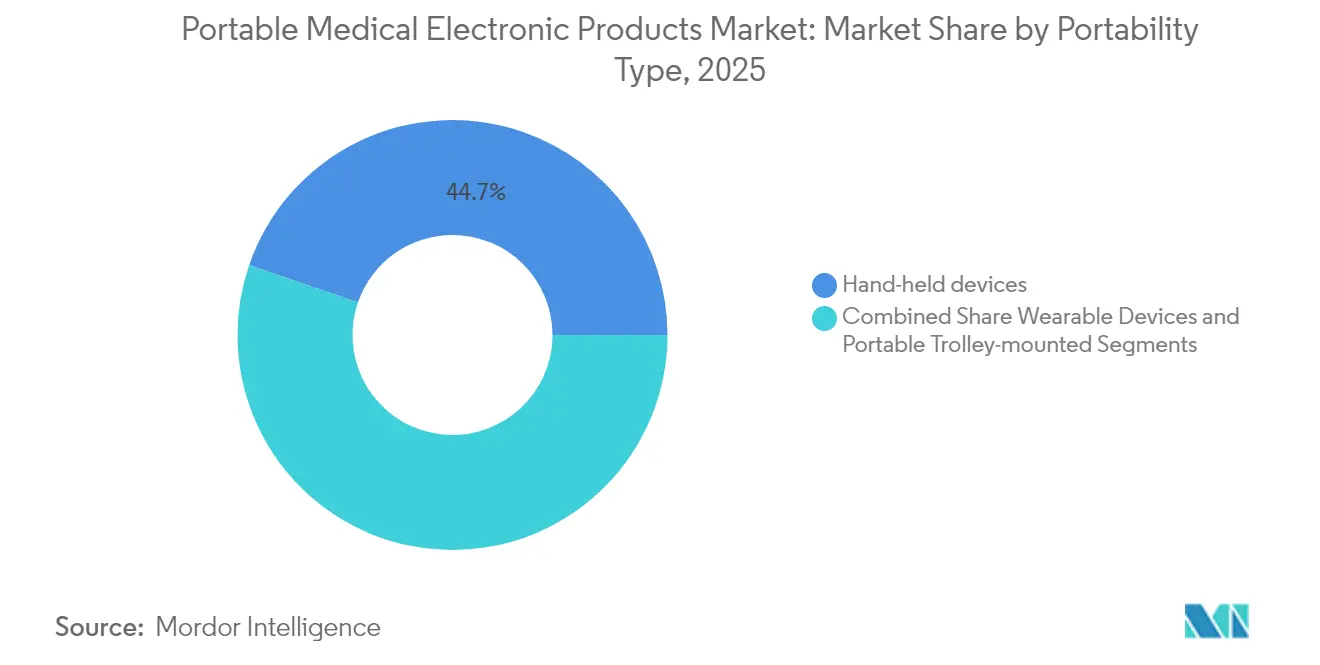
- By portability type, hand-held devices led with 44.73% share in 2025; wearables are expanding at a 16.02% CAGR.
- By end user, hospitals dominated with 59.55% market share in 2025, whereas home-care settings record a 13.18% CAGR.
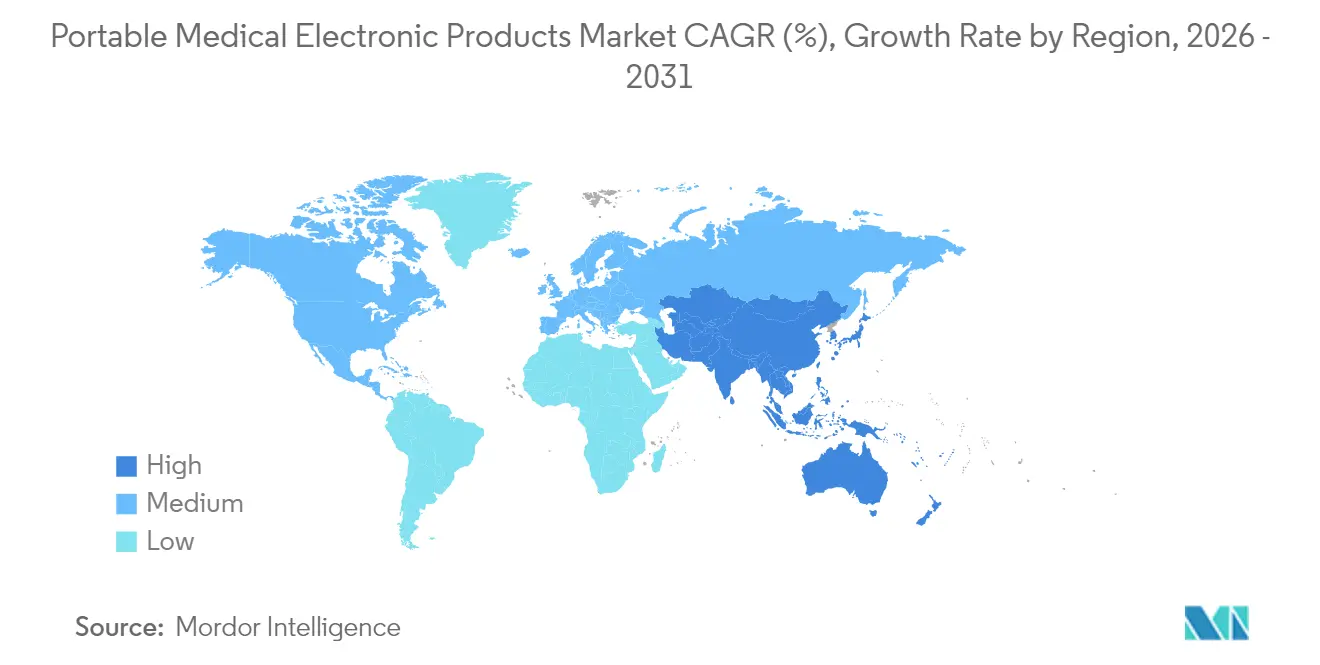
- By geography, North America commanded 37.98% share in 2025, yet Asia-Pacific is projected to grow at an 11.24% CAGR to 2031.
Note: Market size and forecast figures in this report are generated using Mordor Intelligence’s proprietary estimation framework, updated with the latest available data and insights as of 2026.
Market Trends and Insights
Drivers Impact Analysis of Portable Medical Electronic Products Market*
| Driver | (~) % Impact on CAGR Forecast | Geographic Relevance | Impact Timeline |
|---|---|---|---|
| Home-based chronic-disease monitoring | +1.8% | North America, EU, expanding globally | Medium term (2–4 years) |
| Wearable health & fitness electronics | +1.6% | North America, Asia-Pacific | Short term (≤ 2 years) |
| Low-power miniaturised medical components | +1.4% | Global technology hubs | Long term (≥ 4 years) |
| Aging population imaging & monitoring needs | +1.9% | Japan, EU, North America | Long term (≥ 4 years) |
| On-device AI inference for diagnostics | +1.5% | North America, EU, scaling to Asia-Pacific | Medium term (2–4 years) |
| Fast-track pathways for connected devices | +1.2% | North America, EU | Short term (≤ 2 years) |
| Source: Mordor Intelligence | |||


Escalating Demand for Home-Based Chronic-Disease Monitoring
Health systems are deploying connected monitors to cut preventable readmissions and routine clinic visits. The Centers for Medicare & Medicaid Services expanded reimbursement for remote patient monitoring in 2024, signalling payer endorsement of at-home technology. Data from major providers show 15–20% drops in emergency department use when monitored patients transmit daily metrics. Diabetes, cardiovascular disease, and COPD now account for most remote-monitoring enrollments, creating a scalable addressable base for the portable medical electronic products market. Clinical outcomes remain stable, encouraging payers to widen coverage horizons. Device makers are responding with turnkey service bundles that combine hardware, cloud analytics, and clinical coaching to overcome staffing constraints in primary care.
Rapid Adoption of Wearable Health & Fitness Electronics
Consumer familiarity with smartwatches and fitness bands shortens the learning curve for medical wearables, enabling cross-over into regulated indications. North America leads shipments, yet Asia-Pacific overtook Europe in 2024 unit growth after regional smartphone brands embedded SpO₂ and ECG functions in mass-market devices. Sports-science endorsements drive early uptake, while insurers experiment with premium discounts for verified activity data. Seamless Bluetooth-to-telemedicine integration positions wearables as the on-ramp for continuous data streams that feed AI algorithms, thereby amplifying the value proposition of the portable medical electronic products market. Regulatory agencies now reference ISO/IEC standard 60601-1-11 to streamline approvals for body-worn sensors, cutting average review times by 15%.
Advances in Low-Power Miniaturised Medical Components
Breakthroughs in MEMS sensors, gallium-nitride switching, and solid-state batteries allow multi-parameter diagnostics within palm-sized enclosures. The European Battery Regulation mandates higher energy density and recyclability for all portable cells, accelerating R&D on silicon-graphene anodes. Component suppliers now offer system-in-package solutions that reduce board area by 40%, letting device brands shrink enclosures without sacrificing run-time. Thermal challenges remain, yet liquid-metal thermal vias dissipate localized hotspots, preserving skin-contact comfort. These improvements unlock emergent form factors such as sub-cutaneous monitors that operate five years on a single cell, strengthening the innovation cycle of the portable medical electronic products market.
Aging Population Driving Imaging & Monitoring Needs
By 2025, 29% of Japan’s residents are over 65, forcing a shift from episodic treatment to preventive surveillance[1]Japan Ministry of Health, “Aging Society Statistics 2024,” moh.go.jp. Governments channel subsidies toward at-home diagnostics to alleviate bed shortages. Trials of ambulance-mounted MRI in Tokyo demonstrated door-to-scan times under 15 minutes, critical for ischemic stroke outcomes. Europe follows with grants for mobile ultrasound to monitor heart failure patients remotely. As similar aging dynamics emerge in South Korea, Italy, and the United States, demand for portable imaging expands beyond tertiary hospitals, reinforcing revenue visibility for the portable medical electronic products market.
Restraints Impact Analysis of Portable Medical Electronic Products Market*
| Restraint | (~) % Impact on CAGR Forecast | Geographic Relevance | Impact Timeline |
|---|---|---|---|
| Cybersecurity & patient-data privacy | -2.1% | EU, North America | Short term (≤ 2 years) |
| High upfront costs & limited reimbursement | -1.8% | Emerging markets | Medium term (2–4 years) |
| Battery lifespan & thermal-management limits | -1.3% | Regions with extreme climates | Long term (≥ 4 years) |
| Volatile supply of specialized semiconductors | -1.6% | Asia-Pacific fabs | Short term (≤ 2 years) |
| Source: Mordor Intelligence | |||
Cyber-Security & Patient-Data Privacy Liabilities
The FDA’s 2024 cybersecurity guidance obliges manufacturers to embed threat-mitigation protocols from design through post-market support[2]FDA, “Cybersecurity in Medical Devices,” fda.gov . EU GDPR fines now reach 4% of annual revenue for breaches, pushing procurement teams to demand penetration-testing evidence before purchase. Hospitals hesitate to connect new devices to electronic health-record backbones without zero-trust architectures. Vendors invest in hardware root-of-trust and over-the-air patching, raising bill-of-materials costs that ripple through pricing in the portable medical electronic products market. Cyber-insurance premiums climbed 15% year-on-year in 2025, reflecting rising attack frequency on connected infusion pumps and cardiac monitors.
High Upfront Costs & Limited Reimbursement Pathways
While remote monitoring cuts long-term costs, capital budgets in emerging markets rarely extend beyond essential imaging. Medicare’s fee schedule covers device setup and monthly data review, but rates leave a 25% funding gap relative to program operating expenses. Providers therefore prefer rental agreements or outcome-based contracts that shift risk to vendors. Manufacturers bundle analytics and nurse-call centers to justify subscription fees, yet these models strain cash flow during scale-up, moderating adoption velocity in the portable medical electronic products market.
*Our forecasts treat driver/restraint impacts as directional, not additive. The impact forecasts reflect baseline growth, mix effects, and variable interactions.
Portable Medical Electronic Products Market Segment Analysis
By Product Type:
Monitoring Devices Lead Clinical IntegrationMonitoring devices generated the largest revenue, commanding 45.02% share of the portable medical electronic products market in 2025. Their mature clinical validation and reimbursement backing underpin procurement preference across hospitals and home-care agencies. Mobile medical apps and software, although contributing a small base, exhibit the fastest 13.72% CAGR as smartphones morph into FDA-cleared diagnostic tools. This surge is redefining patient engagement because software leverages pre-existing cameras, microphones, and inertial sensors. Diagnostic imaging systems maintain specialized penetration, particularly hand-carried ultrasound for emergency triage. Therapeutic devices such as electrical nerve stimulators post steady growth supported by value-based care incentives. The portable medical electronic products market benefits from blended hardware-software propositions exemplified by Withings’ BeamO, whose 4-in-1 vitals capture encourages preventive check-ups from home.
Software’s scalable economics accelerates global diffusion; once a regulatory dossier is in place, incremental distribution costs trend toward zero, favouring freemium models tied to premium analytics subscriptions. Traditional device makers respond by embedding cloud dashboards and AI triage recommendations, closing the gap with app-first competitors. Cross-platform interoperability emerges as a differentiator, as providers seek unified views that aggregate data from blood-glucose sensors, blood-pressure cuffs, and weight scales. Consequently, licensing revenue from application-programming interfaces grows faster than hardware margins within the portable medical electronic products market.


By Component:
Processors Drive Intelligence MigrationSensors retained 35.08% revenue leadership in the portable medical electronic products market size for components in 2025, yet processors and dedicated AI chips register a striking 15.12% CAGR. The momentum stems from real-time inference workloads such as arrhythmia detection and sepsis prediction at the bedside. Semiconductor vendors bundle neural-processing units with integrated power-management, shrinking board count and lowering system cost. Communication modules gain from 5G and Wi-Fi 6 adoption, enabling high-resolution imaging transfer across wireless portable medical devices without tethered connections. Displays transition to AMOLED touchscreens with haptic feedback, simplifying user training for non-technical caregivers.
Edge processing relocates analytics previously hosted in the cloud, slashing latency and easing compliance with data-sovereignty laws. Hospitals value on-premises decisions that continue uninterrupted during network outages, while home users appreciate immediate actionable insights. Processor upgrades trigger replacement cycles that shorten average device life to four years, expanding annuity revenue opportunities. As healthcare moves towards predictive medicine, algorithm complexity intensifies compute demand, ensuring sustained investment in processor roadmaps across the portable medical electronic products market.
By Portability Type:
Wearables Reshape Patient ExperienceHand-held units held 44.73% share in 2025, reflecting clinical familiarity and accurate measurement of vitals during rounds. Wearables, however, exhibit a 16.02% CAGR, shifting monitoring from snapshot readings to 24/7 streams that anticipate deteriorating trends. Integration with consumer smartphones boosts adherence, as data upload occurs passively in the background. Portable trolley-mounted systems serve emergency departments and forward surgical teams where ruggedized casings protect sensitive electronics from shock and contaminants.
Consumer expectations elevate design standards, pushing medical wearables toward fashion-aligned aesthetics and comfort. Flexible circuits and breathable fabrics now accommodate multi-lead ECG in a compression shirt format. In professional care, wearables trim nurse workload by automating charting, freeing staff for high-value tasks. Insurance carriers pilot outcome-based reimbursements tied to continuous-data thresholds, nudging providers to prescribe wearable monitors. Consequently, the portable medical electronic products market gravitates toward algorithm-driven engagement that rewards patient participation.
By End User:
Home-Care Settings Accelerate AdoptionHospitals represented 59.55% revenue in 2025, a testament to their central procurement and integration capabilities. Yet home-care environments grow at 13.18% CAGR as payers reimburse telehealth visits and remote vitals surveillance. Consumer comfort with connected devices simplifies onboarding, while logistics companies enable same-day delivery of pre-configured kits. Physician offices adopt portable diagnostics to expand service lines without investing in heavy capital equipment, thereby retaining patients within clinic networks. Military and emergency services procure rugged defibrillators like Stryker’s LIFEPAK 35 to maintain readiness in austere settings.
As value-based care contracts penalize avoidable admissions, hospitals shift resources to post-discharge monitoring platforms. Device makers now bundle clinician dashboards, predictive alerts, and medication adherence checks into subscription offerings. Home infusion companies integrate wearable pumps with AI dosing algorithms, demonstrating how the portable medical electronic products market overlaps traditional therapeutic domains. Stakeholders recognize that sustainable scaling hinges on intuitive user interfaces that address senior populations with limited technical proficiency.
Geography Analysis
North America Portable Medical Electronic Products Market
North America retained leadership with 37.98% of global revenue in 2025, supported by robust reimbursement frameworks and a vibrant innovation ecosystem. Collaboration between cloud hyperscalers and device firms accelerates AI deployment, while domestic semiconductor incentives mitigate supply-risk exposure. Canada’s single-payer model creates predictable procurement volumes for vital-sign monitors targeting chronic-disease cohorts. Mexico doubles as manufacturing hub and emerging customer base, drawing contract electronics makers near the United States border to shorten logistics lead times. Consequently, the portable medical electronic products market benefits from vertically integrated value chains across the continent.
APAC Portable Medical Electronic Products Market
Asia-Pacific posts the fastest 11.24% CAGR to 2031 as demographic shifts, rising disposable incomes, and government stimulus coalesce. China’s regulatory reforms streamline Class II approvals, encouraging international brands to localize production. Japan’s super-aged society adopts remote monitoring to offset caregiver shortages, spurring domestic innovators to pilot AI in-home robots. India prioritizes cost-effective diagnostics for rural health clinics, favouring smartphone-tethered hardware that leverages existing networks. South Korea’s nationwide 5G coverage enables low-latency tele-ECG during ambulance transit. These diverse drivers require nuanced go-to-market strategies yet collectively fortify volume outlook for the portable medical electronic products market.
Europe Portable Medical Electronic Products Market
Europe experiences steady expansion underpinned by MDR compliance, significant digital-health funding, and cross-border telemedicine initiatives. Germany’s manufacturing prowess anchors regional supply for sensor modules, while France channels public investment toward preventive care that includes reimbursing blood-pressure wearables. The United Kingdom capitalizes on regulatory autonomy to introduce conditional approvals that hasten AI diagnostics to market. Southern European nations, facing budgetary constraints, adopt device-as-a-service models to minimize upfront expenditure. GDPR enforcement shapes cybersecurity best practice, positioning European vendors to export privacy-centric designs globally, which in turn elevates trust in the portable medical electronic products market.

Regulatory Landscape
Portable medical electronic products operate under converging device-safety, quality-system, and connected-device expectations across major jurisdictions. In the United States, FDA oversight covers premarket pathways such as 510(k) and De Novo, alongside post-market controls. Compliance requirements sharpened for connected devices after the FDA cybersecurity guidance issued in 2024, and the May 2026 final guidance on human factors information in medical device marketing submissions further raises expectations for how manufacturers document usability considerations. In February 2026, the FDA Quality Management System Regulation (QMSR) became effective, aligning US quality requirements more closely with ISO 13485-style practices and increasing the importance of design controls and lifecycle documentation for portable monitors, wearables, and software-enabled accessories.
In Europe, EU MDR requirements continue to shape clinical evidence, UDI, and post-market surveillance obligations, while digitized oversight progressed as EUDAMED entered a mandatory phase on May 28, 2026 for core modules (including Actors and UDI/Devices). This step increases the operational need for accurate device master data, economic-operator registration, and vigilance reporting for portable electronic devices distributed across the EU. In May 2026, the European Commission also adopted Implementing Regulation (EU) 2026/977, which sets uniform quality management requirements for notified body conformity assessment activities (effective February 2027), reinforcing consistent audit expectations for manufacturers relying on EU notified bodies for certification.
Competitive Landscape
The portable medical electronic products market reflects moderate concentration as legacy device manufacturers balance hardware depth with software agility. Philips leverages its imaging heritage to integrate bedside monitors with home-care platforms, securing end-to-end data continuity. GE Healthcare partners with Amazon Web Services to embed machine-learning models directly into ultrasound probes, shortening diagnosis times in emergency departments. Medtronic extends its therapeutic portfolio into connected insulin delivery, pairing patch pumps with predictive glucose analytics.
Consumer-electronics brands intensify rivalry: Apple markets FDA-cleared atrial-fibrillation alerts on the Watch Series, while Samsung integrates blood-pressure calibration into Galaxy Wearables. Niche specialists such as AliveCor dominate ambulatory ECG through continuous algorithm improvements and hospital partnerships. Dexcom secures diabetes management share by licensing data to digital-therapy firms that optimize dosing. Military-focused vendors protect defensible niches via ruggedization IP and NATO supply credentials.
Strategic moves include Stryker’s 2024 launch of LIFEPAK 35, combining defibrillation, capnography, and cellular telemetry to support field medics. Withings gained FDA clearance for BPM Vision in 2025, linking ocular microvascular imaging with hypertension detection for early organ-damage signals. Start-up PreEvnt previewed a non-invasive glucose alert patch at CES 2025, demonstrating how consumer expos accelerate visibility in the portable medical electronic products market. Patent filings increasingly center on AI model optimization, data-interoperability frameworks, and advanced battery chemistries, signalling that intangible assets complement traditional manufacturing economies of scale.
Portable Medical Electronic Products Industry Leaders
GE Healthcare
Abbott Laboratories
Hologic Inc.
Koninklijke Philips N.V.
Omron Healthcare Co. Ltd
- *Disclaimer: Major Players sorted in no particular order
Portable Medical Electronic Products Market Companies Covered in this Report
- Koninklijke Philips
- GE Healthcare
- Medtronic
- Abbott Laboratories
- Omron Healthcare Co. Ltd
- Beckton Dickinson
- Siemens Healthineers
- Samsung Electronics (Samsung Healthcare)
- FUJIFILM
- Hologic
- Boston Scientific
- Dexcom
- Masimo
- Nihon Kohden
- Mindray Bio-Medical Electronics
- Resmed
- Smiths Group
- Insulet
- iRhythm Technologies
- AliveCor
- Baxter
- BIOTRONIK
- Beurer
- Qardio Inc.

Market Opportunities and Future Outlook
Home-based care and continuous monitoring programs are creating whitespace for portable products that combine regulated hardware with clinically validated software workflows, particularly where reimbursement and provider capacity constraints push remote triage over in-person visits. In the United States, the Centers for Medicare & Medicaid Services expanded reimbursement for remote patient monitoring in 2024, and provider datasets cited in the report show 15-20% reductions in emergency department use when monitored patients transmit daily metrics. This evidence supports broader deployment of connected blood-pressure, cardiac, and respiratory monitors in post-discharge pathways. Within the component stack, rising adoption of processors and AI chips inside portable devices (the fastest-growth component in the report) supports opportunities for on-device inference that lowers latency and reduces dependence on always-on connectivity, which is relevant for both home-care settings and emergency medical services.
Regulatory digitization and AI governance are also influencing product and go-to-market choices, creating room for vendors that can operationalize compliance as part of their offers. The EU transition to mandatory EUDAMED modules from May 2026 increases the value of UDI-ready device portfolios and interoperability-enabled data pipelines for manufacturers shipping multiple SKUs across geographies. The EU AI Act (Regulation 2024/1689) similarly reinforces dual requirements for high-risk AI-enabled medical devices alongside MDR/IVDR, raising expectations for data management, cybersecurity, and documentation. In April 2026, the FDA launched the Technology-Enabled Meaningful Patient Outcomes (TEMPO) pilot program, which provides an early engagement pathway for firms focused on evidence generation for sensor-based digital health technologies. At the same time, the European Battery Regulation and cybersecurity scrutiny are pushing device makers toward differentiated power modules, secure update mechanisms, and service bundles that include deployment, monitoring dashboards, and maintenance, rather than stand-alone hardware sales.
Recent Industry Developments in Portable Medical Electronic Products Market
- June 2026: GE HealthCare received FDA 510(k) clearance for MIM Contour ProtegeAI+ 2.0, an AI-enabled auto-contouring software used in radiation therapy planning. The clearance supports deeper integration of AI into clinical workflows where speed and consistency affect throughput and standardization, reinforcing software-led differentiation alongside portable and point-of-care imaging ecosystems.
- May 2026: Abbott secured CE Mark for the FreeStyle Libre Duo and Libre Duo 10 Day systems, positioned as the first dual glucose-ketone sensing technology for people with diabetes. Dual-analyte sensing expands the clinical utility of wearables from glucose-only monitoring into risk management for acute metabolic events, widening use cases for portable continuous monitoring platforms in Europe.
- June 2024: The Centers for Medicare & Medicaid Services expanded reimbursement for remote patient monitoring, reinforcing payer support for at-home data capture and review. This change supports provider economics for deploying connected portable monitors across chronic disease cohorts, accelerating bundled hardware-software service models focused on reducing avoidable utilization.


Portable Medical Electronic Products Market Report Scope and Research Methodology
Market Definition and Coverage
This market covers revenue generated from portable medical electronic products that are used to diagnose, image, or monitor patients in clinical and non-clinical settings, and that are designed for point-of-care or mobile use across care pathways.
Scope exclusions: For this sizing, we exclude portable therapeutic devices and non-medical consumer wellness electronics that do not fall under diagnostic imaging or monitoring use cases.
Segments Covered in This Report
- By Product Type
- Diagnostic Imaging Systems
- Monitoring Devices
- Cardiac Monitoring
- Neuro Monitoring
- Respiratory Monitoring
- Fetal & Neonatal Monitoring
- Multi-parameter Monitors
- Therapeutic Devices
- Mobile Medical Apps & Software
- Other Products
- By Component
- Sensors
- Batteries & Power Modules
- Communication Modules (BT/Wi-Fi/5G)
- Display & Interface Modules
- Processors & AI Chips
- By Portability Type
- Hand-held
- Wearable
- Portable Trolley-mounted
- By End User
- Hospitals
- Physician Offices & Clinics
- Home-care Settings
- Emergency Medical Services
- Military & Remote Healthcare
- Geography
- North America
- United States
- Canada
- Mexico
- Europe
- Germany
- United Kingdom
- France
- Italy
- Spain
- Rest of Europe
- Asia-Pacific
- China
- Japan
- India
- South Korea
- Australia
- Rest of Asia-Pacific
- Middle East and Africa
- GCC
- South Africa
- Rest of Middle East and Africa
- South America
- Brazil
- Argentina
- Rest of South America
- North America
Data Sources, Market Sizing, and Validation
Desk Research
To build the first draft of the model, we mapped the device landscape and the demand pool for portable diagnostic imaging and monitoring across major care settings. We reviewed public health statistics and policy documents to understand screening and monitoring patterns, especially where home care adoption is rising.
Desk research also included non-paywalled inputs such as World Health Organization health indicators, OECD health statistics, the US FDA device databases and safety communications, US CDC burden and surveillance pages, and World Bank population and age-structure data. We also reviewed company annual reports, investor presentations, association websites, peer-reviewed journals for technology and clinical adoption signals, and reputable press coverage for product launches and reimbursement changes. Paid subscriptions were used selectively for company financials and intelligence, patent databases, and shipment-level import and export signals when public data was too broad to isolate portable form factors. These examples are not exhaustive, and many other sources were used to collect, validate, and clarify assumptions during the research.
Primary Interviews and Surveys
After the desk build, we spoke with a mix of device manufacturers, distributors, hospital procurement and biomedical teams, and clinicians who routinely use portable systems. These conversations helped validate which products are truly purchased as portable units, how replacement cycles behave, and how pricing moves with connectivity, sensor performance, and service bundles. Because this is a global market, feedback was balanced across regions so regional utilization patterns and tender behavior could be represented in the final model.
Distribution of primary research fieldwork respondents
| Company type | Respondent position | Region |
|---|---|---|
| Top tier: 31% | CXOs: 13% | APAC: 47% |
| Mid tier: 52% | Functional/Unit leaders: 39% | EMEA: 31% |
| Smaller Players: 17% | Managers: 48% | Americas: 22% |
Market-Sizing & Forecasting
Sizing starts with a top-down build where country-level demand is reconstructed using the installed base of relevant portable imaging and monitoring devices, expected utilization per device, and an average selling price path adjusted for product mix. Once this is built, we apply selective bottom-up checks using sampled supplier revenue splits, distributor channel checks, and ASP x volume approximations for a few high-visibility device categories. Totals are adjusted only when gaps are consistent across these signals.
Key inputs used in the model include chronic disease prevalence and monitoring penetration, aging population share, hospital and home-care infrastructure indicators, replacement cycles for portable systems, and price mix shifts driven by connectivity and feature upgrades. For forecasting, we used scenario analysis supported by a simple multivariate regression view, where volume and price trajectories were guided by expert consensus on adoption speed, reimbursement stability, and procurement constraints. When bottom-up visibility is weak for smaller local suppliers, the gap is handled through regional share curves tied back to import trends, tender intensity, and the interview-based channel structure.
Data Validation & Update Cycle
Before sign-off, outputs are checked against independent signals such as healthcare spend direction, procedure and screening trends where relevant, and import or shipment patterns for portable device categories. Large variances are investigated at the country and product-family level, and we re-contact respondents when a key assumption like ASP progression or replacement timing appears inconsistent.
A multi-step analyst review follows, covering calculation logic, currency conversions, and year alignment. Reports are refreshed annually, and interim updates are made when material events occur, such as major regulatory actions, reimbursement changes, or supply disruptions. Right before delivery, a final pass is done so clients receive the latest updated view.
Mordor Intelligence's Portable Medical Electronic Products Market Size Compared With Other Published Estimates
Published market sizes for portable medical electronic products can differ even when reports use similar wording, because the device list, end-use settings, and the year used for pricing are not handled the same way. We see spreads mainly tied to whether adjacent therapeutic equipment is treated as in-scope, and whether estimates assume faster price increases from connectivity and software add-ons.
Some external figures also appear to include a wider set of portable medical electronics, including categories beyond diagnostic imaging and monitoring. In Mordor Intelligence, only portable diagnostics imaging and monitoring devices are counted, keeping the total tied to utilization and replacement signals that can be cross-checked across countries.
Benchmark comparison
| Source | Market Size | Gaps in Research Methodology |
|---|---|---|
| Mordor Intelligence | USD 90.84 B (2025) | |
| Industry Publisher A | USD 92.85 B (2025) | This estimate uses a broader segmentation set (device type, connectivity, and portability) without a visible exclusion for non-diagnostic categories, which can pull in additional portable electronics beyond imaging and monitoring. |
| Industry Publisher B | USD 100.20 B (2026) | The headline value is for 2026, so differences can come from one-year price and mix assumptions, and from using a forward-year base that may embed a more aggressive near-term adoption curve. |
Overall, the gap pattern is explained by scope breadth and year alignment more than by arithmetic differences. By keeping the device list consistent and tying volume and pricing to practical demand indicators, the sizing remains traceable to repeatable steps that can be rechecked when new adoption or pricing signals show up.


Key Questions Answered in the Report
What is the current size of the portable medical electronic products market?
The portable medical electronic products market size reached USD 99.05 billion in 2026.
How fast is the portable medical electronic products market expected to grow?
It is projected to expand at a 9.04% CAGR, reaching USD 152.66 billion by 2031.
Which region is growing the quickest?
Asia-Pacific is forecast to post the fastest 11.24% CAGR through 2031, driven by healthcare investment and rising chronic disease incidence.
What product segment holds the largest market share?
Monitoring devices accounted for 45.02% of 2025 revenue, reflecting strong clinical integration.
Why are wearables gaining traction in healthcare?
Wearables enable continuous, unobtrusive monitoring, leading to earlier intervention and aligning with patient preferences for home-based care.
Page last updated on:





