Orthopedic Devices Market Size and Share
Market Overview
| Study Period | 2020 - 2031 |
|---|---|
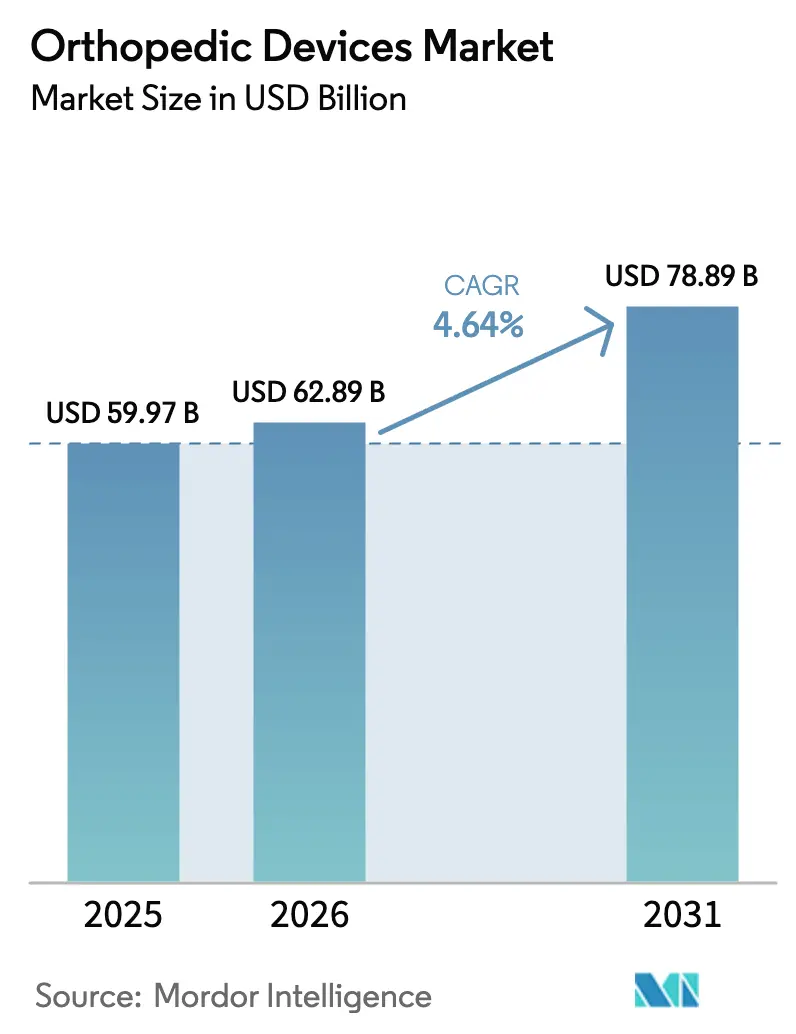
| Market Size (2026) | USD 62.89 Billion |
| Market Size (2031) | USD 78.89 Billion |
| Growth Rate (2026 - 2031) | 4.64% CAGR |
| Fastest Growing Market | Asia Pacific |
| Largest Market | North America |
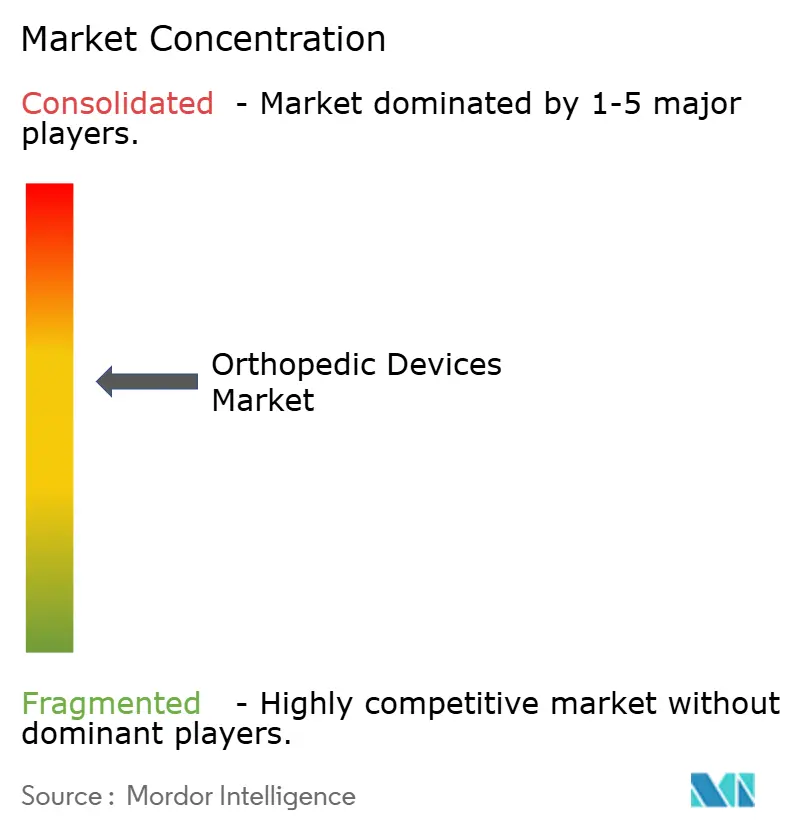
| Market Concentration | Medium |
Major Players *Disclaimer: Major Players sorted in no particular order Image © Mordor Intelligence. Reuse requires attribution under CC BY 4.0. | |
Orthopedic Devices Market Analysis by Mordor Intelligence
The Orthopedic Devices Market size was valued at USD 59.97 billion in 2025 and is estimated to grow from USD 62.89 billion in 2026 to reach USD 78.89 billion by 2031, at a CAGR of 4.64% during the forecast period (2026-2031).
Population aging, rising osteoarthritis prevalence, and rapid adoption of minimally invasive technologies continue to propel the orthopedic devices market, even as reimbursement pressure and raw-material volatility temper overall momentum. Orthobiologics are expanding at a double-digit rate, ambulatory surgical centers (ASCs) are winning procedure share, and robotics plus three-dimensional (3-D) printing are reshaping procurement dynamics. Simultaneously, Asia Pacific’s volume-based procurement is exerting price discipline on premium brands while the European Union’s Medical Device Regulation (MDR) elongates time-to-market for new implants. Market leaders therefore seek margin resilience through bundled robotic platforms, supply-chain localization, and data-enabled aftercare services.
Key Report Takeaways
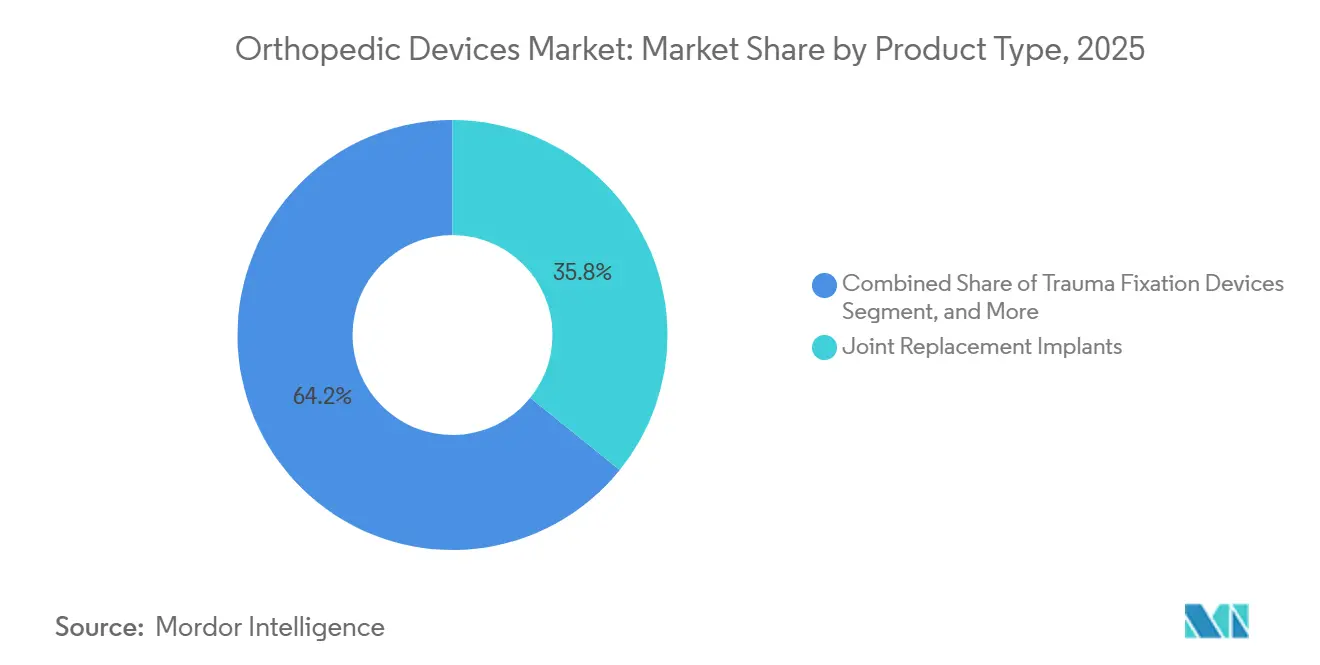
- By product type, joint replacement implants accounted for 35.78% of the orthopedic devices market share in 2025; orthobiologics are projected to advance at a 10.22% CAGR through 2031.
- By technology, conventional implants accounted for 47.83% of the orthopedic devices market in 2025, whereas robotic-assisted and navigation systems are projected to post a 9.84% CAGR through 2031.
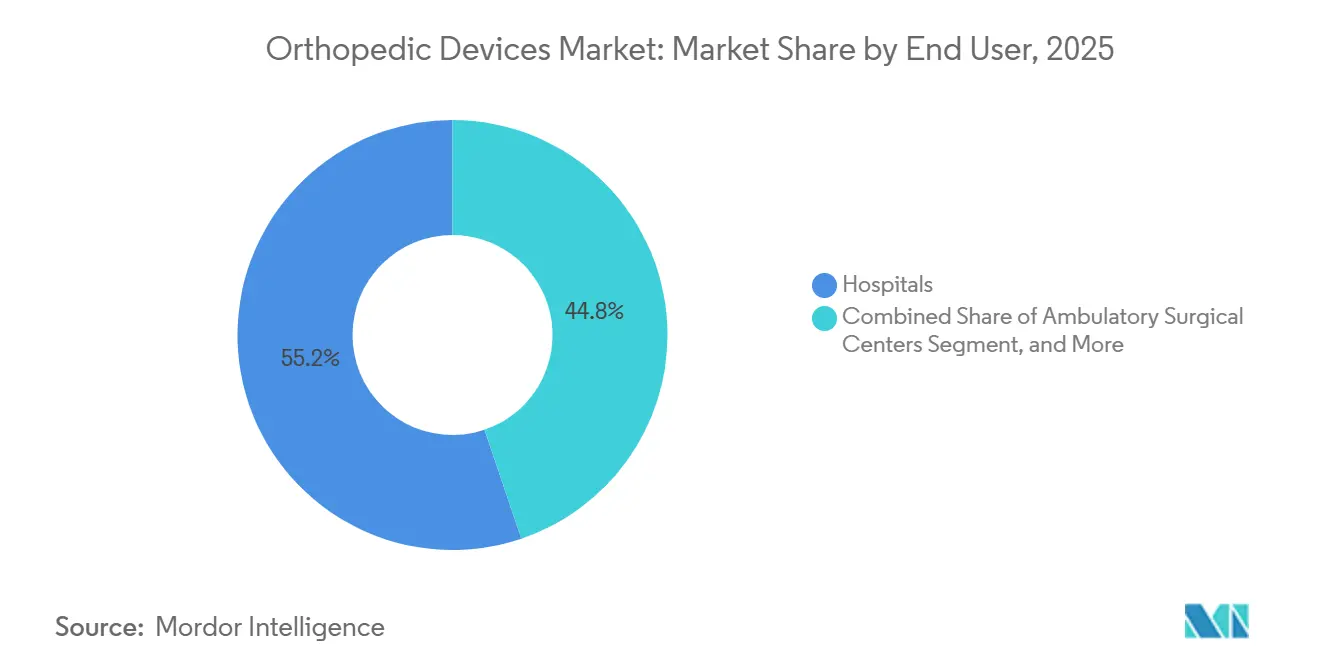
- By end user, hospitals captured 55.18% of the orthopedic devices market in 2025; however, ASCs are forecasted to expand at an 8.86% CAGR through 2031.
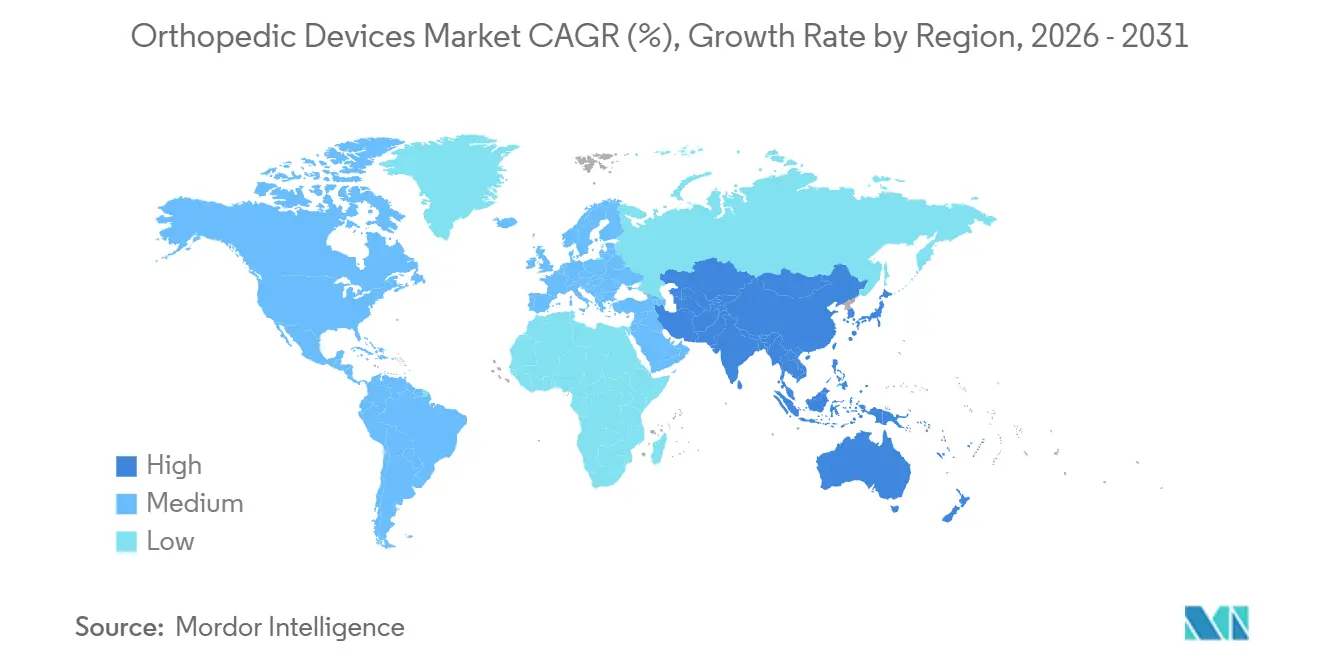
- By geography, North America accounted for 42.64% revenue in 2025, while Asia Pacific is predicted to grow at an 8.76% CAGR through 2031.
Note: Market size and forecast figures in this report are generated using Mordor Intelligence’s proprietary estimation framework, updated with the latest available data and insights as of January 2026.
Market Trends and Insights
Drivers Impact Analysis of Orthopedic Devices Market*
| Driver | (~) % Impact on CAGR Forecast | Geographic Relevance | Impact Timeline |
|---|---|---|---|
| Aging Global Population & Osteoarthritis Prevalence | +1.2% | Global, high in North America, Europe, Japan | Long term (≥ 4 years) |
| Rising Sports Injuries & Trauma Incidents | +0.7% | North America, Europe, growing in APAC cities | Medium term (2-4 years) |
| Technological Advancement in Robotic Surgery & 3-D Printing | +1.0% | North America, EU core, APAC tier-1 hospitals | Medium term (2-4 years) |
| Expansion of Ambulatory Surgical Centers | +0.8% | North America lead, Australia and GCC early uptake | Short term (≤ 2 years) |
| AI-Enabled Smart Implants & Data-Driven Alignment | +0.5% | North America, Germany, United Kingdom, Korea pilots | Long term (≥ 4 years) |
| Cost-Effective Domestic Innovation via Asia Volume-Based Procurement | +0.9% | China, India, spillover to MEA and South America | Medium term (2-4 years) |
| Source: Mordor Intelligence | |||


Aging Global Population & Osteoarthritis Prevalence
The orthopedic devices market benefits structurally from demographic aging. The World Health Organization estimates that by 2030, 1 in 6 people will be 60 years or older, rising to 2.1 billion by 2050.[1]World Health Organization, “Ageing and Health,” WHO.int Osteoarthritis already affects 595 million individuals and is increasing at the fastest rate in East Asia and Western Europe.[2]The Lancet, “Global Burden of Disease Study 2021,” thelancet.com Japan and South Korea post the steepest per-capita implant demand, yet keep reimbursement ceilings tight, prompting tiered product portfolios. China’s elderly population concentrates in tier-1 and tier-2 cities, where private hospitals command premium pricing, while public tenders favor economical domestic implants. Companies that flex their production cost structures to match both channels limit cannibalization and preserve their margins.
Technological Advancement in Robotic Surgery & 3-D Printing
Robotics has shifted from pilot programs to a procurement prerequisite in many high-volume centers. Zimmer Biomet’s ROSA Shoulder and Johnson & Johnson’s VELYS platforms joined Stryker’s Mako and Smith & Nephew’s Cori in 2024, broadening indications from knees and hips to shoulders and partials. Hospitals negotiate bundled robot-implant contracts that lock in multiyear volume, anchoring the orthopedic devices market around integrated ecosystems. Meanwhile, 3-D printing progressed from guides to load-bearing implants; 3D Systems secured clearance for a titanium ankle cage with lattice structures that enhance bone ingrowth.[3]3D Systems, “Titanium Ankle Fusion Cage Cleared by FDA,” 3dsystems.com Distributed additive manufacturing trims inventory yet requires ISO 13485-graded quality controls at local print hubs.
Expansion of Ambulatory Surgical Centers
ASCs deliver orthopedic procedures at lower overhead than hospitals and align with bundled-payment incentives. U.S. ASC large-joint volumes jumped from 10,800 in 2020 to 38,600 in 2023 and are on course to reach 30% of knee and hip replacements by 2029. Implant vendors, therefore, package rapid-recovery protocols, remote monitoring, and just-in-time inventory services to win ASC preference. Europe lags behind because facility licensing is stricter; however, private-equity-backed networks in Spain and the United Kingdom signal an accelerating trend in outpatient uptake.
Cost-Effective Domestic Innovation via Asia Volume-Based Procurement
China and India implement volume-based procurement rounds, which reduce knee-implant prices by 50-70%, triggering a surge in local manufacturing approvals. In 2024 alone, 23 new Chinese orthopedic device licenses were granted. Domestic firms now export low-cost implants to Africa and Southeast Asia, while multinationals localize production to protect their share. The orthopedic devices market thus bifurcates into price-sensitive high-volume tiers and premium technology segments, compelling global manufacturers to nurture dual portfolios.
Restraints Impact Analysis of Orthopedic Devices Market*
| Restraint | (~) % Impact on CAGR Forecast | Geographic Relevance | Impact Timeline |
|---|---|---|---|
| High Device Cost & Reimbursement Gaps | -0.9% | Latin America, MEA, South Asia | Short term (≤ 2 years) |
| Stringent Regulatory Approvals & Product Recalls | -0.6% | North America, EU, emerging in APAC | Medium term (2-4 years) |
| Critical Raw-Material Bottlenecks (Titanium, PEEK, Ceramics) | -0.5% | Global, pronounced in North America & EU | Short term (≤ 2 years) |
| Algorithmic Bias & Cyber-Risk Slowing AI-Device Clearances | -0.3% | North America & EU | Long term (≥ 4 years) |
| Source: Mordor Intelligence | |||
High Device Cost & Reimbursement Gaps
Out-of-pocket spending in emerging markets still exceeds 40%, making advanced implants unaffordable for a large population segment. Brazil’s public system reimburses only BRL 3,000 (approximately USD 600) per knee implant, compared to retail prices of BRL 10,000–15,000 (approximately USD 2,000–3,000). U.S. Medicare reduced total knee arthroplasty payments by 2% in 2025, shifting leverage to group purchasing organizations. Manufacturers respond with stripped-down lines for price-sensitive regions, although gray-market diversion poses a risk to channel conflict.
Stringent Regulatory Approvals & Product Recalls
The MDR backlog extends European launch cycles by 12–24 months, driving some firms to prioritize FDA pathways. High-profile recalls, such as Zimmer Biomet’s hip prosthesis in 2024, heighten scrutiny of metallurgy and tribology, increasing litigation exposure and surgeon caution. Smaller companies strain under compliance costs, hastening consolidation.
*Our forecasts treat driver/restraint impacts as directional, not additive. The impact forecasts reflect baseline growth, mix effects, and variable interactions.
Orthopedic Devices Market Segment Analysis
By Product Type:
Orthobiologics Accelerate Revenue Mix ShiftOrthobiologics outpace the broader orthopedic devices market with a 10.22% CAGR through 2031, gaining traction in spinal fusion and trauma grafting. Joint replacement implants still accounted for the largest share of the orthopedic devices market size at 35.78% in 2025; however, their growth is moderating as mature geographies plateau and price pressure intensifies. Knee implants dominate the market due to the prevalence of osteoarthritis, while reverse total shoulder systems increase the share of the shoulder segment. Manufacturers are pivoting toward ceramic-on-polyethylene bearings in hips to address past concerns with metal-on-metal bearings. Ankle arthroplasty remains a niche procedure, but it is gaining traction thanks to additive-manufactured patient-specific components, such as Paragon 28’s APEX 3D cage.
Surgeons increasingly pair demineralized bone matrix with synthetic substitutes to minimize harvest-site morbidity, thereby amplifying the penetration of orthobiologics. Trauma fixation, fuelled by motorcycle injuries in Asia and sports accidents in North America, adds steady volume, though hospitals bargain aggressively on commodity screws and plates. Spinal implants are categorized into fusion cages and motion-preserving discs, with younger patients generally opting for the latter. Sports-medicine devices, especially bioabsorbable anchors, are riding the trend of active aging. Collectively, these shifts redistribute the orthopedic devices market share toward biologics and high-margin soft-tissue solutions.


By Technology:
Robotics and 3-D Printing Challenge Conventional DominanceConventional implants held 47.83% of orthopedic devices market share in 2025, but robotic-assisted systems are advancing at a 9.84% CAGR, spurred by hospitals seeking reproducible alignment and shorter length-of-stay. A single Mako installation can lock a facility into USD 1 million of proprietary hardware and consistent implant volume over its lifecycle. Three-dimensional printing moves production closer to the point of care, trimming inventory yet placing ISO 13485 compliance obligations on distributed print farms. As additive builds replicate lattice architectures that foster osseointegration, patient-specific load-bearing implants transition from pilot to routine use, expanding orthopedic devices market size for personalized care.
Sensor-enabled implants, such as Zimmer Biomet’s Persona IQ knee, transmit real-time load data, positioning connected devices for long-term monitoring. Payers remain skeptical of the cost-outcome differential, and cybersecurity mandates add expense, yet early adopters cite reduced revision anxiety. AI-driven planning tools face regulatory headwinds in bias validation, which extends clearance timelines but holds promise for future workflow automation. Conventional implants are expected to retain their market share through 2031; however, their relative contribution to the orthopedic devices market growth will diminish as data-rich platforms garner premium reimbursement.
By End User:
ASCs Capture Volume from HospitalsHospitals captured 55.18% of the orthopedic devices market size in 2025, but ASCs expand at an 8.86% CAGR by delivering same-day discharge and bundled-payment efficiency. Vendor-managed inventory and rapid-recovery protocols resonate with ASC operators that seek to minimize working capital and OR turnover times. Specialty clinics, often physician-owned, cherry-pick elective shoulder and sports-medicine procedures, negotiating direct discounts that undercut hospital purchasing groups. Remote monitoring tools are now integrated with post-operative rehab apps, allowing home settings to enter the orthopedic devices market ecosystem for prolonged care.
Despite erosion, hospitals still anchor complex trauma and revision surgeries owing to intensive care capabilities. Yet payer policy pushes primary large-joint replacements into outpatient pathways, obliging device makers to tailor packaging, automation, and digital follow-up for speed and predictability. This re-balancing of care sites diversifies orthopedic devices market revenue streams and demands supply-chain agility.
Geography Analysis
North America Orthopedic Devices Market
North America generated 42.64% of the global revenue in 2025 and remains the most significant contributor to the orthopedic devices market in terms of value. Medicare’s 2025 2% payment cut for total knee arthroplasty tightened hospital margins, prompting faster migration to ASCs and sharpening negotiations with suppliers. Canada’s single-payer model caps implant prices and lengthens waitlists, while Mexico builds medical tourism hubs that lure U.S. patients seeking cost relief.
Broader European Markets
Europe is shaped by MDR bottlenecks that delay new launches and amplify compliance costs, particularly in Germany, the continent’s largest market. The United Kingdom’s National Health Service limits uptake of premium robotics pending conclusive cost-effectiveness data. Southern Europe’s fiscal constraints hinder capital budgets, even as private insurers in Spain and Italy expand coverage. Eastern Europe is pressing for affordable conventional implants, whereas Nordic countries are investing in digital health infrastructure, integrating remote monitoring into joint-replacement pathways.
APAC, MEA and South America Orthopedic Devices Market
Asia Pacific is the fastest-growing geography, with an 8.76% CAGR through 2031, driven by China’s volume-based tenders and India’s expanding middle class, along with streamlining at the CDSCO. Japan’s aging demographic sustains demand for hip and knee replacements despite stringent domestic trial requirements, while Australia’s Therapeutic Goods Administration mirrors FDA standards, serving as a test launch pad. South Korea channels public grants into AI-guided surgery pilots. The Middle East and Africa register uneven progress, with Gulf Cooperation Council nations investing in world-class orthopedics, South Africa balancing a public-private split, and the remainder of the region constrained by reimbursement gaps. South America sees Brazil driving volume but battling affordability, whereas Colombia and Chile gain from insurance penetration. Together, these developments redistribute the orthopedic devices market share toward high-population, value-oriented buyers.

Competitive Landscape
The orthopedic devices market remains moderately concentrated, while regional specialists and agile disruptors fill technology and geographic niches. Stryker’s Mako ecosystem boosts per-case implant volume, anchoring loyalty and creating regulatory scrutiny over bundled contracts. Zimmer Biomet leverages smart-implant telemetry to differentiate follow-up care; Johnson & Johnson integrates imaging, navigation, and trauma plating under its VELYS suite. Smith & Nephew focuses on mid-tier hospital adoption of Cori robotics, and Medtronic broadens its AiBLE spine platform.
Acquisitions underscore the race for scale and capability. Globus Medical’s 2023 merger with NuVasive combined complementary spine portfolios and robotics, reflecting a playbook where mid-tier firms consolidate to fund research and development (R&D) and fulfill global regulatory obligations. Asian manufacturers utilize volume-based procurement to establish a domestic scale, then export cost-optimized implants, challenging incumbents in emerging regions. Orthobiologics and trauma fixation attract venture capital due to their lower capital intensity and faster regulatory pathways, enabling companies such as SeaSpine and Orthofix to specialize without directly confronting large-joint giants.
Intellectual property filings in sensor-embedded hardware and AI software continue to accelerate, but the FDA’s 2024 algorithm-bias guidance has extended approval cycles, favoring corporations with seasoned regulatory teams. Quality-management system certifications, especially ISO 13485 audits under MDR, present cost barriers that hasten further consolidation as smaller entities seek shelter within larger portfolios. As competitive stakes shift to technology ecosystems rather than standalone implants, platform breadth and data integration will define future leadership.
Orthopedic Devices Industry Leaders
Smith & Nephew PLC
Zimmer Biomet
Stryker Corporation
Johnson & Johnson Inc
Medtronic
- *Disclaimer: Major Players sorted in no particular order
Orthopedic Devices Market Companies Covered in this Report
- Arthrex
- B. Braun Melsungen AG (Aesculap)
- Conmed
- Enovis (formerly DJO Global)
- Exactech
- Globus Medical (NuVasive Inc.)
- Integra LifeSciences
- Johnson & Johnson
- LimaCorporate
- Medtronic
- MicroPort Orthopedics
- Orthofix
- Ossur
- Paragon 28
- Seaspine
- Smiths Group
- Spineart
- Stryker
- Wright Medical Group
- Zimmer Biomet

Recent Industry Developments in Orthopedic Devices Market
- March 2025: Stryker introduced the fourth-generation Mako 4 SmartRobotics system at AAOS 2025, supporting procedures for the hip, knee, partial knee, and spine, with over 1.5 million global cases. This enhances precision and efficiency in joint replacements, with Mako Spine in a limited U.S. launch and full rollout expected in H2 2025, alongside Mako Shoulder in limited release.
- March 2025: J&J MedTech highlighted its digital orthopedic solutions at AAOS 2025, including the VELYS Robotic-Assisted Knee (with over 100,000 procedures in 31 countries), KINCISE 2 automated system, and VOLT Plating for trauma. VELYS offers CT-free precision for total/partial knees with superior implant alignment; KINCISE 2 automates repetitive tasks, such as acetabular extraction, to reduce surgeon strain.
- February 2025: Medtronic launched the CD Horizon ModuLeX within its AiBLE ecosystem, a modular screw system designed for spinal deformity procedures that offers intraoperative flexibility. Integrated with navigation, robotics, and AI, it supports comprehensive planning for rods, interbody devices, and bone removal, enhancing efficiency in complex cases, such as pediatric deformities.
- August 2024: DePuy Synthes (J&J) released the TriLEAP system, expanding its extremities portfolio with low-profile titanium plates for forefoot, midfoot, and hindfoot trauma/reconstruction.


Orthopedic Devices Market Report Scope and Research Methodology
Market Definition and Coverage
Our study defines the global orthopedic devices market as all implantable and reusable products that surgically repair, replace, or stabilize human bones and joints, including joint reconstruction systems, trauma fixation plates, spinal instrumentation, arthroscopy tools, and orthobiologics.
Scope exclusion: Assistive braces, external rehabilitation aids, and crutches are not counted.
Segments Covered in This Report
- By Product Type
- Joint Replacement Implants
- Knee Implants
- Hip Implants
- Shoulder Implants
- Ankle Implants
- Spinal Implants
- Fusion Devices
- Non-fusion Devices
- Trauma Fixation Devices
- Plates & Screws
- Intramedullary Nails
- External Fixators
- Sports Medicine Devices
- Arthroscopy Devices
- Soft-Tissue Repair Implants
- Orthobiologics
- Demineralized Bone Matrix
- Synthetic Bone Substitutes
- Stem-Cell Therapy Products
- Other Product Type
- Joint Replacement Implants
- By Technology
- Conventional Implants
- 3-D Printed Patient-specific Implants
- Robotic-Assisted & Navigation Systems
- Smart Sensor-Enabled Implants
- AI-Driven Planning & Measurement Tools
- By End User
- Hospitals
- Ambulatory Surgical Centers
- Specialty Orthopedic Clinics
- Home & Rehabilitation Settings
- By Geography
- North America
- United States
- Canada
- Mexico
- Europe
- Germany
- United Kingdom
- France
- Italy
- Spain
- Rest of Europe
- Asia-Pacific
- China
- Japan
- India
- Australia
- South Korea
- Rest of Asia-Pacific
- Middle East & Africa
- GCC
- South Africa
- Rest of Middle East & Africa
- South America
- Brazil
- Argentina
- Rest of South America
- North America
Data Sources, Market Sizing, and Validation
Primary Research
Mordor analysts interviewed practicing orthopedic surgeons, procurement managers at multi-specialty hospitals, and regional distributors across North America, Europe, and Asia-Pacific. These conversations refined utilization rates, validated emerging procedure mix changes, and tested our draft price curves before numbers were frozen.
Desk Research
We drew foundational inputs from open-access sources such as the U.S. Census aging tables, Eurostat surgery statistics, OECD hospital discharge data, and FDA 510(k) device clearances, in addition to trade-association yearbooks from the International Society of Orthopaedic Surgery and local orthopedic registries. Company 10-Ks, investor decks, and reputable news articles were screened through Dow Jones Factiva for recent ASP shifts and capacity announcements. D&B Hoovers supplied revenue splits that aided device-type weighting. The sources listed remain illustrative; many other datasets informed our evidence stack.
Market-Sizing & Forecasting
We began with a top-down reconstruction that linked hip, knee, and spine procedure volumes to average selling prices, which are then calibrated against export-import shipment values and hospital spend surveys. Supplier roll-ups and sampled hospital channel checks provided a selective bottom-up view to cross-verify totals. Key model drivers include elective surgery backlog clearance pace, geriatric population growth, implant mix shift to titanium, robotics-assisted penetration, average length-of-stay trends, and currency-adjusted ASP progression. A multivariate regression with GDP-per-capita, population 65+, and trauma incidence underpins the 2025-2030 forecast while scenario analysis buffers for reimbursement changes. Data gaps in smaller geographies were bridged by prevalence-based demand pools anchored to regional registry ratios.
Data Validation & Update Cycle
Outputs pass three-step variance checks, peer review, and senior sign-off. We refresh the full model annually and trigger interim updates if regulatory recalls, landmark technology approvals, or +/-10% ASP swings occur.
How Mordor Intelligence's Orthopedic Devices Market Size Compares to Other Published Estimates
Published estimates often differ because each firm chooses unique product baskets, price assumptions, and refresh cadences.
Key gap drivers include whether spinal biologics are bundled, how unreimbursed emerging-market procedures are treated, and the vintage of ASP curves; Mordor's scope mirrors real surgical use while some peers adopt narrow implant lists or apply undiscounted catalog prices.
Benchmark comparison
| Market Size | Anonymized source | Primary gap driver |
|---|---|---|
| USD 60.84 B (2025) | Mordor Intelligence | - |
| USD 51.61 B (2024) | Global Consultancy A | Excludes orthobiologics and uses 2021 ASP benchmarks |
| USD 62.80 B (2024) | Industry Journal B | Counts external braces and averages list prices without regional discounting |
| USD 62.22 B (2024) | Regional Consultancy C | Applies aggressive 5% annual price escalation and no currency adjustment |
In sum, our disciplined product scope, dual-track modeling, and rolling validation give decision-makers a transparent baseline that balances realism with analytical rigor.


Key Questions Answered in the Report
What is the current value of the orthopedic devices market?
The orthopedic devices market size stood at USD 62.89 billion in 2026 and is projected to reach USD 78.89 billion by 2031.
Which product segment is expanding fastest?
Orthobiologics are growing at a 10.22% CAGR, more than double the overall market pace.
How are ambulatory surgical centers influencing demand?
ASCs are expected to capture 30% of U.S. large-joint procedures by 2029 thanks to lower overhead and bundled-payment alignment.
Which region will add the most new procedure volume?
Asia Pacific, led by China and India, is forecast to grow at an 8.76% CAGR as volume-based procurement accelerates implant adoption.
What technology trend is most disruptive?
Robotic-assisted surgery is reshaping procurement, with systems such as Mako and VELYS driving a 9.84% CAGR in the robotics segment.
Page last updated on:


