Hi-Tech Medical Devices Market Size and Share
Market Overview
| Study Period | 2020 - 2031 |
|---|---|
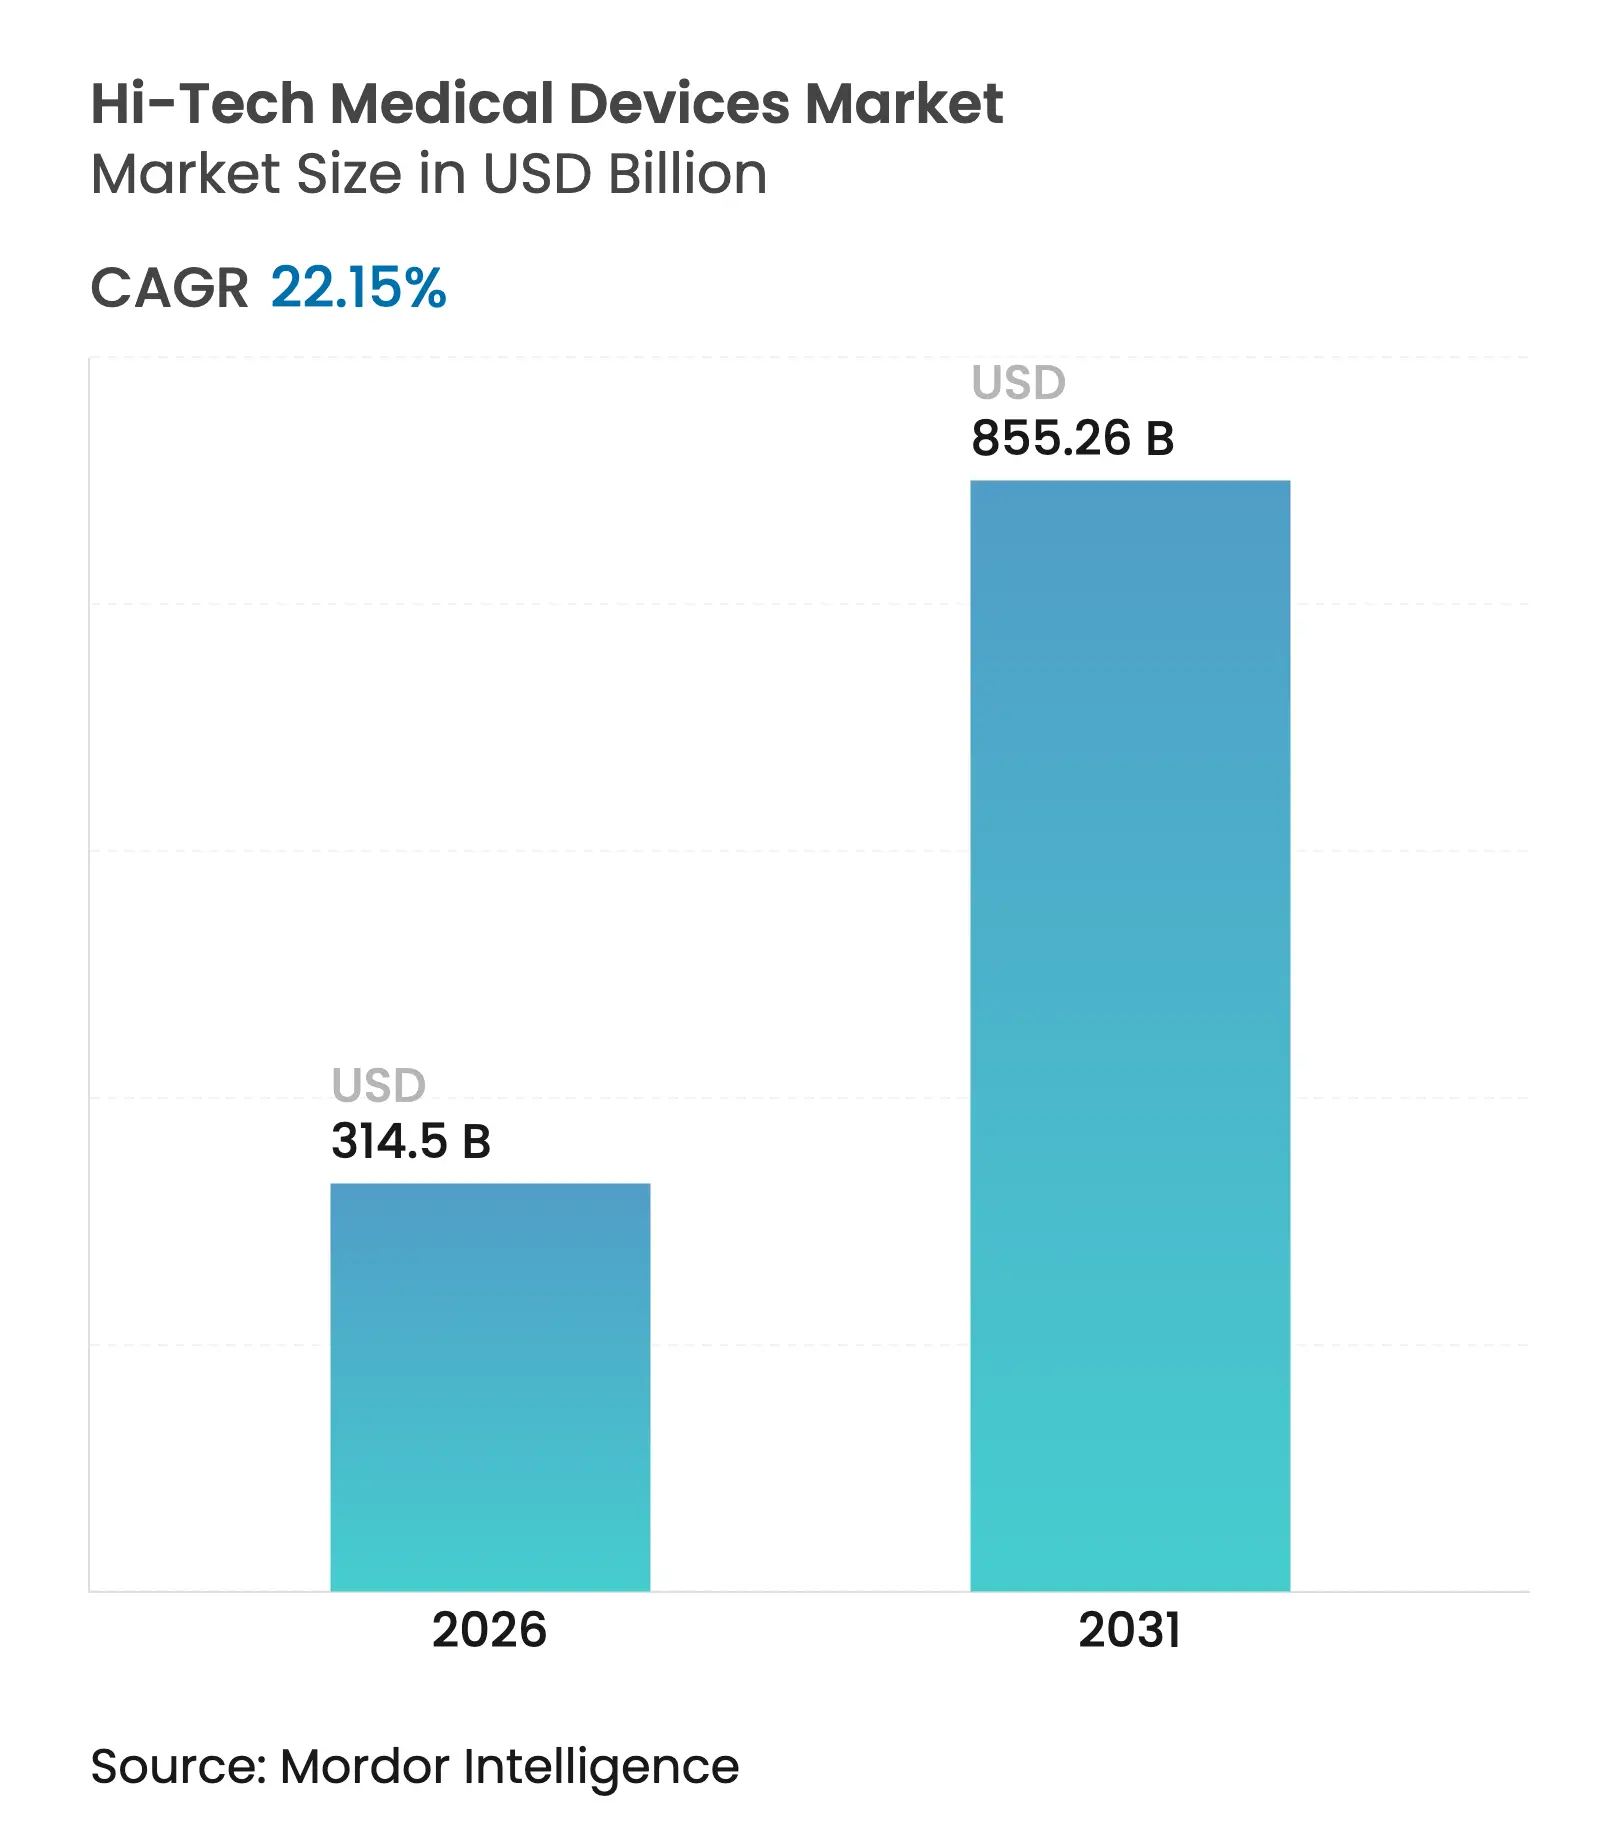
| Market Size (2026) | USD 314.5 Billion |
| Market Size (2031) | USD 855.26 Billion |
| Growth Rate (2026 - 2031) | 22.15 % CAGR |
| Fastest Growing Market | North America |
| Largest Market | Asia Pacific |
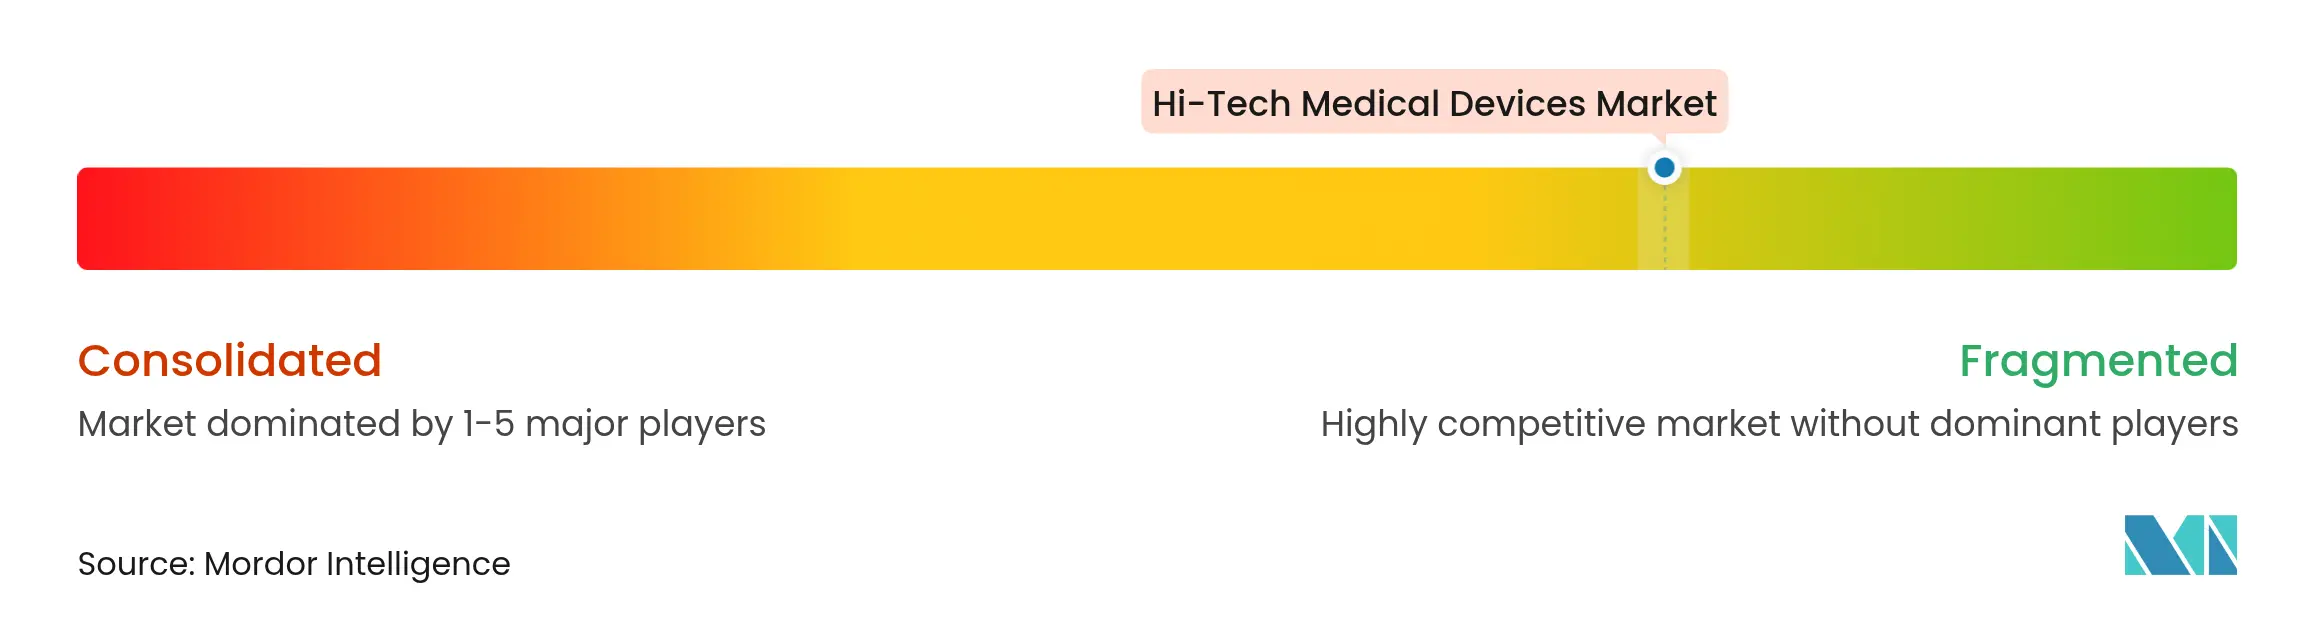
| Market Concentration | Low |
Major Players *Disclaimer: Major Players sorted in no particular order. Image © Mordor Intelligence. Reuse requires attribution under CC BY 4.0. |
Hi-Tech Medical Devices Market Analysis by Mordor Intelligence
The Hi tech medical device market size is expected to grow from USD 257.47 billion in 2025 to USD 314.5 billion in 2026 and is forecast to reach USD 855.26 billion by 2031 at 22.15% CAGR over 2026-2031. Surge momentum in the Hi tech medical device market reflects 5G-enabled real-time monitoring, AI-driven diagnostics, and growing consumer acceptance of connected care. Large retail pharmacies are widening device distribution, while technology companies integrate secure cloud platforms that shorten time-to-treatment cycles. North America anchors investment through strong reimbursement rules, whereas Asia-Pacific accelerates device adoption as national schemes push digital health infrastructure. Cyber-security mandates from the FDA encourage resilient design but lengthen certification timelines, nudging firms toward strategic partnerships to pool regulatory talent. Capital flows favor developers of smart patches, non-invasive biosensors, and hybrid connectivity modules that can shift between BLE, Wi-Fi, and 5G for uninterrupted data flow.
Key Report Takeaways
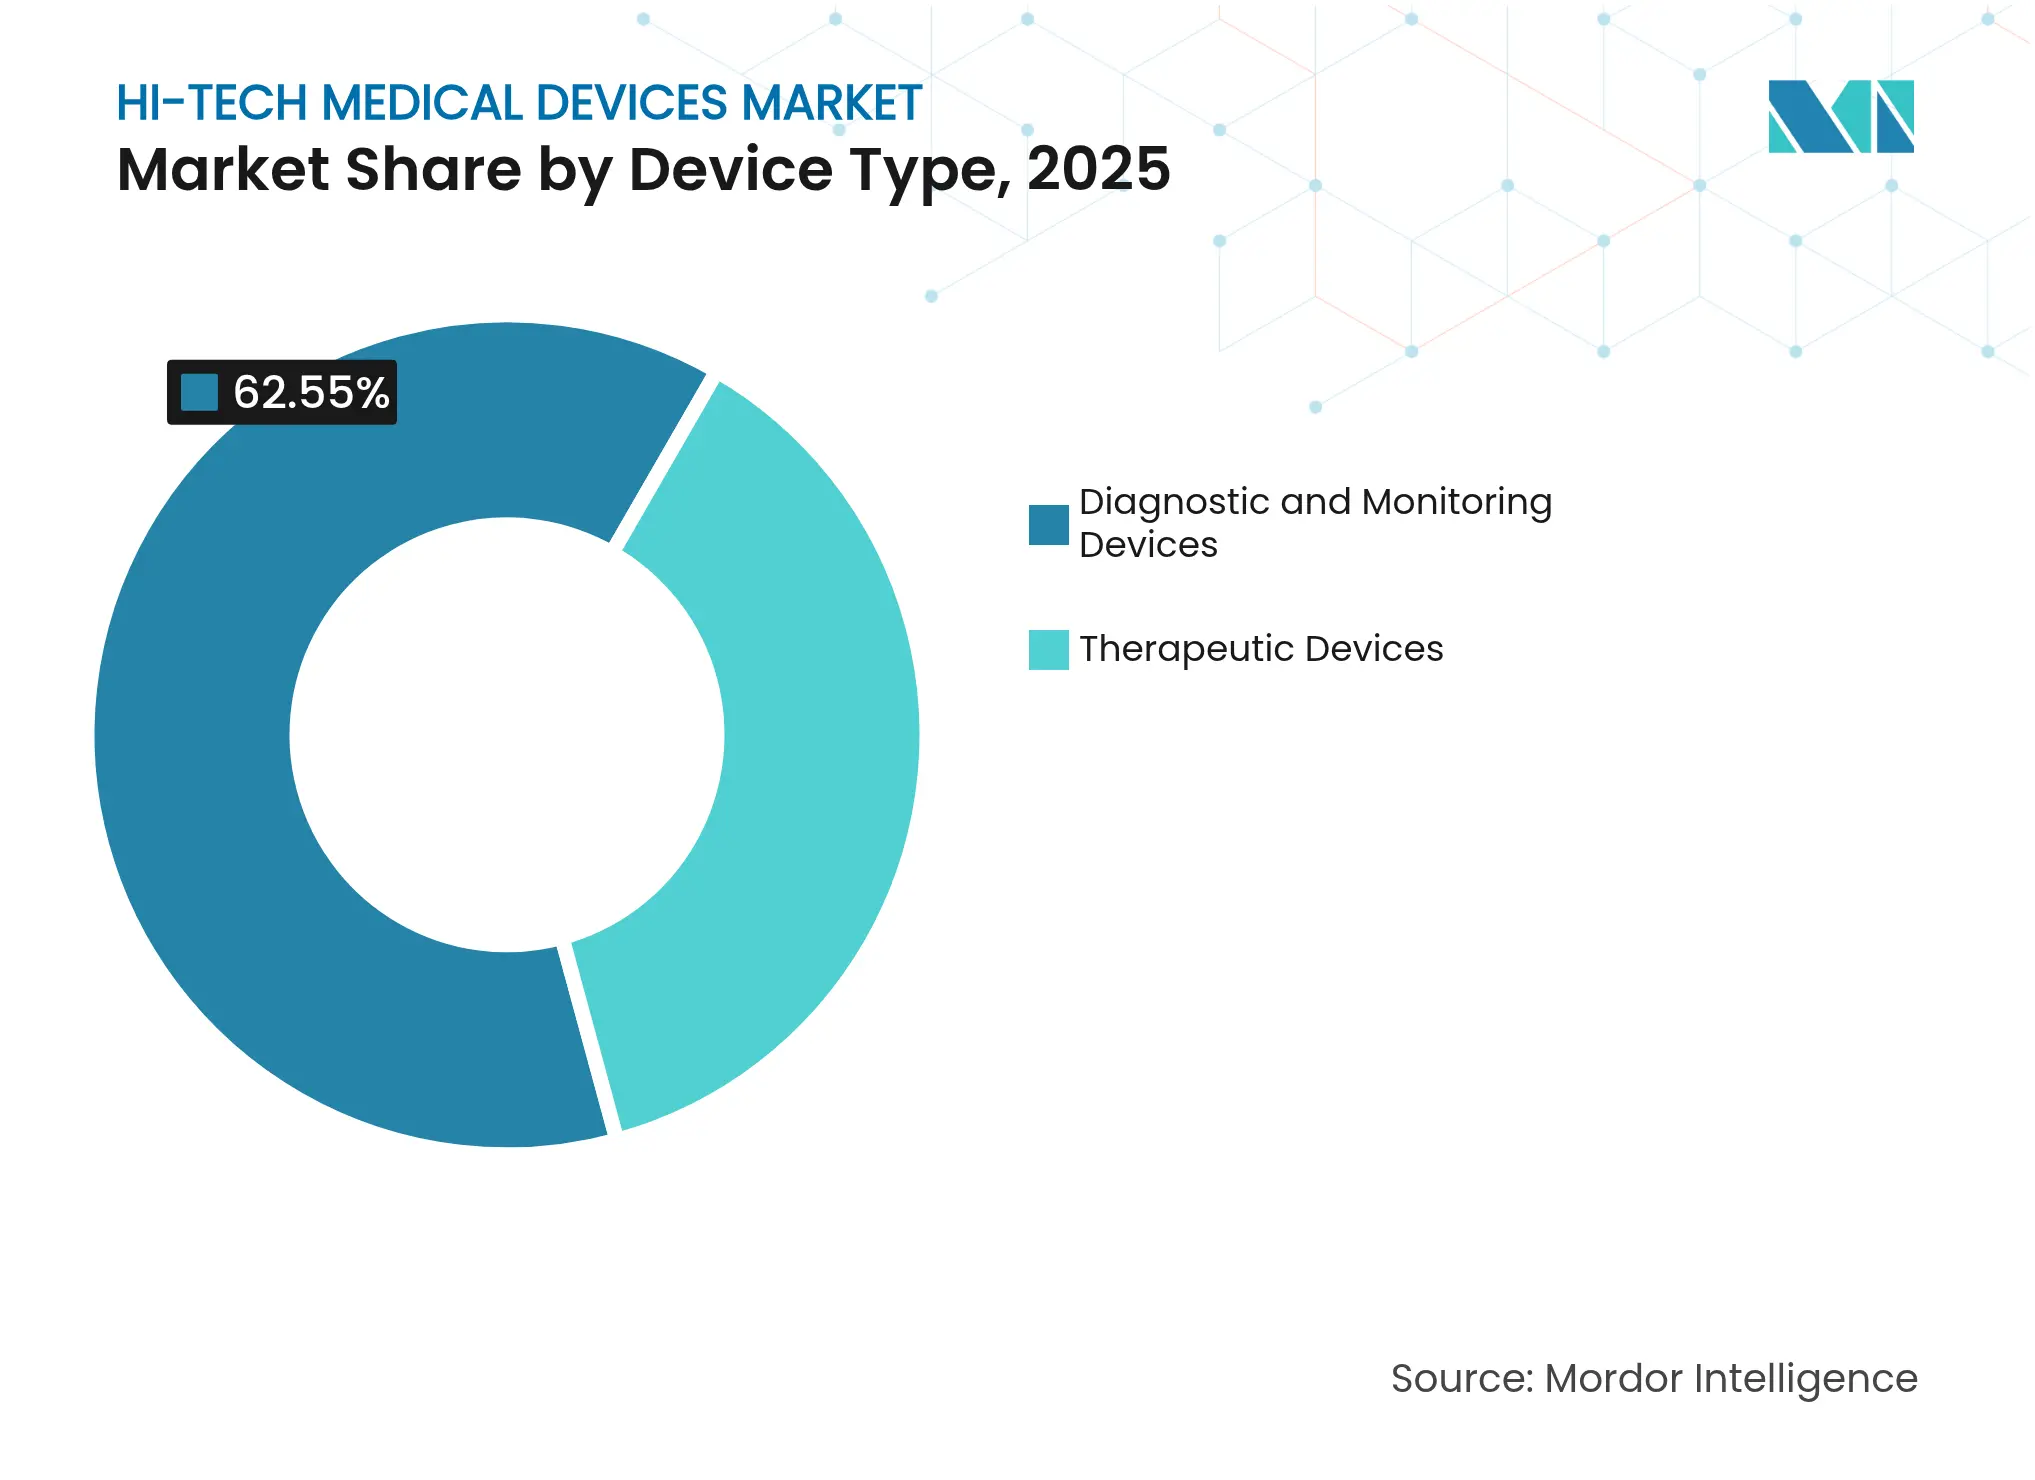
- By device type, diagnostic & monitoring devices led with 62.55% of the Hi tech medical device market share in 2025; therapeutic devices are projected to expand at a 23.32% CAGR through 2031.
- By form factor, smart watches commanded 33.62% share of the Hi tech medical device market size in 2025, while smart patches are advancing at a 22.74% CAGR to 2031.
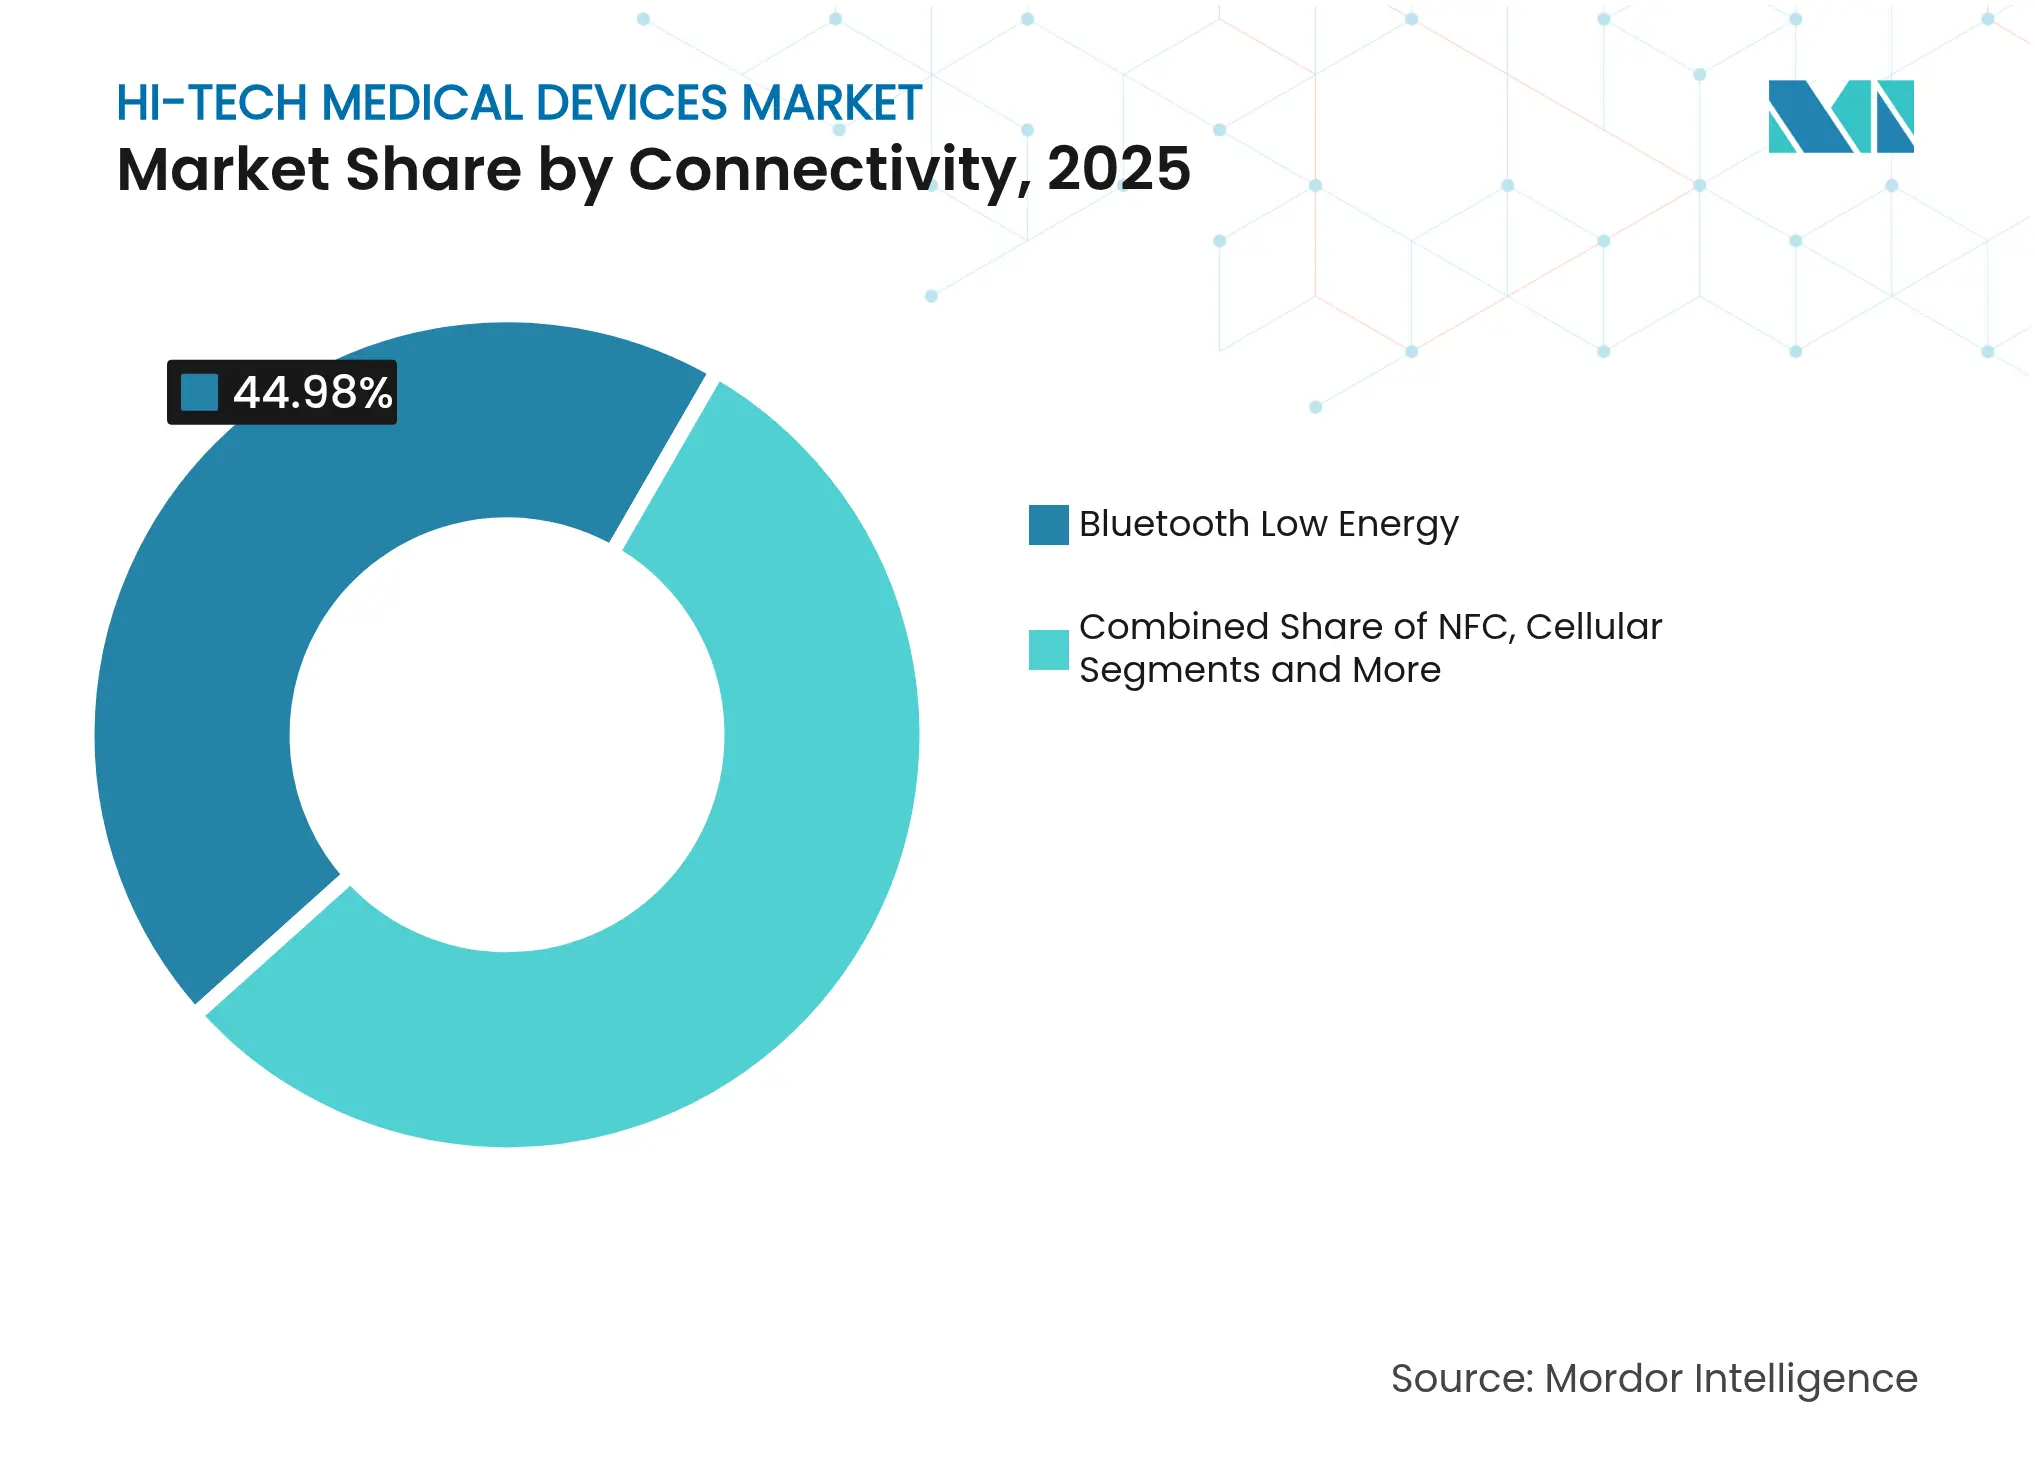
- By connectivity, Bluetooth Low Energy accounted for 44.98% share of the Hi tech medical device market size in 2025; Wi-Fi connectivity is set to grow at 23.42% CAGR between 2026-2031.
- By application, home healthcare captured 58.12% of the Hi tech medical device market size in 2025; remote patient monitoring is forecast to post a 23.02% CAGR through 2031.
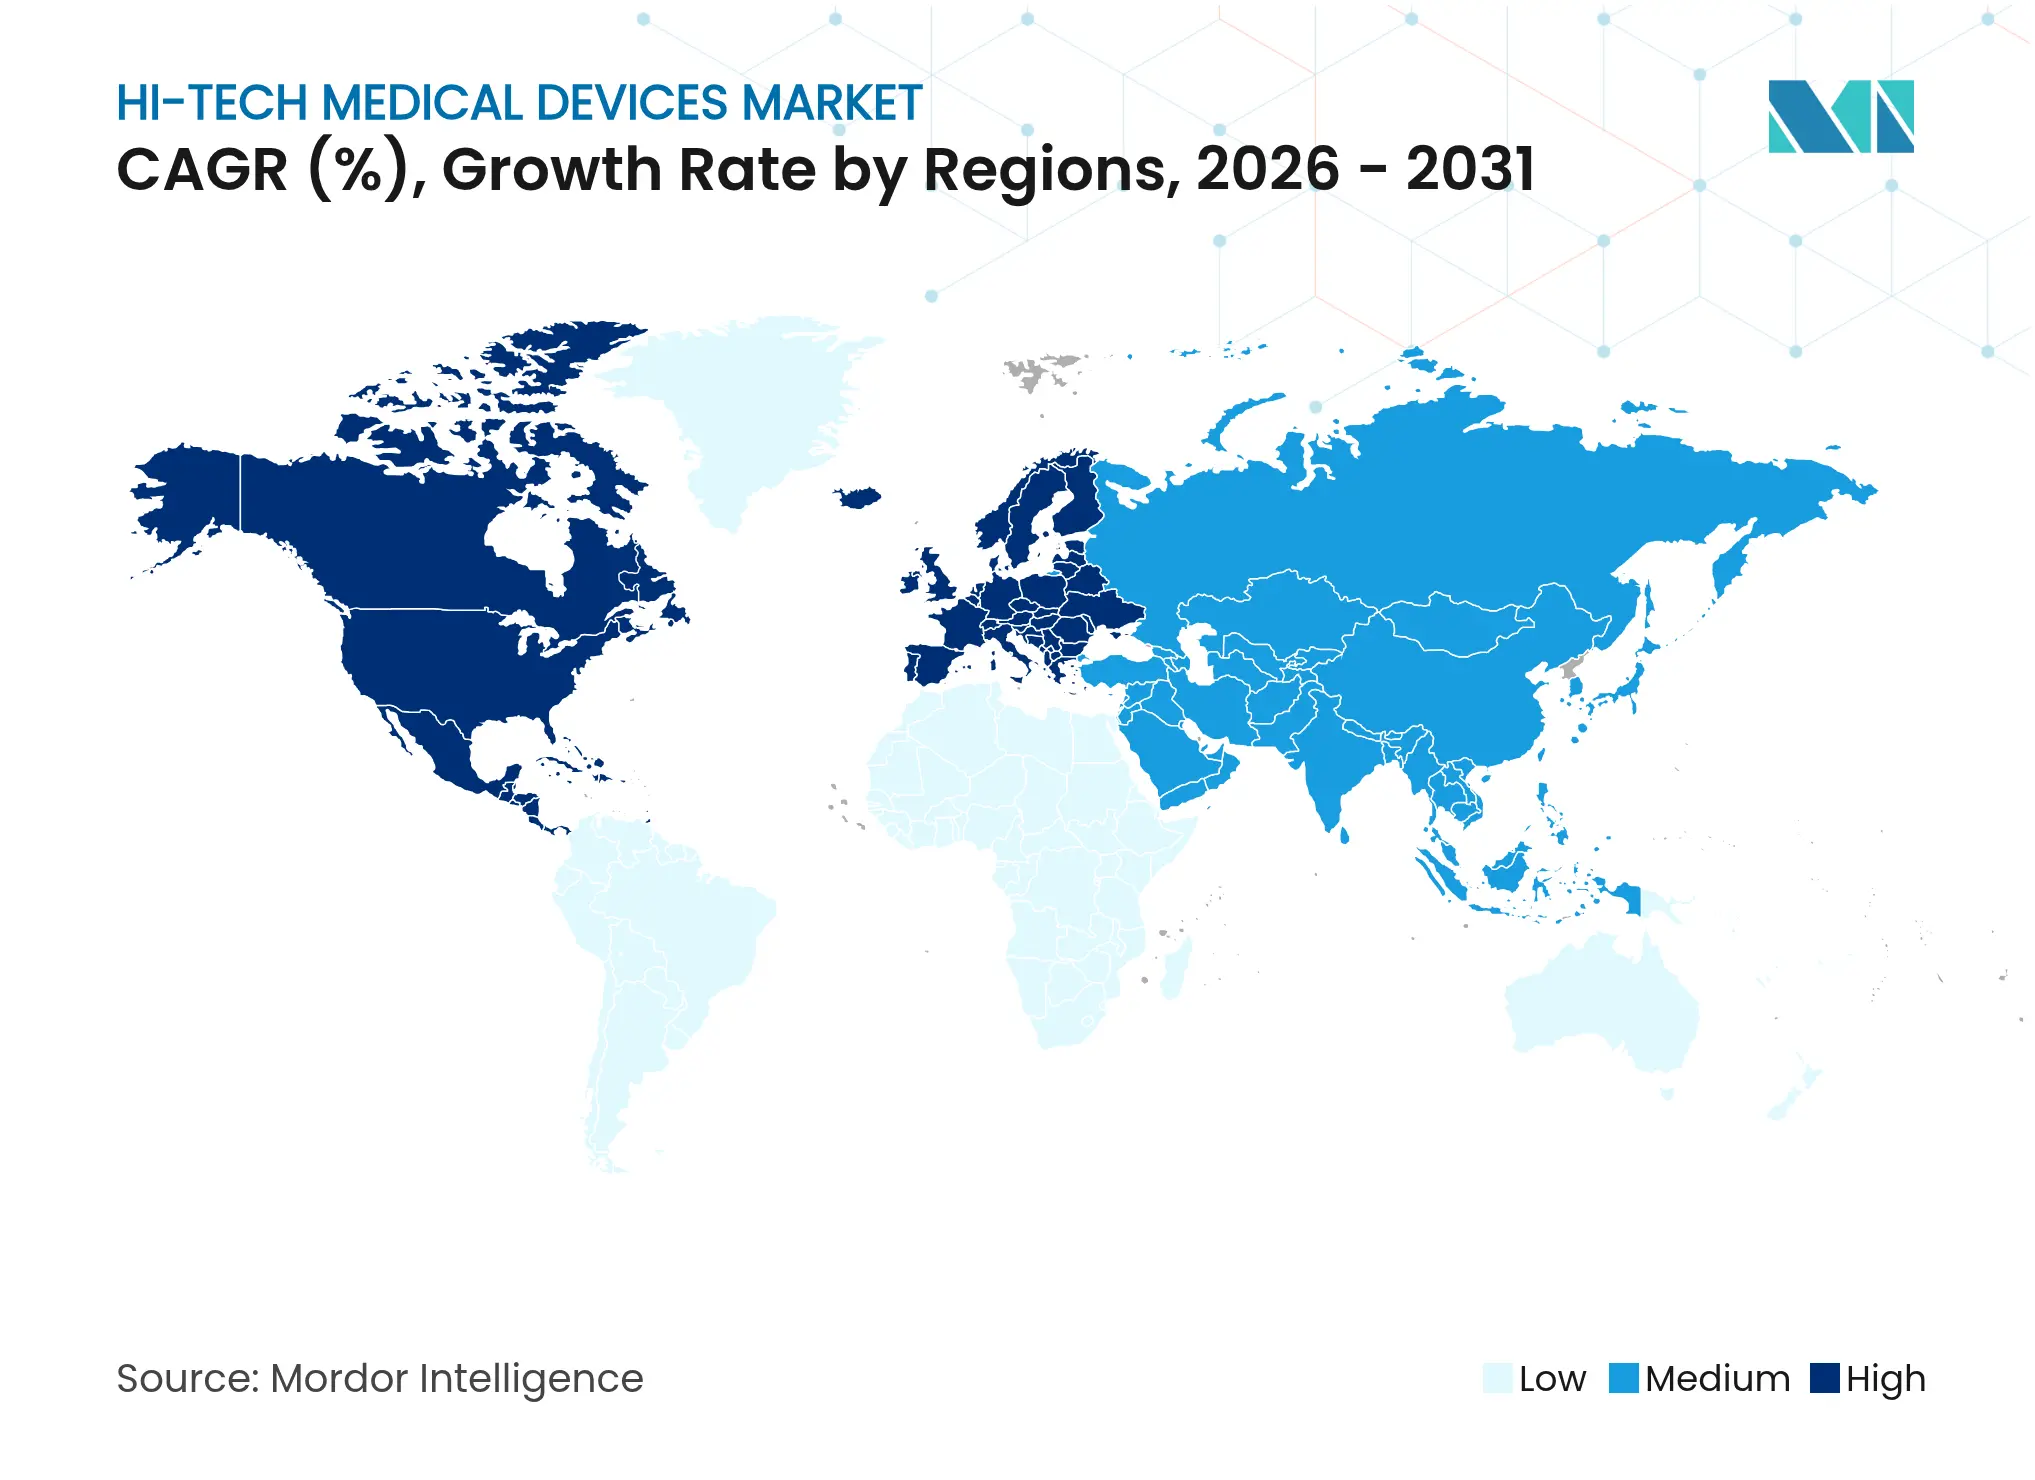
- By geography, North America held 42.15% of the Hi tech medical device market share in 2025, while Asia-Pacific records the fastest regional CAGR at 24.1% to 2031.
Note: Market size and forecast figures in this report are generated using Mordor Intelligence's proprietary estimation framework, updated with the latest available data and insights as of 2026.
Global Hi-Tech Medical Devices Market Trends and Insights
Drivers Impact Analysis
| Driver | (~) % Impact on CAGR Forecast | Geographic Relevance | Impact Timeline | |||
|---|---|---|---|---|---|---|
Ubiquity
of smartphones & LTE/5G connectivity
Ubiquity
of smartphones & LTE/5G connectivity
| +5.5% | Global, with early gains in North America, Europe, Asia-Pacific core | Medium term (2-4 years) |
(~)
% Impact on CAGR Forecast
:
+5.5%
|
Geographic
Relevance
:
Global,
with early gains in North America, Europe, Asia-Pacific core
|
Impact
Timeline
:
Medium
term (2-4 years)
|
Rising
chronic disease burden & preventive care focus
Rising
chronic disease burden & preventive care focus
| +4.9% | Global, particularly pronounced in aging populations of North America, Europe, Japan | Long term (≥ 4 years) | |||
Reimbursement
expansion for remote-patient monitoring
Reimbursement
expansion for remote-patient monitoring
| +3.7% | North America & EU, with spillover to APAC developed markets | Medium term (2-4 years) | |||
Rapid
decline in component cost
Rapid
decline in component cost
| +2.9% | Global, with accelerated impact in price-sensitive emerging markets | Short term (≤ 2 years) | |||
AI-enabled
non-invasive biomarker sensors
AI-enabled
non-invasive biomarker sensors
| +2.5% | North America, EU, with technology transfer to APAC | Long term (≥ 4 years) | |||
Retail
pharmacy & big-box store entry into virtual care
Retail
pharmacy & big-box store entry into virtual care
| +2.0% | North America primarily, with expansion to developed APAC markets | Short term (≤ 2 years) | |||
| Source: Mordor Intelligence | ||||||
Ubiquity of Smartphones & LTE/5G Connectivity
Commercial 5G networks offer sub-100 ms latency that supports telesurgery and continuous streaming from multiple wearables. A gastrectomy performed over 1,700 km using 5G reported 99 ms round-trip delay, confirming clinical safety margins [1]Jingyi Huang, “Ultra-long-distance Telesurgery Using 5G,” World Journal of Surgical Oncology, wjso.biomedcentral.com. Private 5G slices inside hospitals cut radio interference and secure patient data, while edge computing processes alarms locally to avert cloud outages. Success in China demonstrates seamless interoperability across vital-sign patches, infusion pumps, and imaging carts, strengthening the Hi tech medical device market. Momentum toward 6G, targeting 1 million devices per square kilometer, signals exponential scaling of the Hi tech medical device market beyond 2030 [2]Guillaume Le Mintier, “Edge-Enabled 5G Hospitals,” Frontiers in Medicine, frontiersin.org.
Rising Chronic Disease Burden & Preventive Care Focus
Diabetes, heart failure, and COPD programs increasingly deploy year-long continuous glucose monitors and MEMS-based pressure sensors. An implantable CGM that operates for 365 days reduces sensor swap costs while delivering clinical-grade precision. Remote pulmonary artery monitors trimmed heart-failure admissions in multi-center trials. Smart bandages predict infection by analyzing temperature and pH shifts several hours before symptoms surface. AI pattern-recognition models turn this data into actionable alerts, reinforcing preventive care and stimulating demand across the Hi tech medical device market.
Reimbursement Expansion for Remote-Patient Monitoring
CMS added CPT codes that reimburse physiological data collection, device set-up, and clinician review, broadening payment to multiple chronic conditions [3]Centers for Medicare & Medicaid Services, “Remote Physiologic Monitoring CPT Codes,” cms.gov. Health systems report 25% fewer emergency visits when RPM devices underpin post-discharge care. Commercial insurers mirror these policies, embedding RPM metrics into value-based contracts. Rural clinics leverage connected tablets to link patients to urban cardiologists, reinforcing equity in the Hi tech medical device market.
AI-Enabled Non-Invasive Biomarker Sensors
More than 800 AI-enabled devices cleared by the FDA now include sweat-based cortisol detectors and breath-based VOC analyzers. Nanoporous graphene sensors recognize single-protein biomarkers, while adaptive algorithms learn patient-level baselines to slash false positives. Regulatory pilots guide manufacturers on validating algorithms that retrain post-approval, ensuring safety without stifling iteration. Breakthroughs across this domain enlarge clinical use-cases and add breadth to the Hi tech medical device market.
Restraints Impact Analysis
| Restraint | (~) % Impact on CAGR Forecast | Geographic Relevance | Impact Timeline | |||
|---|---|---|---|---|---|---|
High device cost & short replacement cycles
High device cost & short replacement cycles
| -3.9% | Global, with acute impact in price-sensitive emerging markets | Medium term (2-4 years) | (~) % Impact on CAGR Forecast:
-3.9%
|
Geographic Relevance
:
Global, with acute impact in price-sensitive emerging
markets
|
Impact Timeline
:
Medium term (2-4 years)
|
Data-privacy / cyber-security concerns
Data-privacy / cyber-security concerns
| -2.8% | Global, with heightened regulatory focus in North America, EU | Short term (≤ 2 years) | |||
Fragmented regulatory pathways for AI algorithms
Fragmented regulatory pathways for AI algorithms
| -2.1% | Global, with particular complexity in US-EU regulatory divergence | Long term (≥ 4 years) | |||
Sensor accuracy drift in extreme conditions
Sensor accuracy drift in extreme conditions
| -1.6% | Military, first-responder, and extreme climate applications globally | Medium term (2-4 years) | |||
| Source: Mordor Intelligence | ||||||
High Device Cost & Short Replacement Cycles
Advanced monitoring platforms often need upgrades every 5-7 years versus 10-15 years for legacy machines, straining provider budgets. Maintenance consumes 3.1% of capital outlays per year, two-thirds of which is labor. Subscription financing spreads costs across operating budgets, and validated remanufacturing cuts acquisition prices by 40% while keeping OEM specifications intact. Predictive inventory software times procurement to warranty expiries, easing working-capital drag and sustaining the Hi tech medical device market.
Data-Privacy / Cyber-Security Concerns
The PATCH Act obliges every new connected device submission to include a Software Bill of Materials and proof of secure update pathways. Field scans still show 53% of devices carry at least one critical vulnerability, compelling hospitals to isolate equipment within zero-trust networks. Development budgets swell 20% when manufacturers integrate penetration tests and round-the-clock threat monitoring, a hurdle for startups entering the Hi tech medical device market.
Segment Analysis
By Device Type: Therapeutic Solutions Accelerate Shift From Passive Sensing
Diagnostic & monitoring devices hold 62.55% of the Hi tech medical device market share thanks to CGMs, multiparameter patches, and hospital telemetry hubs that automate vital-sign capture. Continuous data improves triage speed, cementing the monitoring segment as the economic anchor of the Hi tech medical device market.
Therapeutic devices, expanding at 23.32% CAGR, propel innovation through closed-loop insulin pumps, smartphone-triggered TENS wearables, and exoskeletons that guide stroke rehabilitation. Military-grade wound-treatment patches merging sensors and microneedle drug reservoirs illustrate convergence of therapy and diagnostics. This growth widens the Hi tech medical device market and incentivizes joint ventures between pharma and device makers.
Note: Segment shares of all individual segments available upon report purchase
By Form Factor: Smart Patches Unlock Continuous Invisible Care
Smart watches retained 33.62% of the Hi tech medical device market size in 2025 due to entrenched ecosystems and FDA-cleared ECG functions. Large screens facilitate user engagement, reinforcing compliance.
Smart patches, growing at 22.74% CAGR, integrate flexible circuits, week-long batteries, and biocompatible adhesives that permit shower-proof wear. Hospital pilots log adherence rates above 90%, surpassing wrist-based devices. Fitness bands and smart rings serve niche wellness markets, while fiber-computer garments track respiration across thoracic zones. Each new form factor deepens penetration and widens the Hi tech medical device market.
By Connectivity: BLE Balances Power Budget and Security
Bluetooth Low Energy comprises 44.98% of the Hi tech medical device market size, operating for months on coin-cell batteries while satisfying HIPAA-grade encryption.
Wi-Fi modules climb at 23.42% CAGR as video-heavy tele-rehab sessions demand 150 Mbps throughput. Cellular 5G fallback protects life-critical monitoring in transit ambulances, and NFC enables tap-to-pair workflows inside operating rooms. Hybrid radios equip devices to switch links seamlessly, boosting reliability and fortifying the Hi tech medical device market.
Note: Segment shares of all individual segments available upon report purchase
By Application: Home Healthcare Dominates Decentralized Care
Home healthcare commands 58.12% of the Hi tech medical device market size because payers reimburse hospital-at-home programs that curb readmission penalties.
Remote patient monitoring grows at 23.02% CAGR under value-based contracts rewarding early intervention. Professional sports franchises adopt sensor vests to avert overtraining injuries, while defense forces test heat-stress monitors to safeguard troops U.S. Army. Device makers thus diversify across consumer, clinical, and tactical niches inside the Hi tech medical device market.
Geography Analysis
North America captured 42.15% of the Hi tech medical device market in 2025 on the back of broad CMS reimbursement, mature 5G coverage, and robust venture funding ecosystems. The FDA’s streamlined De Novo and Safer Technologies Program shave months off clearance timelines, supporting sustained product pipelines. U.S. health systems such as CVS-owned Oak Street Health embed smart patches in chronic-care pathways, underscoring ecosystem depth. Canada’s single-payer system procures RPM bundles to manage heart-failure cohorts, evidencing public-sector pull.
Asia-Pacific represents the fastest rising arena with 24.1% CAGR, powered by China’s Made in China 2025 incentives that finance domestic sensor fabrication lines. Japan’s super-aged society finances home ECG services to curb inpatient costs, while South Korea exploits nationwide gigabit networks for cloud robotics rehabilitation. India’s Ayushman Bharat scheme widens insurance coverage, stimulating affordable patch designs priced below USD 50. Australia’s Therapeutic Goods Administration accelerates special-access routes for AI devices, facilitating cross-border launches that enlarge the Hi tech medical device market.
Europe grows steadily despite compliance friction from the Medical Device Regulation and forthcoming AI Act. Germany funds DiGA-certified digital therapeutics, placing connected patches on statutory reimbursement lists. France’s Capteur initiative subsidizes wearable heart monitors for primary-care clinics, while the UK’s AI Airlock sandbox welcomes algorithmic titration engines. Pan-EU harmonization by 2027 promises single-audit routes, eventually smoothing supply chains that feed the Hi tech medical device market.

Competitive Landscape
Market Concentration
Apple pairs consumer reach with medical validation through watch-based ECG and pulse-oximetry that won FDA Class II clearance. Vision Pro trials for orthopedic templating illustrate vertical expansion, ensuring the firm’s anchor role in the Hi tech medical device market.
Medtronic, Abbott, and Dexcom leverage decades of clinical trials and reimbursement dossiers to secure formulary slots. Medtronic’s Guardian IV CGM integrates predictive alerts, while Abbott’s Lingo explores glucose and ketone programs for wellness segments. Strategic alliances link device APIs to EHR vendors, enhancing data liquidity across the Hi tech medical device market.
Entrants such as Huawei, Xiaomi, and Whoop pursue niche differentiation via sleep metrics, stress algorithms, and subscription models. Retail titans including Walmart pilot in-aisle diagnostics kiosks, diverting USD 64 billion in potential revenue from traditional providers. Moderate concentration persists because regulatory complexity hinders rapid commoditization, keeping intellectual-property and clinical-evidence moats intact across the Hi tech medical device market.
Hi-Tech Medical Devices Industry Leaders

*Disclaimer: Major Players sorted in no particular order
Recent Industry Developments
- June 2024: Apple released watchOS 11 featuring upgraded sensor suites and algorithmic health-trend coaching.
- February 2024: Samphire Neuroscience raised USD 2.25 million to launch Nettle, a medical-grade neurostimulation wearable employing tDCS.
- October 2023: Google debuted Pixel Watch 2 with extended battery life and an FDA-cleared heart-rate engine delivering clinician-grade accuracy.
- April 2023: Honeywell unveiled a skin-patch vital-sign system that streams continuous measurements to clinicians via mobile dashboards.
Table of Contents for Hi-Tech Medical Devices Industry Report
1. Introduction
- 1.1Study Assumptions & Market Definition
- 1.2Scope of the Study
2. Research Methodology
3. Executive Summary
4. Market Landscape
- 4.1Market Overview
- 4.2Market Drivers
- 4.2.1Ubiquity of smartphones & LTE/5G connectivity
- 4.2.2Rising chronic disease burden & preventive care focus
- 4.2.3Reimbursement expansion for remote-patient monitoring
- 4.2.4Rapid decline in component cost
- 4.2.5AI-enabled non-invasive biomarker sensors
- 4.2.6Retail pharmacy & big-box store entry into virtual care
- 4.3Market Restraints
- 4.3.1High device cost & short replacement cycles
- 4.3.2Data-privacy / cyber-security concerns
- 4.3.3Fragmented regulatory pathways for AI algorithms
- 4.3.4Sensor accuracy drift in extreme conditions
- 4.4Value / Supply-Chain Analysis
- 4.5Regulatory Landscape
- 4.6Technological Outlook
- 4.7Porter’s Five Forces Analysis
- 4.7.1Threat of New Entrants
- 4.7.2Bargaining Power of Buyers/Consumers
- 4.7.3Bargaining Power of Suppliers
- 4.7.4Threat of Substitute Products
- 4.7.5Intensity of Competitive Rivalry
5. Market Size & Growth Forecasts (Value)
- 5.1By Device Type
- 5.1.1Diagnostic & Monitoring Devices
- 5.1.1.1Vital-sign Monitors
- 5.1.1.2Continuous Glucose Monitors
- 5.1.1.3Multi-parameter Patches
- 5.1.2Therapeutic Devices
- 5.1.2.1Pain-management Wearables
- 5.1.2.2Rehabilitation Exoskeletons
- 5.1.2.3Drug-delivery Patches
- 5.2By Form Factor
- 5.2.1Smart Watches
- 5.2.2Fitness Bands
- 5.2.3Smart Patches
- 5.2.4Smart Clothing
- 5.2.5Smart Rings
- 5.2.6AR / VR Headsets
- 5.3By Connectivity
- 5.3.1Bluetooth Low Energy
- 5.3.2Cellular (4G/5G)
- 5.3.3NFC
- 5.3.4Wi-Fi
- 5.4By Application
- 5.4.1Sports & Fitness
- 5.4.2Remote Patient Monitoring
- 5.4.3Home Healthcare
- 5.4.4Disease-specific Management
- 5.4.5Military & First-Responder Health
- 5.5By Geography
- 5.5.1North America
- 5.5.1.1United States
- 5.5.1.2Canada
- 5.5.1.3Mexico
- 5.5.2Europe
- 5.5.2.1Germany
- 5.5.2.2United Kingdom
- 5.5.2.3France
- 5.5.2.4Italy
- 5.5.2.5Spain
- 5.5.2.6Rest of Europe
- 5.5.3Asia-Pacific
- 5.5.3.1China
- 5.5.3.2Japan
- 5.5.3.3India
- 5.5.3.4Australia
- 5.5.3.5South Korea
- 5.5.3.6Rest of Asia-Pacific
- 5.5.4Middle East & Africa
- 5.5.4.1GCC
- 5.5.4.2South Africa
- 5.5.4.3Rest of Middle East & Africa
- 5.5.5South America
- 5.5.5.1Brazil
- 5.5.5.2Argentina
- 5.5.5.3Rest of South America
6. Competitive Landscape
- 6.1Market Concentration
- 6.2Market Share Analysis
- 6.3Company Profiles (includes Global-level Overview, Market-level Overview, Core Segments, Financials, Strategic Info, Market Rank/Share, Products & Services, Recent Developments)
- 6.3.1Apple Inc.
- 6.3.2Alphabet Inc. (Fitbit & Google Health)
- 6.3.3Samsung Electronics Co. Ltd.
- 6.3.4Huawei Technologies Co. Ltd.
- 6.3.5Garmin Ltd.
- 6.3.6Dexcom Inc.
- 6.3.7Abbott Laboratories
- 6.3.8Medtronic plc
- 6.3.9Philips Healthcare
- 6.3.10OMRON Healthcare
- 6.3.11iRhythm Technologies
- 6.3.12Masimo Corporation
- 6.3.13Withings SA
- 6.3.14BioIntelliSense Inc.
- 6.3.15Xiaomi Corporation
- 6.3.16Polar Electro Oy
- 6.3.17Whoop Inc.
- 6.3.18Biofourmis Inc.
7. Market Opportunities & Future Outlook
- 7.1White-space & Unmet-need Assessment
Research Methodology Framework and Report Scope
Market Definitions and Key Coverage
Segmentation Overview
- By Device Type
- Diagnostic & Monitoring Devices
- Vital-sign Monitors
- Continuous Glucose Monitors
- Multi-parameter Patches
- Vital-sign Monitors
- Therapeutic Devices
- Pain-management Wearables
- Rehabilitation Exoskeletons
- Drug-delivery Patches
- Pain-management Wearables
- Diagnostic & Monitoring Devices
- By Form Factor
- Smart Watches
- Fitness Bands
- Smart Patches
- Smart Clothing
- Smart Rings
- AR / VR Headsets
- Smart Watches
- By Connectivity
- Bluetooth Low Energy
- Cellular (4G/5G)
- NFC
- Wi-Fi
- Bluetooth Low Energy
- By Application
- Sports & Fitness
- Remote Patient Monitoring
- Home Healthcare
- Disease-specific Management
- Military & First-Responder Health
- Sports & Fitness
- By Geography
- North America
- United States
- Canada
- Mexico
- United States
- Europe
- Germany
- United Kingdom
- France
- Italy
- Spain
- Rest of Europe
- Germany
- Asia-Pacific
- China
- Japan
- India
- Australia
- South Korea
- Rest of Asia-Pacific
- China
- Middle East & Africa
- GCC
- South Africa
- Rest of Middle East & Africa
- GCC
- South America
- Brazil
- Argentina
- Rest of South America
- Brazil
- North America
Detailed Research Methodology and Data Validation
Primary Research
Desk Research
Market-Sizing & Forecasting
Data Validation & Update Cycle
Why Mordor's Hi-Tech Medical Devices Baseline Deserves Trust
Benchmark comparison
| Market Size | Anonymized source | Primary gap driver | ||
|---|---|---|---|---|
USD 257.47 B (2025) | Mordor Intelligence | - | Anonymized source:Mordor Intelligence | Primary gap driver:- |
USD 147.3 B (2024) | Global Consultancy A | Omits therapeutic patches and limits geography to North America and Europe | ||
USD 91.22 B (2022) | Data Service B | Uses pre-pandemic base then applies uniform CAGR without region-specific adoption filters |