Active Pharmaceutical Ingredients CDMO Market Size and Share
Market Overview
| Study Period | 2020 - 2031 |
|---|---|
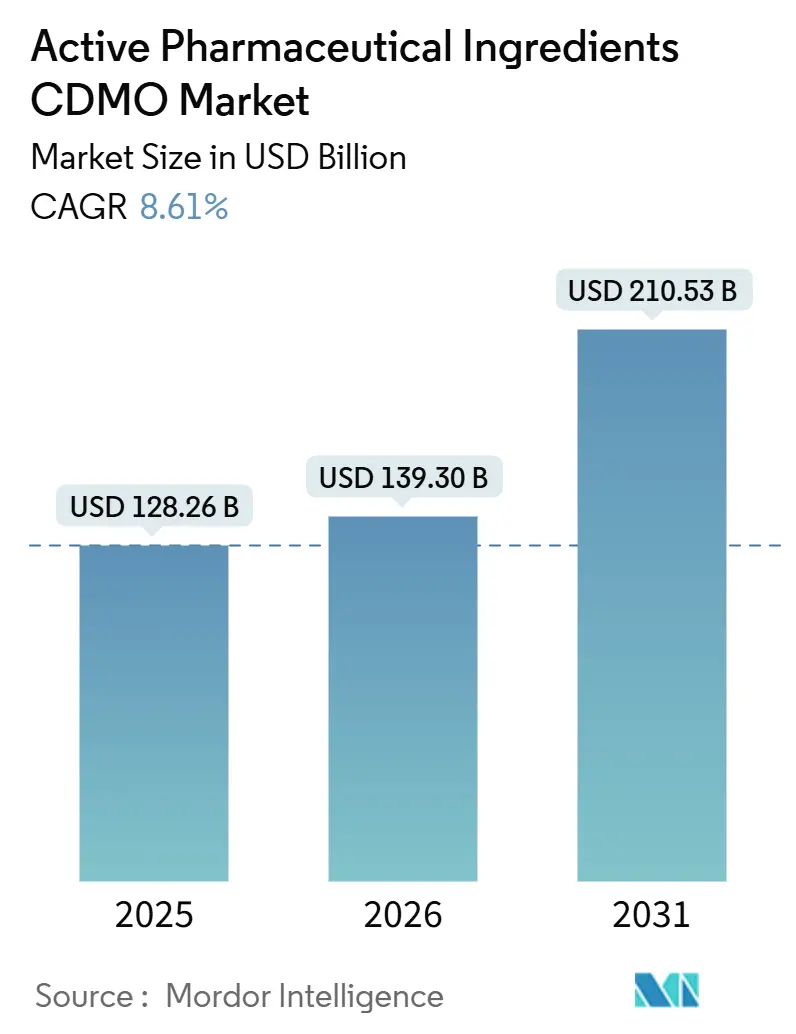
| Market Size (2026) | USD 139.30 Billion |
| Market Size (2031) | USD 210.53 Billion |
| Growth Rate (2026 - 2031) | 8.61% CAGR |
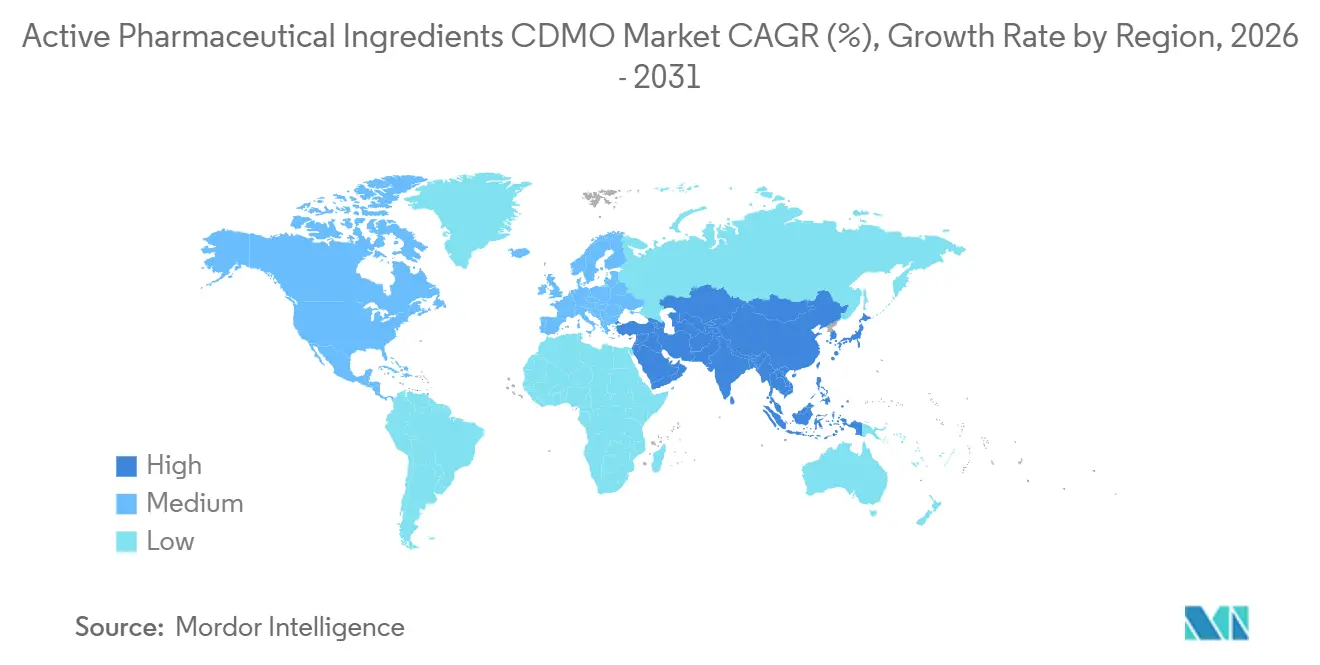
| Fastest Growing Market | Asia-Pacific |
| Largest Market | Asia-Pacific |
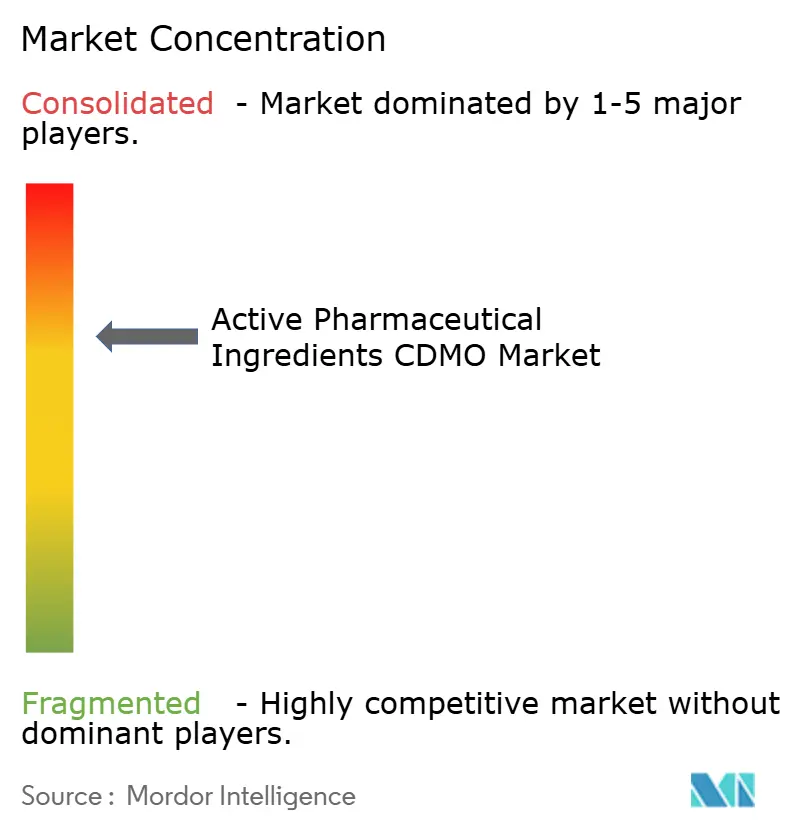
| Market Concentration | Medium |
Major Players *Disclaimer: Major Players sorted in no particular order Image © Mordor Intelligence. Reuse requires attribution under CC BY 4.0. | |
Active Pharmaceutical Ingredients CDMO Market Analysis by Mordor Intelligence
The Active Pharmaceutical Ingredients CDMO Market size is expected to grow from USD 128.26 billion in 2025 to USD 139.30 billion in 2026 and is forecast to reach USD 210.53 billion by 2031 at 8.61% CAGR over 2026-2031.
Pharmaceutical sponsors are moving toward variable-cost outsourcing as clinical pipelines swell, regulatory oversight tightens, and sustainability mandates gain legal force in major markets. The BIOSECURE Act, passed by the U.S. House in September 2024, is already reshaping geographic sourcing patterns as buyers diversify away from China while India retains the largest share of U.S. FDA Drug Master File (DMF) filings. Capacity constraints for complex peptides—especially GLP-1 receptor agonists—have pushed leading contractors such as Bachem to commit CHF 600 million (USD 680 million) to new European plants in 2024-2025. Meanwhile, European carbon-disclosure rules effective in 2027 are accelerating the adoption of continuous-flow and biocatalytic processes that cut solvent use and greenhouse gas emissions, creating first-mover advantages for technology-forward providers.
Key Report Takeaways
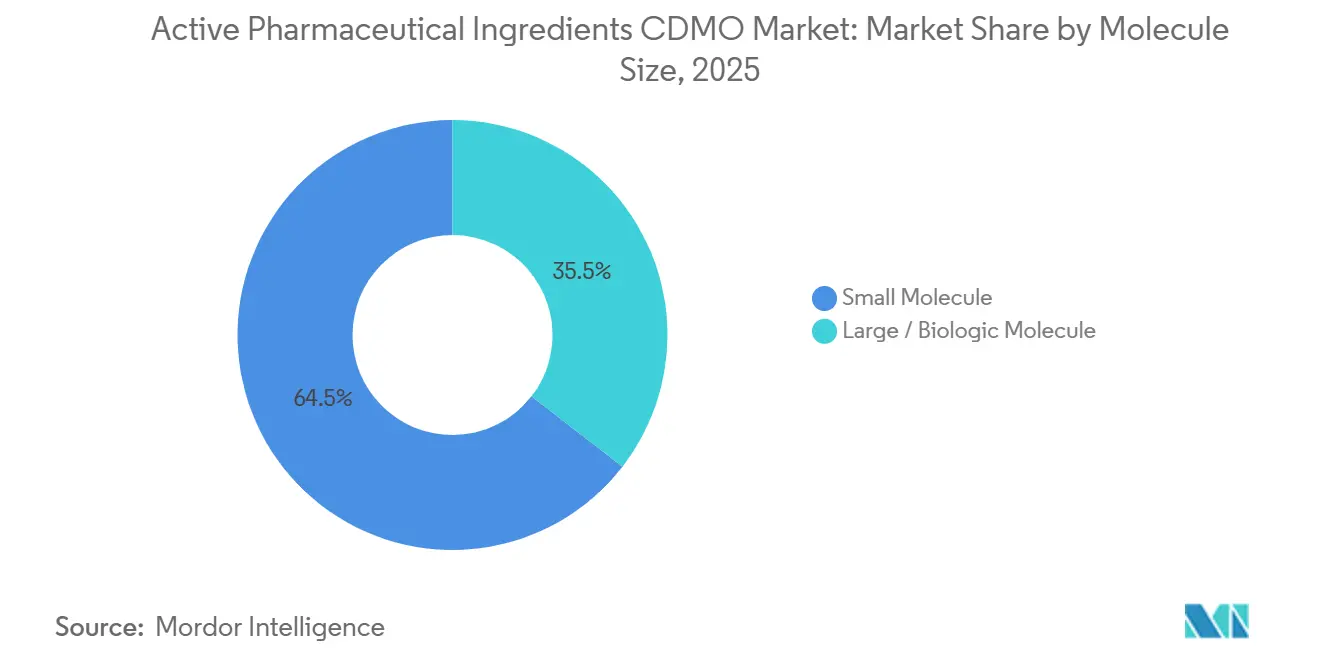
- By molecule size, small molecule led with 64.51% revenue share in 2025, while large / biologic molecule is projected to advance at a 10.54% CAGR from 2026 to 2031.
- By synthesis type, synthetic chemical accounted for 71.54% share in 2025 and biological (fermentation / cell culture) is forecast to record a 10.88% CAGR through 2031.
- By API complexity, standard-potency APIs captured 75.76% share in 2025, whereas highly-potent APIs (HPAPIs) are expected to grow at an 11.32% CAGR to 2031.
- By service type, cGMP scale-up & commercial manufacturing held 65.76% share in 2025, while integrated end-to-end services are set to expand at a 10.33% CAGR over the same period.
- By therapeutic area, oncology represented 33.76% share in 2025 and immunology & rare diseases are projected to see an 11.76% CAGR through 2031.
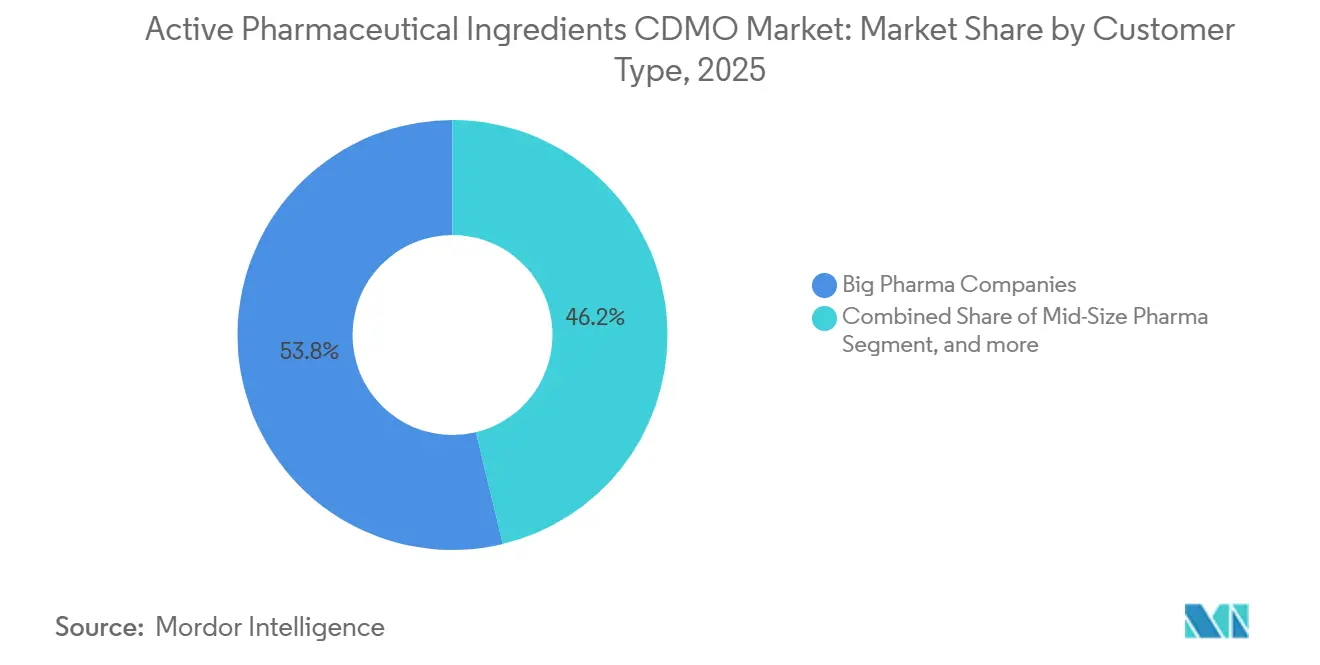
- By customer type, big pharma companies dominated with a 53.76% share in 2025, whereas small biotech players are poised for a 10.76% CAGR between 2026 and 2031.
- By phase, commercial projects held 48.54% share in 2025 and pre-clinical projects are anticipated to grow at an 11.54% CAGR to 2031.
- By geography, North America commanded a 42.65% share in 2025, while Asia-Pacific is expected to register a 9.54% CAGR through 2031.
Note: Market size and forecast figures in this report are generated using Mordor Intelligence’s proprietary estimation framework, updated with the latest available data and insights as of January 2026.
Global Active Pharmaceutical Ingredients CDMO Market Trends and Insights
Drivers Impact Analysis*
| Driver | (~) % Impact on CAGR Forecast | Geographic Relevance | Impact Timeline |
|---|---|---|---|
| Expanding Global Drug Pipeline Driving Outsourced API Production | +2.1% | North America, Europe | Medium term (2-4 years) |
| Shift Toward Highly Potent and Complex Molecules Boosting CDMO Demand | +1.8% | Oncology hubs worldwide | Long term (≥ 4 years) |
| Regulatory Pressure for Quality and Compliance Encouraging Partnering | +1.3% | India, China, global | Short term (≤ 2 years) |
| Cost Optimization Through Outsourcing and Capacity Flexibility | +1.5% | Global | Medium term (2-4 years) |
| Adoption of Innovative Manufacturing Technologies | +0.9% | North America, Europe | Long term (≥ 4 years) |
| Sustainability and Carbon Reduction Goals Influencing Supplier Selection | +0.7% | Europe lead, global spread | Long term (≥ 4 years) |
| Source: Mordor Intelligence | |||
Expanding Global Drug Pipeline Driving Outsourced API Production
The global clinical pipeline exceeded 21,000 active molecules in 2025, a 12% increase over 2024, with oncology, immunology, and rare-disease assets accounting for 60% of Phase II and III programs. The U.S. FDA cleared 55 new molecular entities in 2024—the highest total since 2018—and issued 63 orphan-drug designations in the first half of 2025 alone, stretching in-house manufacturing bandwidth and nudging sponsors toward CDMO collaborations for early-stage and commercial supply. WuXi AppTec reported a 28% year-on-year increase in small-molecule API projects in 2024, driven by biotech clients advancing first-in-human studies. As CDMOs accumulate regulatory dossiers and process know-how, perceived outsourcing risk drops, creating a flywheel that further enlarges the active pharmaceutical ingredients CDMO market.
Shift Toward Highly Potent and Complex Molecules Boosting CDMO Demand
Highly potent APIs (HPAPIs)—compounds handled at exposure limits below 10 µg/m³—represented 24% of new API filings in 2025 versus 18% in 2024, propelled by precision-oncology pipelines and antibody-drug conjugate (ADC) programs. Olon commissioned a EUR 25 million (USD 27 million) HPAPI plant in Italy in 2024, featuring isolator suites capable of handling payloads as low as 0.1 µg/m³. Lonza’s Portsmouth, New Hampshire campus completed OEB 5 upgrades that support ADC warhead production for Seagen and other innovators in 2025. HPAPI service pricing commands a 40–60% premium over standard APIs, making the segment a key profit driver in the active pharmaceutical ingredients CDMO market.
Regulatory Pressure for Quality and Compliance Encouraging Partnering
The U.S. FDA issued 18 warning letters to API plants in 2024, with data-integrity issues cited in 72% of notices, versus 14 letters in 2023. India and China—jointly supplying more than 80% of generic APIs to Western markets—faced heightened scrutiny after an FDA shortage report blamed 35% of supply gaps on quality-hold events. Updated EU GMP Annex 1 sterile-API rules that took effect in 2024, along with a U.S. Executive Order on a strategic API reserve signed in January 2025, are driving sponsors toward CDMOs that already meet ISO 9001 and ICH Q7 certification standards[1]European Medicines Agency, “Revised GMP Annex 1,” ema.europa.eu . Compliance investments create high barriers to entry, tilting market share toward experienced producers.
Cost Optimization Through Outsourcing and Capacity Flexibility
Treating API manufacture as a variable expense allows sponsors to avoid capital outlays of USD 50 million or more for multipurpose plants. Outsourcing also offers step-wise scale, from 10 kg Phase I batches up to multi-ton commercial volumes, aligning cost with clinical and regulatory milestones. Catalent reported onboarding over 40 new biotech customers in 2024 for integrated API-to-drug-product packages that compress timelines and reduce coordination overhead. Outcome-based pricing models, first piloted by Lonza and Thermo Fisher in 2025, further align CDMO incentives with sponsor success.
Restraints Impact Analysis*
| Restraint | (~) % Impact on CAGR Forecast | Geographic Relevance | Impact Timeline |
|---|---|---|---|
| Supply Chain Vulnerability For Critical Starting Materials | -1.2% | Global, especially Asia | Short term (≤ 2 years) |
| Price Erosion In Generic Pharmaceuticals Compressing Margins | -1.0% | Emerging Markets | Medium term (2-4 years) |
| Stringent Environmental And Safety Compliance Costs | -0.8% | North America, European Union | Long term (≥ 4 years) |
| Scarcity Of Skilled Process Chemists And Engineers | -0.6% | Developed Markets | Medium term (2-4 years) |
| Source: Mordor Intelligence | |||
Supply Chain Vulnerability for Critical Starting Materials
Over 70% of key starting materials for small-molecule APIs come from fewer than 10 chemical parks in China’s Jiangsu and Zhejiang provinces. A fire during the 2024 Lunar New Year halted three cardiovascular intermediates for six weeks, spotlighting single-point-of-failure risk[2]U.S. Pharmacopeia, “Medicine Supply Vulnerabilities Report,” usp.org . The United States Pharmacopeia listed 42 critical intermediates with no non-Chinese source in its 2025 resilience report. Dual sourcing and backward integration are underway but add 15–25% to cost of goods and extend lead times by up to three months.
Price Erosion in Generic Pharmaceuticals Compressing Margins
Generic API prices have declined by 8% annually since 2024 due to oversupply in India and China and aggressive tendering by Western payers. United Nations Industrial Development Organization data show gross margins on commodity APIs such as paracetamol and metformin fell below 15% in 2024, down from 22% in 2022[3]United Nations Industrial Development Organization, “Global API Pricing Trends,” unido.org. EuroAPI shuttered its Budapest site in 2024 as part of a broader restructuring to stem losses. While CDMOs pivot to higher-value HPAPIs and peptides, specialized equipment and validation timelines delay payback, heightening near-term margin pressure.
*Our forecasts treat driver/restraint impacts as directional, not additive. The impact forecasts reflect baseline growth, mix effects, and variable interactions.
Segment Analysis
By Molecule Size: Biologics Surge Reshapes Capacity Priorities
Small molecules generated 64.51% of active pharmaceutical ingredients CDMO market share in 2025. The biologics segment, however, is projected to post a 10.54% CAGR, reflecting rapid uptake of monoclonal-antibody biosimilars and ADC payloads. Lonza’s 60,000-liter Singapore expansion completed in 2025 and Samsung Biologics’ 784,000-liter Korean mega-site illustrate the scale of capital flowing into large-molecule capacity.
Peptide and oligonucleotide APIs blur the line between small and large molecules and are growing even faster. Bachem’s CHF 600 million investment scheduled across 2024-2025 targets GLP-1 agonists, while Ajinomoto’s Belgian plant upgrade expands oligonucleotide output to serve gene-silencing pipelines. Contractors historically focused on traditional chemistry are adding solid-phase peptide synthesizers and nucleotide lines to defend client relationships as pipelines evolve.


By Synthesis Type: Fermentation Gains Ground on Green-Chemistry Push
Chemical synthesis retained 71.54% revenue share in 2025, yet fermentation and other biological routes are forecast to expand at a 10.88% CAGR to 2031. Ajinomoto’s USD 100 million fermentation upgrade in Oregon produces amino-acid APIs used in peptide assembly, while WuXi Biologics operates 590,000 liters of mammalian-cell capacity across three continents. The active pharmaceutical ingredients CDMO market size for biocatalytic routes is widening as sponsors seek lower carbon footprints and shorter synthetic sequences.
Still, fermentation projects often require 12–18 months of strain development compared with 6–9 months for standard chemical routes. Consequently, developers weigh environmental benefits against speed-to-clinic imperatives, applying biological methods where lifecycle economics justify longer lead times.
By API Complexity: HPAPI Containment Drives Premium Pricing
Standard-potency products contributed 75.76% of 2025 sales, yet HPAPIs are expected to grow at an 11.32% CAGR through 2031. Contract fees of USD 8,000–15,000 per kilogram remain sustainable because of specialized isolators, single-use transfer systems, and stringent waste protocols. Lonza’s global HPAPI network includes six sites, and CordenPharma expanded its Chenôve, France capacity by 500 kg yearly in 2024, focusing on ADC linkers. Standard APIs face commoditization, pushing Western firms to exit low-margin molecules and reinvest in high-barrier categories.
By Service Type: End-to-End Models Capture Biotech Spend
cGMP scale-up and commercial manufacturing accounted for 65.76% of 2025 revenue, but integrated end-to-end services are forecast to compound at 10.33% annually through 2031. Thermo Fisher’s Patheon unit and Catalent both added discovery chemistry through fill-finish under a single master agreement, winning multiple biotech programs in 2024. CDMOs that design the synthetic route often secure later-stage supply, making early engagement a strategic priority in the active pharmaceutical ingredients CDMO industry.
By Customer Type: Biotech Partnerships Redefine Service Models
Big Pharma accounted for 53.76% of spend in 2025, leveraging multi-year contracts and co-investments in dedicated lines. Small biotech companies, lacking in-house assets, are projected to be the fastest-growing customer segment at a 10.76% CAGR. Charles River extended its CRO offering into early-stage API manufacturing in 2024, targeting virtual drug developers seeking seamless discovery-to-IND support. Venture capital flowing into gene-therapy and rare-disease startups fuels this shift, expanding the market for active pharmaceutical ingredients CDMO available to agile suppliers.
By Phase: Pre-Clinical Surge Reflects Front-Loaded Process Development
Commercial APIs still generated 48.54% of 2025 revenue. Pre-clinical activity, however, is set to grow 11.54% annually, as sponsors lock down scalable routes before IND submission. Almac doubled early-phase capacity in 2024, adding 200 kg per year of flexible reactors in Northern Ireland. Early outsourcing shortens development timelines and lowers technical risk, encouraging sponsors to keep a single CDMO partner through launch.
Geography Analysis
North America captured 42.65% of 2025 revenue. The September 2024 BIOSECURE Act and the January 2025 Strategic API Reserve Executive Order created tax credits and federal procurement guarantees that rewarded domestic investment. Resilience committed USD 750 million to a Massachusetts site for pandemic-response APIs in 2024. Higher labor and energy costs limit absolute price competitiveness, yet buyers pay premiums for security of supply and regulatory certainty. Regional growth is projected at 7.8% CAGR to 2031.
Europe accounted for 28% of global revenue in 2025. The EU Critical Medicines Act—effective in 2027—links market access to carbon footprint disclosure, favoring local producers that already run on renewable power. Lonza’s Visp expansion delivered 50,000 liters of additional biologics capacity in 2025, and Evonik installed continuous-flow lines in Germany for peptide and lipid APIs during 2024. Europe’s CAGR through 2031 is forecast at 7.5%, moderated by energy inflation and skilled-labor shortages.
Asia-Pacific is the fastest-growing region at 9.54% CAGR to 2031. India filed 48% of U.S. FDA DMFs in 2024 and continues to expand low-cost capacity, while China remains indispensable for starting materials despite an 8% decline in finished-API exports following BIOSECURE passage. WuXi AppTec grew 22% year on year in 2024 by pivoting toward European and Asian clients. Samsung Biologics’ mega-plant in Incheon cements South Korea’s role in monoclonal-antibody supply. Local governments across India and South Korea are rolling out production-linked incentives to anchor domestic value chains.

Competitive Landscape
The active pharmaceutical ingredients CDMO market remains moderately fragmented: the top 10 suppliers hold roughly 35–40% combined share, leaving room for regional specialists and tech-focused challengers. Lonza, Thermo Fisher, and WuXi AppTec headline the tier-one group thanks to global footprints and integrated offerings. Mid-tier players like Cambrex and CordenPharma are capturing share by deploying continuous-flow reactors and real-time analytics that shrink cycle times 30–40%. Chinese CDMOs have lost U.S. market access but are scaling in Europe and Asia; WuXi AppTec’s growth in 2024 came entirely from non-U.S. mandates.
White-space opportunities cluster in HPAPI, peptide, and oligonucleotide manufacturing, where global capacity is tight. Olon’s EUR 25 million Italian HPAPI line and Bachem’s CHF 600 million peptide build-out underscore the capital intensity required to win high-barrier work. Technology is a growing differentiator: Cambrex’s commercial-scale continuous-flow platform and Codexis’s enzyme collaborations exemplify process innovation that can lock in long-term contracts. Sustainability credentials now influence bid scores, especially in Europe, where CordenPharma secured Science Based Targets validation in 2025, and carbon disclosures will be mandatory from 2027.
Active Pharmaceutical Ingredients CDMO Industry Leaders
Catalent, Inc.
Cambrex Corporation
Lonza Group
Recipharm AB
Astorg (Corden Pharma)
- *Disclaimer: Major Players sorted in no particular order

Recent Industry Developments
- January 2026: Eurofins CDMO Alphora developed an AI-powered platform for high-throughput screening of salts and co-crystals, enhancing solid-state pharmaceutical development. The system, created in partnership with a university in Mississauga, predicts salt and co-crystal formation for active pharmaceutical ingredients.
- November 2025: Lupin Manufacturing Solutions (LMS), a wholly owned subsidiary of global pharma major Lupin Limited (Lupin) announced the commissioning of its dedicated Oncology Block at its Vizag facility in India. The new high-containment unit significantly enhances LMS’s end-to-end Contract Development and Manufacturing capabilities for High Potent Active Pharmaceutical Ingredients.
- February 2025: SK pharmteco, a global contract development and manufacturing organization (CDMO) announced the expansion of a core competency with the launch of an enhanced analytical testing laboratory specifically dedicated to High Potency Active Pharmaceutical Ingredients (HPAPIs).


Global Active Pharmaceutical Ingredients CDMO Market Report Scope
As per the scope of this report, an active pharmaceutical ingredient (API) is the part of the drug that produces the intended effects. It is the biologically active component of a drug product, such as a capsule, tablet, injectable, or cream. Traditionally, pharmaceutical companies would produce APIs. However, in recent years, many companies have opted to outsource API production, realizing that the returns on investment have been worthwhile. With the right outsourcing partner, the advantages outweigh the potential risks.
The Active Pharmaceutical Ingredients CDMO Market is Segmented by Molecule Size (Small Molecule and Large/Biologic Molecule), Synthesis Type (Synthetic Chemical and Biological), API Complexity (Standard-Potency APIs and Highly-Potent APIs), Service Type (Process R&D & Route Scouting, cGMP Scale-Up & Commercial Manufacturing, and Integrated End-To-End Services), Therapeutic Area (Oncology, Cardiovascular & Metabolic, Anti-Infectives, Central Nervous System, Respiratory, Gastrointestinal & Hepatology, Dermatology & Aesthetics, and Immunology & Rare Diseases), Customer Type (Big Pharma Companies, Mid-Size Pharma, Small Biotech, and Other Customer Types), Phase (Pre-Clinical, Phase I, Phase II, Phase III, and Commercial), and Geography (North America, Europe, Asia-Pacific, Middle East & Africa, and South America). The market report also covers the estimated market sizes and trends for 17 countries across major regions globally. The report offers the value (in USD million) for the above segments.
| Small Molecule |
| Large / Biologic Molecule |
| Synthetic Chemical |
| Biological (Fermentation / Cell Culture) |
| Standard-Potency APIs |
| Highly-Potent APIs (HPAPIs) |
| Process R&D & Route Scouting |
| cGMP Scale-Up & Commercial Manufacturing |
| Integrated End-To-End Services |
| Oncology |
| Cardiovascular & Metabolic |
| Anti-Infectives |
| Central Nervous System |
| Respiratory |
| Gastrointestinal & Hepatology |
| Dermatology & Aesthetics |
| Immunology & Rare Diseases |
| Big Pharma Companies |
| Mid-Size Pharma |
| Small Biotech |
| Other Customer Types |
| Pre-Clinical |
| Phase I |
| Phase II |
| Phase III |
| Commercial |
| North America | United States |
| Canada | |
| Mexico | |
| Europe | Germany |
| United Kingdom | |
| France | |
| Italy | |
| Spain | |
| Rest of Europe | |
| Asia-Pacific | China |
| Japan | |
| India | |
| Australia | |
| South Korea | |
| Rest of Asia-Pacific | |
| Middle East & Africa | GCC |
| South Africa | |
| Rest of Middle East & Africa | |
| South America | Brazil |
| Argentina | |
| Rest of South America |
| By Molecule Size | Small Molecule | |
| Large / Biologic Molecule | ||
| By Synthesis Type | Synthetic Chemical | |
| Biological (Fermentation / Cell Culture) | ||
| By API Complexity | Standard-Potency APIs | |
| Highly-Potent APIs (HPAPIs) | ||
| By Service Type | Process R&D & Route Scouting | |
| cGMP Scale-Up & Commercial Manufacturing | ||
| Integrated End-To-End Services | ||
| By Therapeutic Area | Oncology | |
| Cardiovascular & Metabolic | ||
| Anti-Infectives | ||
| Central Nervous System | ||
| Respiratory | ||
| Gastrointestinal & Hepatology | ||
| Dermatology & Aesthetics | ||
| Immunology & Rare Diseases | ||
| By Customer Type | Big Pharma Companies | |
| Mid-Size Pharma | ||
| Small Biotech | ||
| Other Customer Types | ||
| By Phase | Pre-Clinical | |
| Phase I | ||
| Phase II | ||
| Phase III | ||
| Commercial | ||
| Geography | North America | United States |
| Canada | ||
| Mexico | ||
| Europe | Germany | |
| United Kingdom | ||
| France | ||
| Italy | ||
| Spain | ||
| Rest of Europe | ||
| Asia-Pacific | China | |
| Japan | ||
| India | ||
| Australia | ||
| South Korea | ||
| Rest of Asia-Pacific | ||
| Middle East & Africa | GCC | |
| South Africa | ||
| Rest of Middle East & Africa | ||
| South America | Brazil | |
| Argentina | ||
| Rest of South America | ||


Key Questions Answered in the Report
How large is the active pharmaceutical ingredients CDMO market today?
The active pharmaceutical ingredients CDMO market size reached USD 139.30 billion in 2026 and is projected to grow to USD 210.53 billion by 2031.
What is driving demand for highly potent APIs?
Oncology pipelines and antibody-drug conjugates require stringent containment, pushing HPAPI demand to an 11.32% CAGR through 2031.
Which region will expand the fastest?
Asia-Pacific is forecast to post a 9.54% CAGR thanks to India's cost advantage and capacity additions across biologics and peptides.
Why are sponsors favoring integrated end-to-end CDMO services?
End-to-end models cut technology-transfer time, give single-source accountability, and are expected to grow 10.33% annually through 2031.
How does the BIOSECURE Act affect global API sourcing?
The Act restricts U.S. federal procurement from certain Chinese CDMOs, prompting sponsors to rebalance supply chains toward India, North America, and Europe.
What technologies are reshaping API manufacturing economics?
Continuous-flow reactors, biocatalysis, and single-use fermenters reduce cycle times, solvent use, and carbon emissions, improving cost competitiveness.
Page last updated on:


