Europe Municipal Solid Waste Management Market Size and Share
Market Overview
| Study Period | 2020 - 2031 |
|---|---|
| Forecast Data Period | 2026 - 2031 |
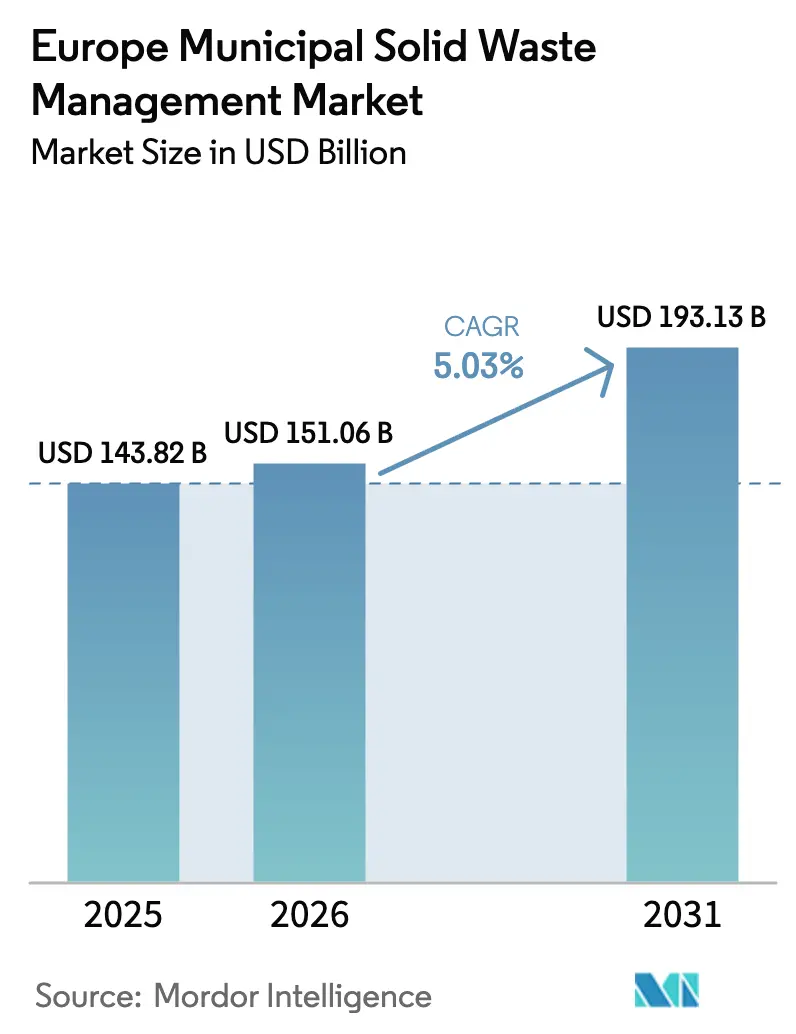
| Base Year Market Size (2025) | USD 143.82 Billion |
| Market Size (2026) | USD 151.06 Billion |
| Market Size (2031) | USD 193.13 Billion |
| Growth Rate (2026 - 2031) | 5.03% CAGR |
| Market Concentration | Low |
Major Players *Disclaimer: Major Players sorted in no particular order Image © Mordor Intelligence. Reuse requires attribution under CC BY 4.0. | |
Europe Municipal Solid Waste Management Market Analysis by Mordor Intelligence
The Europe Municipal Solid Waste Management Market size was valued at USD 143.82 billion in 2025 and estimated to grow from USD 151.06 billion in 2026 to reach USD 193.13 billion by 2031, at a CAGR of 5.03% during the forecast period (2026-2031). This trajectory mirrors the continent-wide shift toward circular-economy practices, supported by binding European Union recycling mandates that cap landfilling and reward high-grade material recovery, and is reshaping the broader Europe Municipal Solid Waste Management Market. Investment is flowing into optical sorters, anaerobic-digestion plants, and AI-enabled robotics that raise throughput and purity thresholds, while landfill and incineration taxes redirect waste streams into higher-value recycling channels, positioning the Europe Municipal Solid Waste Management Market as a testbed for advanced technologies. Germany anchors growth with its mature ecosystem, yet Spain, Poland, and the Nordic bloc are expanding most quickly on the back of infrastructure modernisation, Extended Producer Responsibility (EPR) roll-outs, and EU-funded waste-to-energy projects. Competitive intensity is rising because technology specialists, chemical up-cyclers, and traditional operators are converging on the same value pools of data services, hazardous-stream treatment, and closed-loop supply contracts.
Key Report Takeaways
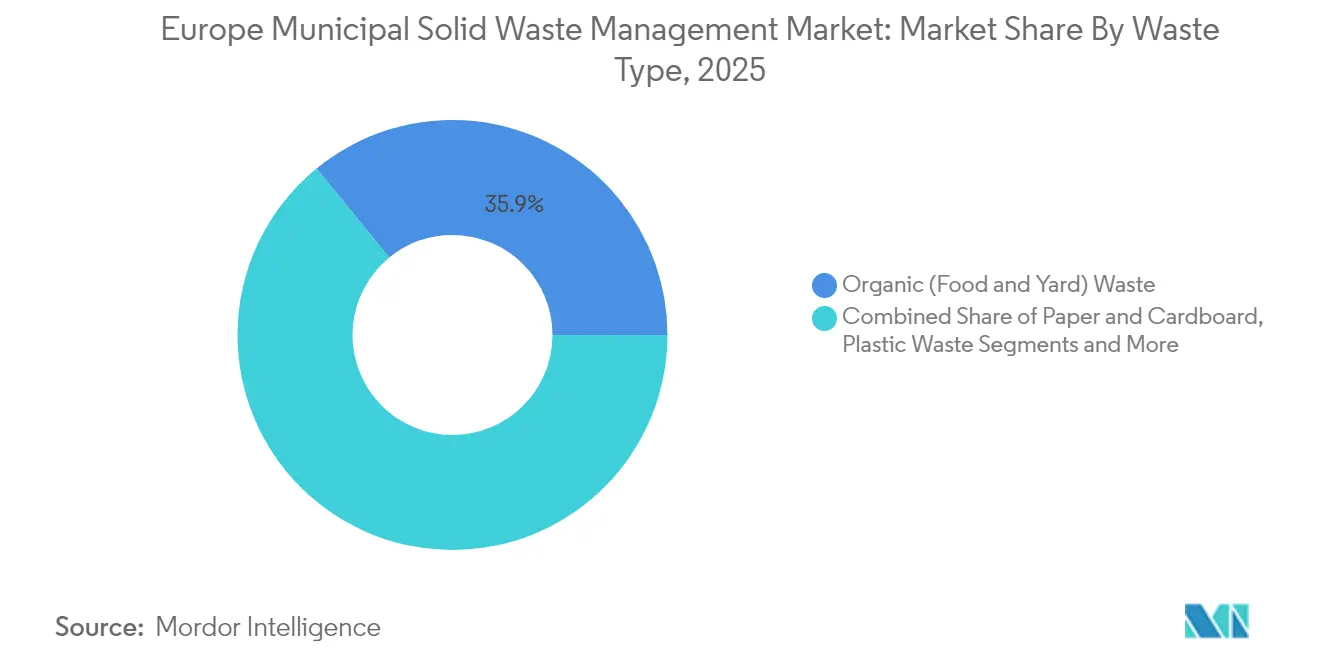
- By waste type, organic waste led with 35.90% of the Europe municipal solid waste management market share in 2025, while e-waste is set to grow fastest at a 6.78% CAGR to 2031.
- By source, the residential stream contributed 54.82% of the Europe municipal solid waste management market in 2025; municipal services are projected to post the highest 5.32% CAGR through 2031.
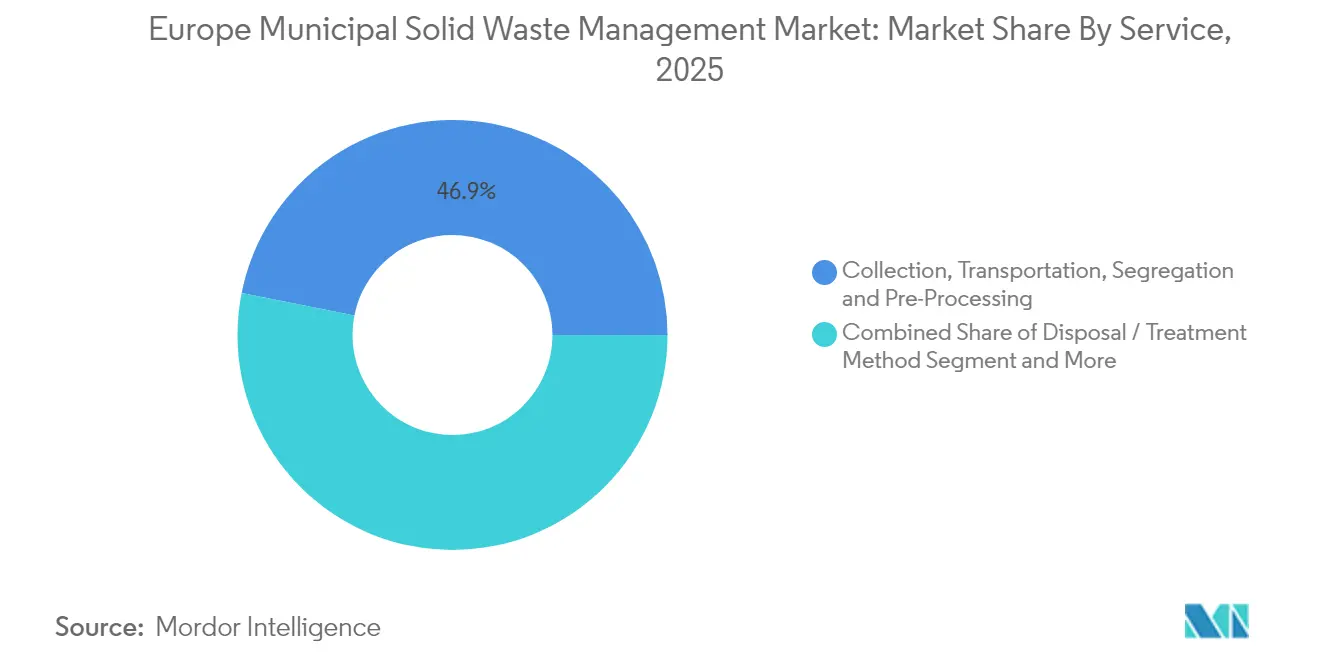
- By service, disposal and treatment methods captured 46.88% of the Europe municipal solid waste management market in 2025, whereas recycling and material-recovery services are expanding at a 6.55% CAGR to 2031.
- By geography, Germany held 20.07% of the Europe municipal solid waste management market in 2025 revenue; Spain is forecast to register the fastest 5.72% CAGR between 2026 and 2031.
Note: Market size and forecast figures in this report are generated using Mordor Intelligence’s proprietary estimation framework, updated with the latest available data and insights as of 2026.
Europe contributes to a system defined not by any single geography but by the interaction of many. The global municipal solid waste management market data by Mordor Intelligence represents that combined structure.
Europe Municipal Solid Waste Management Market Trends and Insights
Drivers Impact Analysis*
| Driver | (~) % Impact on CAGR Forecast | Geographic Relevance | Impact Timeline |
|---|---|---|---|
| EU Circular Economy Package (65% recycling target) | +1.2% | EU-wide; strongest in Germany, Netherlands, Denmark | Long term (≥ 4 years) |
| EPR expansion for packaging & single-use plastics | +0.8% | EU-wide; early adoption in Germany, France | Medium term (2-4 years) |
| Escalating landfill & incineration taxes | +0.7% | EU-wide, varied pace | Medium term (2-4 years) |
| Surge in e-commerce packaging waste volumes | +0.6% | Germany, United Kingdom, France | Short term (≤ 2 years) |
| Rapid adoption of smart bins & AI-sorting | +0.4% | Germany and Nordics | Medium term (2-4 years) |
| EU-funded waste-to-energy build-out | +0.3% | Poland, Czech Republic, Hungary | Long term (≥ 4 years) |
| Source: Mordor Intelligence | |||
EU Circular Economy Package Driving 65% Recycling Target by 2035
The 65% municipal waste recycling mandate is the single most powerful structural driver of the Europe Municipal Solid Waste Management Market[1]European Parliament, “Directive (EU) 2018/851 Amending Waste Framework Directive,” europarl.europa.eu. Member states exceeding the target, such as Germany, now channel capital into next-generation sorters that unlock higher polymer and fibre purity thresholds. Less-advanced countries like Romania face incremental penalties for every point below target, accelerating cross-border flows of recyclables into regions with surplus treatment capacity. The package also enforces a plastic levy of EUR 0.80 per kilogram of unrecycled packaging, which creates a USD 1.4 billion annual revenue opportunity for recovery operators. Regulatory certainty is attracting industrial co-investors: equipment supplier TOMRA recently took a 25% stake in AI-software firm PolyPerception to refine real-time composition monitoring. Parallel design-for-recycling rules compel brand owners to collaborate with waste firms earlier in product-development cycles, extending the value chain’s influence from post-consumer take-back to pre-consumer specification.
Extended Producer Responsibility (EPR) Expansion for Packaging & Single-Use Plastics
Harmonised EPR rules shift full waste-handling costs from municipalities to producers, unlocking stable long-term funding for material-recovery facilities across the Europe Municipal Solid Waste Management Market. The 2025 Packaging and Packaging Waste Regulation obliges all packaging to be recyclable by 2030 and raises mandatory recycled-content thresholds for PET food containers to 30% by 2030[2]European Commission, “Proposal for a Regulation on Packaging and Packaging Waste,” ec.europa.eu. Germany’s Single-Use Plastics Fund Act forces importers and fillers to register and pay per-kilogram clean-up fees, providing cities with fresh revenue to modernise collection fleets. France and Denmark are rolling out similar registries, which reduce the historical “free-rider” gap between early and late adopters and justify higher-scale regional investments in robotics and de-inking lines. EPR has catalysed vertical integration: SUEZ acquired composite-surface producer Purple Alternative Surface to secure captive offtake for recycled plastics while guaranteeing supply to packaging clients.
Surge in E-commerce Packaging Waste Volumes Across Western Europe
Online-shopping volumes rose sharply after the pandemic and remain structurally higher, generating swollen flows of cardboard, flexible plastic, and void-fill materials. Amazon states that more than half of its regional orders already use reduced packaging, yet total mass entering municipal systems continues to climb. Urban authorities now face congested kerbside routes and overflowing bring-points, prompting investments in near-source compaction, reverse-vending kiosks, and asset-tracking of bins. Waste operators are trialling pick-ups at distribution centres so that corrugated board and poly-mailers bypass municipal systems entirely. Data-rich e-commerce waste profiles also spur AI-sorter deployments calibrated for lightweight multilayer films, enabling higher capture rates of low-density polymers. These developments reinforce advanced route-optimisation software that slashes empty running and reduces truck hours.
Rapid Adoption of Smart Bins & AI-Enabled Sorting in Germany & Nordics
Germany, Denmark, Sweden, and Norway are setting performance benchmarks through sensorised containers and robotic sorters. Oslo-based Sensorita has fitted more than 2,500 radar-equipped devices, allowing hauliers to cut idle mileage by 28% and boost pick-up productivity by 41.5%. Denmark’s Solum recently opened a fully robotic construction-waste line that handles 25,000 t a year, achieving 90% purity in recovered aggregates and metals. National research institutes have validated battery-recognition algorithms that reduce fire risks in e-waste streams. These digital tools tighten loss loops and supply real-time composition data to plastics re-processors, which are now paid on colour-specific granulate quality rather than bulk tonnes. Technology diffusion is spreading as municipalities embed sensor and AI capacity requirements in new concession tenders.
Restraints Impact Analysis*
| Restraint | (~) % Impact on CAGR Forecast | Geographic Relevance | Impact Timeline |
|---|---|---|---|
| Recycled-plastic price volatility | -0.5% | EU-wide | Short term (≤ 2 years) |
| Fragmented municipal contracting | -0.4% | Italy, Spain, Greece | Medium term (2-4 years) |
| Limited separate bio-waste collection | -0.3% | Poland, Czech Republic | Medium term (2-4 years) |
| Community opposition to new incinerators | -0.2% | Urban corridors in Germany, Netherlands | Long term (≥ 4 years) |
| Source: Mordor Intelligence | |||
Recycled-Plastic Price Volatility Pressuring MRF Profitability
Secondary polymer prices climbed 39% in 2022 to EUR 454 t before retreating as virgin resin prices softened, undermining capital-expenditure payback calculations for material-recovery facilities. European recyclers report that premium rHDPE grades fetched 7-8% gains into 2025, yet margins remain narrow because imported Asian granules suppress spot quotes. Quality variations further widen bid–ask spreads, with buyers demanding certificates on melt-flow index and traceability. Facilities are diversifying income by selling design-for-recycling consulting, advanced washing services, and long-term fixed-price offtake contracts to brand owners that need guaranteed recycled content to meet EPR quotas. Nonetheless, volatility continues to shave 0.5 percentage points off the forecast CAGR of the Europe Municipal Solid Waste Management Market as some projects are delayed pending clearer price signals.
Fragmented Municipal Contracting in Southern Europe
Southern European municipalities often issue small, short-duration contracts that discourage large-scale capital commitments in robotic MRFs or energy-recovery units. Italy’s Campania crisis illustrates how overlapping local jurisdictions prolong permitting, while informal actors dilute feedstock quality and siphon recyclables from official channels. Multinational operators struggle to standardise processes across dozens of micro-contracts, eroding economies of scale that underpin the Europe municipal solid waste management market. Analysts find that a single-operator model can yield double-digit cost efficiencies for cities of more than 500,000 residents, yet political decentralisation continues to favour multiple local awards. Fragmentation also blocks regional waste-to-energy hubs that could treat residual streams from several provinces within a 150 km radius.
*Our forecasts treat driver/restraint impacts as directional, not additive. The impact forecasts reflect baseline growth, mix effects, and variable interactions.
Segment Analysis
By Waste Type: Organic Waste Dominates Despite E-waste Acceleration
Organic waste retained a 35.90% share of the Europe municipal solid waste management market in 2025, supported by EU directives that oblige households to place food and garden residues in separate streams. Anaerobic-digestion plants are absorbing this flow, generating biogas volumes ranging from 191 to 271 Ndm³ kg-1 of methane potential and creating dual revenue from tipping fees and renewable electricity sales. The segment benefits from plans in Poland and France to triple digestion capacity by 2030, helped by feed-in tariffs that stabilise cash flow. E-waste, though still below 5% of total tonnage, is scaling quickly at a 6.78% CAGR as device lifecycles shorten and battery-powered appliances multiply. AI-guided robotic arms now dismantle smartphones and laptops, retrieving printed-circuit boards for smelters and improving precious-metal yields by double digits. Paper and cardboard flows remain steady thanks to e-commerce expansion, while plastics struggle with infrastructure bottlenecks despite favourable levy economics. Metal and glass streams continue to post healthy margins, leveraging deposit-return schemes in Nordic states and commodity upcycles.
The Europe municipal solid waste management market size for organic waste is projected to expand 5.18% a year through 2031, while e-waste’s contribution to the Europe municipal solid waste management market size is forecast to more than double over the same period. Automated disassembly tools, coupled with stricter take-back quotas, are expected to raise the Europe municipal solid waste management market share for e-waste by almost 2 percentage points by 2031. Countries that link extended-warranty incentives with end-of-life collection, such as Germany and Sweden, are likely to outperform peers on recovery rates.


By Source: Residential Segment Leads While Municipal Services Modernise
Household bins generated 54.82% of revenue in 2025, reflecting mandatory kerbside collection of multiple fractions. Separate bio-waste and lightweight-packaging streams deliver stable, predictable tonnage that underpins MRF utilisation. Education drives, such as Italy’s door-to-door organic collection campaign, boosted household capture rates, while deposit-return schemes amplified beverage container flows. The municipal-services category, however, is growing fastest at 5.32% CAGR, driven by smart-city budgets that finance sensorised bins, fleet electrification, and data dashboards. Many city authorities renegotiate contracts to include real-time performance metrics, prompting operators to invest in route-planning software that reduces fuel burn and overtime. Commercial and institutional generators add complexity because volumes can fluctuate with retail footfall and office occupancy. Construction and demolition (C&D) waste is receiving robotic-sorting attention after Denmark’s 90% purity milestone, opening fresh revenue lines in recycled aggregates and recovered timber.
Municipal modernisation is set to lift the European waste management industry’s service intensity. Cities that embed outcome-based payment clauses encourage contractors to deploy analytics that cut residual waste by up to 15% within 18 months. Household participation remains critical: programmes that integrate pay-as-you-throw tariffs report up to 25% drops in residual fractions, freeing incinerator capacity for non-recyclables. Meanwhile, industrial hygiene regulations are tightening at public-sector facilities, adding demand for specialist hazardous-stream treatment.
By Service: Material Recovery Accelerates Beyond Traditional Disposal
Recycling and material-recovery services grew 6.55% CAGR and now command just over one-third of revenue, reflecting Europe’s policy pivot from disposal to resource retention. Optical sorters and near-infrared detectors elevate purity, enabling plastics re-processors to deliver food-grade pellets. Energy recovery retains a vital place: three Czech waste-to-energy (WtE) plants supply district heating to Prague, Brno, and Liberec, with additional units planned under EU cohesion funding. Composting and anaerobic digestion benefit from bio-waste directives, while landfills’ share shrinks under rising gate fees and carbon pricing. Support functions such as auditing and digital-tracking platforms attract double-digit growth as producers seek compliance proof for EPR submissions.
The Europe municipal solid waste management market size tied to recycling services is expected to climb from USD 55.36 billion in 2025 to USD 80.24 billion by 2031. Disposal services will continue to dominate nominal revenue, yet their share of the Europe municipal solid waste management market size will fall as regulators raise recovery targets. Across all service lines, data-driven optimisation underpins margin resilience. Operators that integrate blockchain-based traceability can command premiums for certified secondary materials in automotive and electronics supply chains.
Geography Analysis
Germany maintained a 20.07% revenue lead in 2025 on the back of an advanced collection network, nationwide EPR alignment, and early adoption of AI sorters. The Single-Use Plastics Fund Act, effective in 2024, channels producer levies directly into municipal coffers, reinforcing budgets for bin replacements and awareness campaigns. A national plastic tax slated for 2026 will transfer EU levies to manufacturers, sharpening demand for post-consumer resins and further enlarging the Europe municipal solid waste management market. Germany’s waste sector employs 310,000 people and has already cut greenhouse-gas emissions 75% relative to 1990 levels, illustrating the economic-environmental nexus. AI-powered deployment pilots in Bavaria report 20% labour-hour savings, setting a benchmark for other member states.
Spain is the fastest-growing market, advancing 5.72% CAGR through 2031 as it ramps up separate-collection coverage and modernises outdated treatment assets. Recent municipal contract wins by FCC Environment, and the roll-out of a EUR 0.45 kg tax on non-reusable plastics are steering capital into high-throughput MRFs and food-waste digesters. Investments financed by the EU-backed PERTE circular-economy fund are unlocking co-financing for robotics, while regional governments streamline permitting to consolidate fragmented operators. Growth in the Balearic and Canary archipelagos underscores the tourism sector’s push for sustainable waste solutions.
The United Kingdom navigates post-Brexit divergence, introducing mandatory digital-waste tracking from April 2025 that compels generators and hauliers to register every tonne online. Plastic-packaging taxes raised GBP 323 million in fiscal 2023-24, stimulating demand for recycled content. France is implementing the AGEC law, which enforces a 65% recycling target by 2025, leading to AI part¬nerships such as Greyparrot-NextWaste that digitise real-time MRF analytics. The BENELUX grouping and Nordic countries lead on technology penetration, with Dutch CO₂ markets and Norwegian sensor networks illustrating how policy and innovation intersect. Eastern Europe is closing infrastructure gaps through EU cohesion funds: Poland alone has earmarked USD 322 million for biogas plants, while new WtE projects in Prague and Warsaw aim to divert residuals from crowded landfills.
The global municipal solid waste management market is analyzed by Mordor Intelligence across multiple other geographies, with in-depth regional assessments available for North America and Asia. This is complemented by country-specific insights for India, reflecting various localized market behavior and policy environments' coverage.
Competitive Landscape
Competition is moderate but intensifying as operators race to embed digital capabilities and circular-economy services. Veolia leverages its GreenUp programme to raise EBITDA above EUR 8 billion by 2027, focusing on hazardous-waste treatment, industrial water reuse, and advanced composting[3]Veolia Group, “GreenUp Strategic Program 2024–2027,” veolia.com. SUEZ is on an acquisition offensive, buying Italy’s Gruppo Ecosistem and minority stakes in Renault’s “The Future Is NEUTRAL” car-recycling initiative to capture metal and polymer flows before end-of-life vehicles enter scrap channels[4]SUEZ Group, “SUEZ to Acquire Gruppo Ecosistem,” suez.com. FCC Environment expands geographically, acquiring France-based Europe Services Groupe, thereby cementing footholds in Paris and Lyon.
Technology partnerships are redefining operating models across the Europe municipal solid waste management market. TOMRA’s interest in PolyPerception and LyondellBasell’s collaboration with EEW illustrate how equipment manufacturers and chemical producers lock in feedstock while boosting sensor accuracy. Blockchain platforms such as SUEZ’s CircularChain certify origin and quality, helping customers meet stringent recycled-content obligations. Start-ups like Sensorita and Greyparrot supply IoT sensors and vision analytics that slot into existing MRFs, lowering capex thresholds for mid-tier players.
Financial investors are also shaping competitive dynamics. EQT’s majority stake in software specialist AMCS injects capital for product expansion that will bring route optimisation and billing modules under a single SaaS umbrella. Infrastructure funds favour long-term cash flows from WtE and digestion assets, creating a bifurcation where asset-heavy models coexist with data-centric service plays. Overall, scale, proprietary data and end-to-end services emerge as the critical differentiators for margin preservation and contract renewals.
Europe Municipal Solid Waste Management Industry Leaders
Veolia Environnement
SUEZ
FCC Environment
Remondis
Renewi
- *Disclaimer: Major Players sorted in no particular order

Recent Industry Developments
- February 2025: Biffa secured a GBP 5.5 million contract with the City of Lincoln Council for waste and street-cleaning services starting in 2026.
- January 2025: LyondellBasell and EEW agreed to explore advanced-sorting collaborations aimed at higher-quality recycled feedstock streams.
- January 2025: SUEZ signed a share-purchase agreement to acquire a majority stake in Gruppo Ecosistem, expanding hazardous- and non-hazardous-waste processing capacity in Southern Italy.
- December 2024: Denmark opened its first robotic construction-waste sorting plant, operated by Solum, with 25,000 t annual capacity and 90% purity.


Research Methodology Framework and Report Scope
Market Definitions and Key Coverage
According to Mordor Intelligence, we define the European municipal solid waste (MSW) management market as all fee-based activities that move, sort, treat, recover, or finally dispose of household and public-realm waste streams generated by residents, small businesses, institutions, and street services across EU-27, the U.K., EFTA members, and candidate nations. Revenues cover collection, transfer, material recovery, composting, anaerobic digestion, waste-to-energy, and sanitary landfilling that are performed by public operators or private contractors.
Scope exclusion: Industrial, construction, hazardous, and wastewater sludge streams, along with the sale of capital equipment, fall outside this assessment.
Segmentation Overview
- By Waste Type
- Organic (Food & Yard) Waste
- Paper & Cardboard
- Plastic Waste
- Metal Waste
- Glass Waste
- E-Waste
- Textiles & Leather
- Others (Rubber, Wood, etc.)
- By Source
- Residential
- Commercial (Office, Retail, etc.)
- Institutional
- Municipal Services (Street Cleaning, Parks, etc.)
- Construction & Demolition
- By Service
- Collection, Transportation, Segregation & Pre-Processing
- Disposal / Treatment Method
- Recycling & Material Recovery
- Composting
- Anaerobic Digestion
- Energy Recovery (WtE / RDF / Biogas)
- Landfilling
- Others (Incineration without Energy Recovery, MBT)
- Ancillary and Support Services (Auditing, Consulting, Smart Waste Solutions, Etc.)
- By Geography
- United Kingdom
- Germany
- France
- Italy
- Spain
- BENELUX (Belgium, Netherlands, and Luxembourg)
- NORDICS (Denmark, Finland, Iceland, Norway, and Sweden)
- Rest of Europe
Detailed Research Methodology and Data Validation
Primary Research
We held structured interviews with city waste directors, integrated service providers, recyclers, and equipment financiers across Germany, Spain, the Nordics, and CEE. These calls validated diversion targets, average service prices, technology uptake, and forecast bottlenecks that could not be gauged from public records alone.
Desk Research
Our analysts gathered baseline tonnage, recycling rates, and gate-fee ranges from open datasets such as Eurostat's env_wasmun series, the European Environment Agency circular-economy indicators, national environment ministries, and OECD municipal waste outlooks. Trade association briefs from FEAD, Plastics Recyclers Europe, and the Confederation of European Paper Industries helped us judge material-specific recovery yields. Company filings, investor decks, and local tariff schedules rounded out pricing and contract depth. Paid sources, including D&B Hoovers and Dow Jones Factiva, were tapped for hard-to-find private revenue splits. The sources listed here are indicative; many additional public and premium references fed our desk analysis.
Market-Sizing & Forecasting
A top-down mass-flow model converts reported waste generation per capita into market value through country-level service penetration ratios and prevailing gate fees, which are then cross-checked with sampled supplier roll-ups to fine-tune totals. Variables tracked include population growth, curbside separation coverage, landfill tax escalators, recovered material price indices, energy-from-waste capacity additions, and EU recycling mandates. Multivariate regression, supported by expert consensus on policy trajectories, underpins the 2025-2030 forecast. Data gaps in bottom-up samples are bridged using regional price medians and documented policy targets.
Data Validation & Update Cycle
Before sign-off, Mordor analysts perform variance checks against Eurostat revisions and company earnings, re-contact key experts if swings exceed preset bands, and elevate anomalies for peer review. We refresh every twelve months and trigger interim updates after material policy shifts or mergers.
Why Our Europe Municipal Solid Waste Management Baseline Commands Reliability
Published numbers often diverge because firms pick different waste scopes, tariff assumptions, and refresh cadences.
Key gap drivers include: some studies pool industrial and hazardous streams with household waste, others apply uniform EU-wide gate fees despite strong country variance, and several rely on static recycling targets rather than validated progress audits. Mordor's model aligns strictly with Eurostat MSW codes, uses country-specific fee ladders, and updates annually, giving decision makers a balanced, timely view.
Benchmark comparison
| Market Size | Anonymized source | Primary gap driver |
|---|---|---|
| USD 143.82 B (2025) | Mordor Intelligence | - |
| USD 413.6 B (2024) | Global Consultancy A | Bundles industrial and hazardous waste, assumes flat pricing across Europe |
| USD 500.0 B (2024) | Industry Journal B | Counts capital equipment sales and multi-year PPP contract totals as annual revenue |
These contrasts show that when scope creep or broad averages inflate figures, comparability suffers. By anchoring estimations to audited MSW tonnage and country-level economics, Mordor Intelligence supplies a transparent, reproducible baseline that clients can trace back to clear variables and repeat the next cycle with confidence.


Key Questions Answered in the Report
What is the current value of the Europe Municipal Solid Waste Management Market?
The market is valued at USD 151.06 billion in 2026 and is forecast to reach USD 193.13 billion by 2031, growing at a 5.03% CAGR.
Which country holds the largest share of the Europe Municipal Solid Waste Management Market?
Germany leads with 20.07% revenue in 2025, supported by advanced recycling infrastructure and robust EPR frameworks.
Which waste type is expanding fastest in Europe?
Electronic waste is the fastest-growing category, registering a 6.78% CAGR for 2026-2031 thanks to shorter device lifecycles and stronger precious-metal recovery rules.
How are Extended Producer Responsibility rules affecting the sector?
Harmonized EPR schemes shift full waste-management costs to producers, generating stable funding for material-recovery facilities and incentivising higher recycled content in packaging.
What technological trends are shaping competitive dynamics?
AI-powered sorting systems, IoT-enabled smart bins and blockchain traceability platforms are differentiating operators by boosting purity rates, cutting collection costs and providing auditable recycling data.
Which service segment is expected to grow most strongly?
Recycling and material-recovery services are projected to expand at a 6.55% CAGR, outpacing traditional disposal due to regulatory incentives and growing demand for secondary raw materials.
Page last updated on:


