
Europe Industrial Waste Management Market Size and Share
Market Overview
| Study Period | 2020 - 2031 |
|---|---|
| Forecast Data Period | 2026 - 2031 |
| Base Year Market Size (2025) | USD 53.65 Billion |
| Market Size (2026) | USD 56.65 Billion |
| Market Size (2031) | USD 74.36 Billion |
| Growth Rate (2026 - 2031) | 5.59 % |
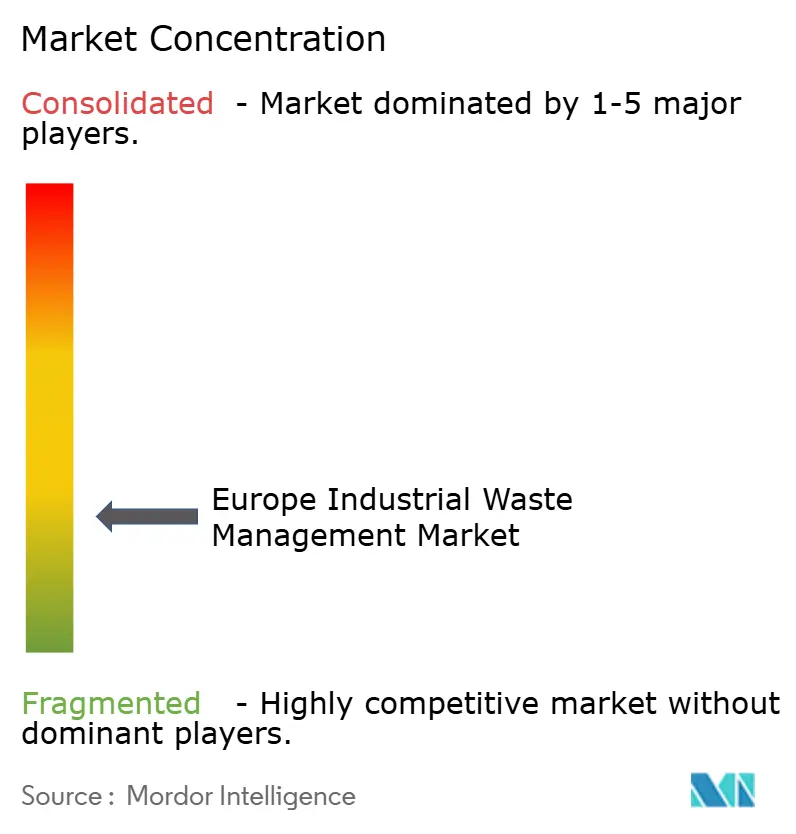
| Market Concentration | Low |
Major Players *Disclaimer: Major Players sorted in no particular order Image © Mordor Intelligence. Reuse requires attribution under CC BY 4.0. | |
Europe Industrial Waste Management Market Analysis by Mordor Intelligence
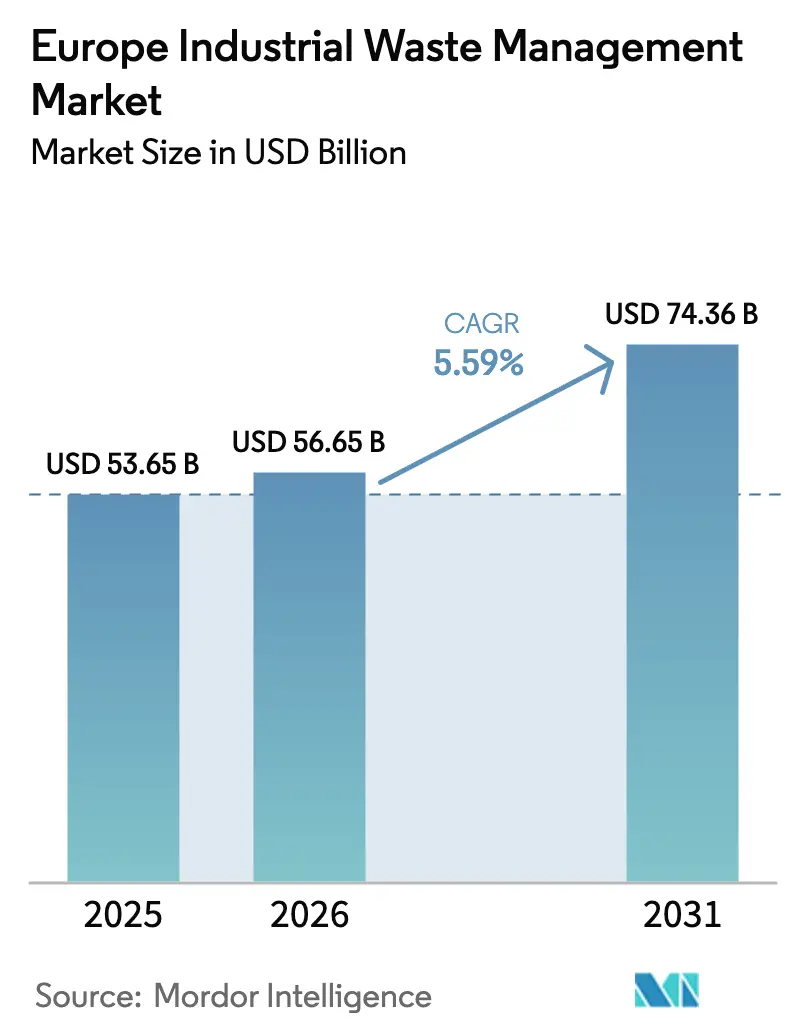
The European Industrial Waste Management Market size in 2026 is estimated at USD 56.65 billion, growing from 2025 value of USD 53.65 billion with 2031 projections showing USD 74.36 billion, growing at 5.59% CAGR over 2026-2031. This healthy trajectory reflects the region’s rapid transition toward a circular economy, propelled by tight EU regulations, rising industrial output, and persistent investor scrutiny of environmental performance. Hazardous waste volumes are climbing 2.25% each year, while non-hazardous streams are shifting toward higher-value recovery routes. Recycling infrastructure, digital tracking mandates, and industrial symbiosis initiatives are enabling operators to capture larger portions of secondary raw-material demand, especially for electric-vehicle battery inputs. Strategic acquisitions worth more than USD 11 billion in 2024 alone signal accelerated consolidation as players seek scale, technology, and geographic reach. Lingering pressure points, including labor shortages in Eastern Europe, volatile recycled-material prices, and uneven enforcement of EU rules, continue to shape investment and operating decisions across the European industrial waste management market[1]European Commission, “Digital Waste Shipment System (DIWASS) Factsheet,” ec.europa.eu.
Key Report Takeaways
- By service, Treatment & Disposal led with 53.78% of the European industrial waste management market share in 2025; Recycling & Material Recovery is advancing at a 6.72% CAGR through 2031.
- By disposal method, Landfill accounted for a 44.32% share of the European industrial waste management market size in 2025, while Incineration & Energy Recovery is forecast to expand at a 7.31% CAGR to 2031.
- By waste type, Non-hazardous waste held 78.85% of the European industrial waste management market share in 2025, and Hazardous waste is progressing at a 5.15% CAGR over the same horizon.
- By industry, Construction Materials captured 31.95% of the European industrial waste management market size in 2025; Electrical & Electronics exhibits the fastest growth at an 7.96% CAGR through 2031.
- By geography, Germany commanded 23.12% of the European industrial waste management market in 2025, whereas the Rest-of-Europe bloc shows the strongest expansion at a 7.12% CAGR.
Note: Market size and forecast figures in this report are generated using Mordor Intelligence’s proprietary estimation framework, updated with the latest available data and insights as of 2026.
Global valuation is built by aggregating outputs from multiple regions, with Europe forming one of the important contributors. Mordor Intelligence's global industrial waste management market size report represents that cumulative total.
Market Trends and Insights
Drivers Impact Analysis of Europe Industrial Waste Management Market*
| Drivers | (~) % Impact on CAGR Forecast | Geographic Relevance | Impact Timeline |
|---|---|---|---|
| Stringent EU waste-management directives | 1.8% | EU-wide, with enforcement variations across Eastern Europe | Long term (≥ 4 years) |
| Increasing industrial waste generation volumes | 1.2% | Global, with highest impact in Germany, Netherlands, Belgium | Medium term (2-4 years) |
| Demand for secondary raw materials in EV battery supply chains | 1.1% | Germany, France, Poland, Hungary automotive corridors | Medium term (2-4 years) |
| Growing corporate sustainability & ESG pressure | 0.9% | Western Europe core, expanding to Central & Eastern Europe | Medium term (2-4 years) |
| Digital tracking & blockchain for waste traceability | 0.7% | NORDICS and BENELUX leading, gradual EU adoption | Short term (≤ 2 years) |
| Industrial symbiosis parks for waste-to-input exchange | 0.6% | Germany, Netherlands, Denmark with spillover to neighboring regions | Long term (≥ 4 years) |
| Source: Mordor Intelligence | |||
Stringent EU Waste Management Directives
New EU rules create a decisive pull toward higher recovery rates and full traceability. The Packaging and Packaging Waste Regulation, effective February 2025, requires all packaging to be recyclable by 2030 and sets a 15% reuse mandate by 2040. The updated Waste Framework Directive tightens extended-producer-responsibility schemes and standardizes classification codes to ease cross-border movements. Meanwhile, the Waste Shipments Regulation bans exports of plastic waste to non-OECD states from November 2026 and enforces digital tracking via the DIWASS system. These laws push industrial generators to partner with certified providers capable of meeting stringent targets, which directly expands high-value segments such as recycling, energy recovery, and hazardous-waste neutralization. Although enforcement still varies across member states, the cumulative regulatory push adds 1.8 percentage points to the forecast CAGR of the European industrial waste management market.
Increasing Industrial Waste Generation Volumes
Europe’s factories, chemical parks, and construction sites continue to produce larger waste streams as output grows and product cycles shorten. Hazardous waste climbed 2.25% per year between 2010 and 2024, with chemical and petrochemical hubs in Germany’s Rhine-Ruhr region and the Netherlands generating the bulk of complex by-products requiring specialized treatment. Construction-material manufacturing alone discharges close to 400 million tonnes of largely non-hazardous debris annually, reinforcing demand for advanced sorting and recovery services. Electronics producers amplify the trend by releasing difficult-to-process miniaturized components rich in rare earth elements and precious metals. Although the Industrial Emissions Directive obliges plants to adopt best available techniques for waste minimization, the build-out of battery and renewable-energy supply chains offsets reduction gains. Overall, greater industrial output directly fuels volume growth in the European industrial waste management market, prompting operators to expand capacity, upgrade technology, and refine logistics networks.
Demand for Secondary Raw Materials in EV Battery Supply Chains
Surging electric-vehicle production triggers appetite for recycled lithium, cobalt, and nickel. Battery-grade materials sourced from waste streams can cut carbon footprints and hedge against volatile commodity prices. Germany, France, and BENELUX dominate early-stage demand as cell-making plants scale up, while Eastern Europe begins to follow. Dedicated recovery facilities emerge next to gigafactories, enabling short supply loops that align with extended-producer-responsibility mandates and cut logistics costs. Operators with hydrometallurgical or pyrometallurgical expertise are poised to capture premium margins, adding 0.6 percentage points to the CAGR of the European industrial waste management market.
Growing Corporate Sustainability & ESG Pressure
Industrial clients face unprecedented scrutiny from investors, regulators, and customers who demand evidence of circular practices. Under the Corporate Sustainability Reporting Directive, firms must disclose granular waste generation and treatment data, motivating them to outsource to providers that guarantee 95% diversion or better. Veolia’s GreenUP program, backed by USD 2.18 billion (EUR 2 billion) through 2027, exemplifies how service providers invest to meet stringent ESG goals. In parallel, automakers and electronics brands impose closed-loop sourcing requirements on suppliers, thus stimulating demand for secondary materials and certified treatment channels. Carbon-accounting frameworks now include Scope 3 emissions from waste handling, rewarding low-carbon solutions such as anaerobic digestion over incineration. Together, these forces elevate contract values, accelerate the adoption of advanced technologies, and reinforce the growth outlook for the European industrial waste management market.
Restraints Impact Analysis of Europe Industrial Waste Management Market*
| Restraints | (~) % Impact on CAGR Forecast | Geographic Relevance | Impact Timeline |
|---|---|---|---|
| High CAPEX for advanced treatment facilities | -1.4% | EU-wide, particularly acute in Eastern Europe | Medium term (2-4 years) |
| Skilled-labour shortage in Eastern Europe | -1.1% | Poland, Czech Republic, Slovakia, Hungary | Short term (≤ 2 years) |
| Fragmented regulatory enforcement across EU | -0.8% | Eastern Europe primary, with compliance gaps in Southern Europe | Long term (≥ 4 years) |
| Volatile prices for recycled industrial materials | -0.6% | Global impact with regional variations in commodity exposure | Medium term (2-4 years) |
| Source: Mordor Intelligence | |||
High CAPEX for Advanced Treatment Facilities
Building state-of-the-art recycling or waste-to-energy assets is capital-intensive. A typical plant costs USD 4-10 million per MW, while advanced recycling installations run USD 54-218 million (EUR 50-200 million) depending on scale. LyondellBasell’s German chemical-recycling project secured USD 43.6 million (EUR 40 million) in EU funding, and CIRCTEC raised USD 163.5 million (EUR 150 million) for Europe’s largest tire-pyrolysis unit. Carbon-capture retrofits add USD 109-164 per tonne of CO₂ capacity. Eastern Europe struggles to mobilize such funding because local financiers view waste assets as higher-risk, slowing deployment, and shaving 0.8 percentage points off the European industrial waste management market growth rate[2]European Investment Bank, “Financing the Circular Economy 2024,” eib.org.
Skilled-Labor Shortage in Eastern Europe
Czech Republic logged more than 215,000 open technical positions in 2024, and wage inflation in waste services runs 10-20% annually across Poland, Slovakia, and Hungary. Operators accelerate automation, but robotics cannot fully replace certified technicians needed for hazardous-waste handling. Installation of AI systems rises, yet maintenance demands specialized staff still in short supply. As a result, operating costs swell and capacity expansions stall, clipping 1.1 percentage points from the European industrial waste management market’s CAGR in the near term.
*Our forecasts treat driver/restraint impacts as directional, not additive. The impact forecasts reflect baseline growth, mix effects, and variable interactions.
Europe Industrial Waste Management Market Segment Analysis
By Service:
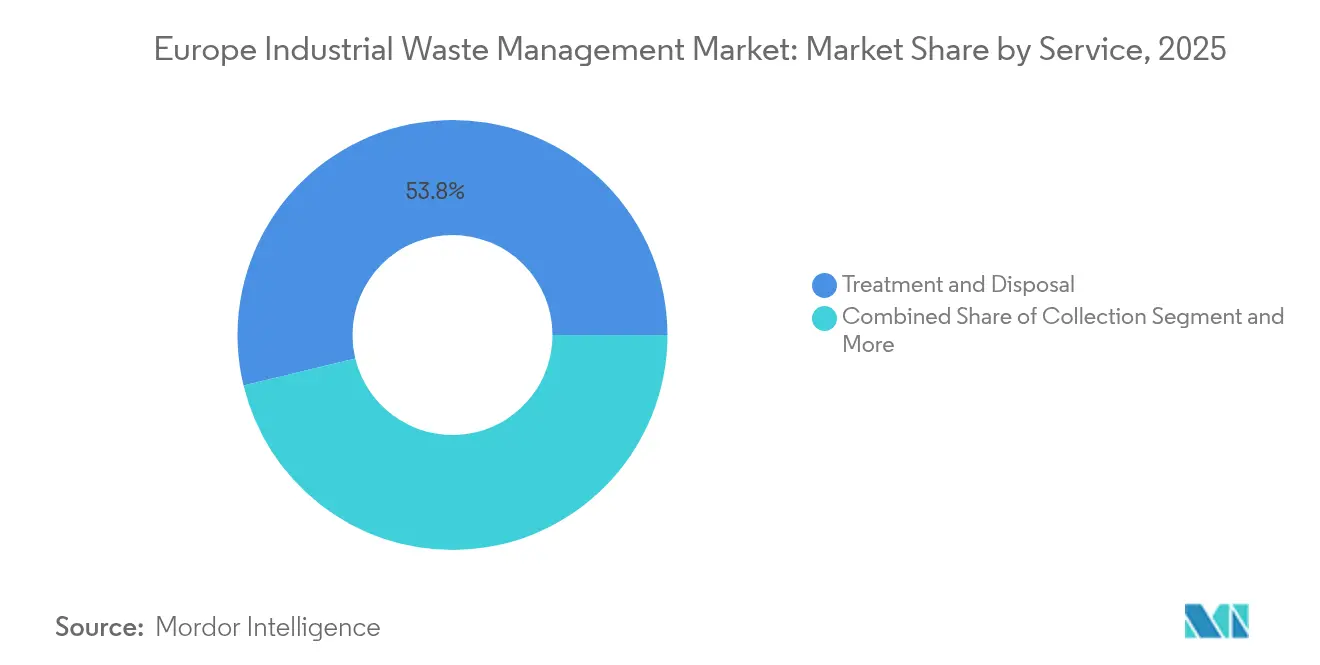
Treatment & Disposal Retains Primacy as Recycling SurgesTreatment & Disposal accounted for 53.78% of the European industrial waste management market share in 2025, cementing its role as the backbone of hazardous-waste neutralization and legacy infrastructure. This dominance stems from significant sunk investment in incinerators, physicochemical plants, and secure landfills that serve Germany, the Netherlands, and Belgium. Large chemical clusters rely on these facilities to comply with EU directives that forbid untreated hazardous output. Steady upgrades such as flue-gas cleaning and carbon-capture units maintain regulatory conformity and underpin stable cash flows. Collection and logistics services, though smaller, benefit from rising volume and specialized transport mandates for toxic streams. Digital route optimization and the impending DIWASS platform streamline cross-border documentation and elevate service value across the European industrial waste management market.
Recycling & Material Recovery is the fastest-growing service at a 6.72% CAGR through 2031, reflecting the pivot to circular models. Projects like LyondellBasell’s German chemical-recycling plant and CIRCTEC’s tire-pyrolysis unit illustrate capital intensity and innovation depth needed to unlock polymer and rubber value. Industrial symbiosis networks multiply feedstock availability by turning one firm’s waste into another’s input, especially in chemical parks. EU extended-producer-responsibility schemes under the PPWR mandate minimum recycled content in packaging, driving sustained demand. These dynamics propel the segment’s share upward across the European industrial waste management market and attract equity capital despite high technical hurdles.



By Disposal Method:
Landfill Legacy Under Pressure from Energy RecoveryLandfill maintained a 44.32% slice of the European industrial waste management market size in 2025, anchored in historical capacity, simple permitting, and lower gate fees in parts of Eastern Europe. Yet escalating landfill taxes, stricter contamination thresholds, and public opposition have begun to erode its long-held lead. Operators face mounting obligations to capture methane and monitor leachate, inflating operational expenditures. Some choose to downsize or retrofit inactive cells into solar farms, diversifying revenue but shrinking pure landfill tonnage within the European industrial waste management market.
Incineration & Energy Recovery displays the quickest expansion at 7.31% CAGR, buoyed by more than USD 2.18 billion (EUR 2 billion) invested annually in new waste-to-energy units across the continent. SUEZ’s USD 1.53 billion (EUR 1.4 billion) Toulouse facility, which integrates carbon capture, showcases evolving emission standards and added revenue through renewable-electricity certificates. Refuse-derived-fuel programs supply cement kilns, potentially displacing up to 85% of fossil heat needs. Enhanced thermal-plant efficiencies and co-location with district-heating networks boost attractiveness, progressively drawing volumes away from landfill and raising the profile of energy-recovery routes within the European industrial waste management market.
By Waste Type:
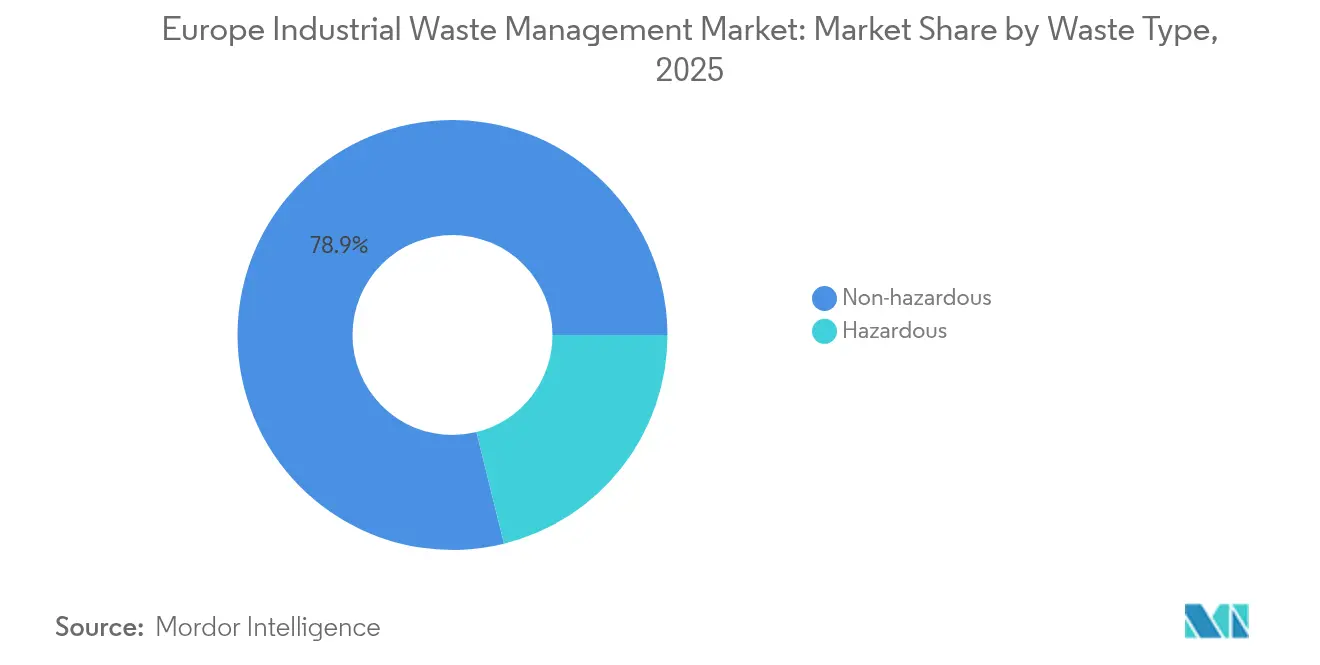
Non-Hazardous Base Faces Rising Hazard ComplexityNon-hazardous waste captured 78.85% of the European industrial waste management market share in 2025, thanks to vast construction, packaging, and manufacturing residuals. Construction-and-demolition debris dominates tonnage, and existing recycling centers deliver aggregates back to roadbuilding and concrete mixes, supporting mandatory recycling thresholds. Symbiosis frameworks further monetize non-hazardous by-products by linking producers with neighboring industries that value secondary inputs. Policy incentives and reduced landfill levies for inert materials help sustain steady growth, although mature infrastructure means the segment’s CAGR will lag the market average.
Hazardous waste, while smaller, is advancing at a 5.15% CAGR until 2031. Electronics assembly, battery gigafactories, and specialty-chemical plants generate intricate waste streams requiring advanced stabilization, solvent recovery, or metallurgical extraction. EU shipment rules impose tight tracking and treatment standards, favoring large operators with pan-European permits and specialized incinerators. High gate fees and capacity scarcity bolster margins, positioning hazardous-waste handling as a premium niche within the European industrial waste management market.
By Industry:
Construction Materials Dominant as Electronics AccelerateConstruction Materials commanded 31.95% of the European industrial waste management market size in 2025, propelled by ongoing renovation and infrastructure expansion across Germany, France, and the Nordics. Projects generate heavy volumes of concrete, metals, and timber that must meet diversion targets before landfill acceptance. Dedicated sorting lines and mobile crushers enhance onsite recovery rates, while regulated aggregates supply road beds and precast units, forming closed loops that align with circular-economy goals.
Electrical & Electronics, with an 7.96% CAGR, is the fastest-moving industrial client segment. Shorter product lifecycles, rising chip demand, and EV adoption inflate waste streams rich in precious metals and critical minerals. WEEE legislation imposes producer responsibility, stimulating certified collection schemes and specialist recovery plants. Automated dismantling lines and hydrometallurgical processes yield high-purity outputs for new battery and semiconductor production, elevating strategic interest in this segment across the European industrial waste management market.
Geography Analysis
Germany Industrial Waste Management Market
Germany held 23.12% of the European industrial waste management market in 2025, underpinned by the continent’s densest network of waste-to-energy plants, cutting-edge recycling hubs, and stringent enforcement of EU directives. Its Rhine-Ruhr chemical corridor exemplifies integrated treatment architecture, where hazardous incineration, solvent recovery, and industrial symbiosis occur within a single cluster. High tipping fees for landfills and generous renewable-energy tariffs stabilize revenue for thermal operators. National strategy emphasizes carbon-neutral waste management by 2045, driving pilot carbon-capture retrofits and AI-enabled material-sorting installations.
France and Italy Industrial Waste Management Market
France and Italy remain sizable, although regional compliance disparities create patchy performance. France’s updated anti-waste law accelerates reuse and bans the destruction of unsold goods, expanding the service scope for providers able to guarantee double-digit diversion rates. Italy’s North-South divide persists, with Lombardy approaching EU recycling targets while southern regions still depend heavily on landfill. Both countries witness public-private partnerships financing new energy-recovery units to close capacity gaps in the European industrial waste management market.
Broader European Markets
The Rest-of-Europe grouping, which encompasses Eastern and smaller Western states, shows the fastest growth at 7.12% CAGR to 2031. EU accession and structural-fund inflows finance state-of-the-art facilities in Poland, the Czech Republic, and Slovakia. Yet acute skilled-labor deficits spur automation and cross-border talent mobility programs. Investment vehicles anchored by Macquarie and EDF track local concessions, consolidating fragmented municipal operators. Harmonization of waste codes and DIWASS adoption reduces administrative frictions, opening space for integrated service offerings across borders within the European industrial waste management market.
Coverage of the industrial waste management market by Mordor Intelligence spans a wide geographic footprint, with regional analysis available for North America and Middle East, alongside detailed country-level intelligence for United Arab Emirates, each shaped by local operating conditions.
Regulatory Landscape
EU-wide legislation continues to tighten traceability, shipment controls, and end-markets for recovered materials, directly shaping permitting and compliance costs for industrial generators and waste-service providers. Regulation (EU) 2024/1157 on shipments of waste entered into force in May 2024 and is being implemented alongside the EU push for a circular economy, raising the bar on cross-border documentation and control of export flows. The Packaging and Packaging Waste Regulation (PPWR), in force since February 2025, reinforces recyclable-design and recycled-content pathways that increase demand for certified sorting, recycling, and quality-assurance services across industrial packaging streams.
Industrial permitting and treatment standards are also being tightened through updates linked to the Industrial and Livestock Rearing Emissions Directive (IED 2.0), which applies from August 2024, with revisions to IED permits beginning in July 2026. In parallel, the European Commission proposed EU-level End-of-Waste criteria for plastics in December 2025, with formal publication tracked into 2026, a step that supports more consistent secondary-material classification across Member States. Policy packaging is also under active legislative review in the European Parliament, where an Omnibus Package covering environment and industrial emissions is being discussed, including committee activity referenced for July 2026, adding near-term compliance focus for operators active in hazardous waste and thermal treatment.
Value Chain Analysis
The European industrial waste management value chain starts with industrial waste generation and onsite segregation (hazardous and non-hazardous), then moves through specialized collection and transport under ADR and shipment-document controls, followed by pre-treatment (sorting, dewatering, shredding, neutralization) and downstream recovery or disposal. Treatment routes include high-temperature incineration, physicochemical treatment, secure landfill for residues, and material recovery via mechanical recycling and advanced processes (chemical recycling, pyrolysis, hydrometallurgy for high-value streams such as battery-related wastes). Offtake markets include secondary raw materials for packaging and manufacturing, refuse-derived fuels for cement and energy-from-waste, and recovered metals and critical minerals from electronics and industrial residues.
Digitization is becoming a core connective layer across the chain as EU shipment controls and traceability requirements move toward standardized electronic workflows (including DIWASS-driven tracking referenced in the report context), increasing demand for compliant data capture at the generator, transporter, and facility levels. Larger integrated players (for example, Veolia) increasingly bundle collection, hazardous treatment, and specialty services such as soil decontamination and solvent recovery into multi-country platforms, while smaller regional firms feed these networks through subcontracting and tuck-in acquisitions. For construction-related waste, pre-demolition audits and permit-linked documentation requirements push more formalized upstream sorting and reporting, increasing the role of certified logistics and auditing partners before materials enter recycling, energy recovery, or landfill routes.
Competitive Landscape
Consolidation defines the competitive tone as private-equity funds and infrastructure investors inject fresh capital. The USD 2.60 billion (GBP 2.1 billion) buy-out of Biffa by Energy Capital Partners and Macquarie’s acquisition of Renewi exemplify a rush to assemble pan-regional platforms capable of offering bundled collection, treatment, and recovery solutions. Such a scale lets players spread R&D costs for AI sorting, blockchain tracking, and carbon-capture modules across multiple sites, reinforcing pricing power in the European industrial waste management market.
Technology leadership is the new battleground. Veolia’s robotic sorting at Southwark increases throughput and purity, enabling premium offtake contracts for recycled polymers. LyondellBasell, SUEZ, and OMV compete to commercialize chemical-recycling pathways that transform mixed plastics into virgin-quality feedstock. Operators leverage predictive analytics to optimize fleet dispatch, shrinking fuel consumption and meeting ESG metrics that win large industrial accounts. Capital intensity and intellectual-property barriers raise entry thresholds, fostering a moderate concentration structure.
Niche specialists focus on high-value waste streams such as battery materials and medical waste or on digital marketplaces that match industrial by-products with end-users. Partnerships with gigafactories or pharmaceutical groups secure stable feedstock and long-term purchase agreements. Eastern Europe offers white-space to deploy advanced technology, but success hinges on mitigating labor shortages through automation and cross-training. Regulatory mastery also differentiates winners; firms boasting ISO 14001, EMAS, and cross-border shipment authorizations command higher margins in the European industrial waste management market.
Europe Industrial Waste Management Industry Leaders
Veolia
Suez
Remondis
PreZero International
Biffa PLC
- *Disclaimer: Major Players sorted in no particular order
Europe Industrial Waste Management Market Companies Covered in this Report
- Veolia
- Suez
- Remondis
- PreZero International
- Biffa PLC
- Urbaser
- FCC Environment
- AVR
- Renewi
- Indaver
- ALBA Group
- Viridor
- Saubermacher Dienstleistungs AG
- Ragn-Sells
- Norsk Gjenvinning
- Paprec Group
- SARP Industries
- Derichebourg Environnement
- Tradebe
Read Analysis of Europe Industrial Waste Management Companies

Market Opportunities and Future Outlook
Regulatory-led standardization and traceability create clear whitespace in compliance-grade digital workflows and cross-border shipment services, particularly for operators that can integrate e-documentation with certified logistics and treatment capacity. The Waste Shipments Regulation (EU) 2024/1157 and the report’s referenced DIWASS tracking requirements shift value toward providers that can reduce administrative friction while maintaining audit-ready chain-of-custody, an advantage for pan-European platforms serving chemical, electronics, and construction-materials clients. In materials recovery, EU action on End-of-Waste criteria for plastics (proposed in December 2025 with 2026 follow-through) supports more consistent secondary-material placement, which strengthens the business case for advanced sorting and upgrading steps that convert industrial plastic streams into specification-grade feedstock.
Specialty and high-liability streams are another opportunity area, as industrial clients tighten ESG disclosure and procurement requirements under EU reporting rules and sector-specific obligations. Veolia has publicly set revenue targets tied to PFAS and micropollutant treatment and to data centers and microelectronics waste by 2030, signaling where leading operators are allocating technology and commercial focus, including hazardous-waste treatment expansion. EU circular-economy policy work on a Circular Economy Act in 2026, framed as enabling a single market for secondary raw materials, reinforces opportunities for operators that can guarantee quality, certification, and stable offtake for recovered materials, especially in packaging-linked streams governed by the PPWR and in high-value industrial residues that require advanced treatment capabilities.
Recent Industry Developments in Europe Industrial Waste Management Market
- June 2026: REMONDIS officially opened a new 18,000 square meter branch at Brinker Hafen in Hanover. The expansion broadens regional processing capacity and strengthens circular-economy services. The rollout enhances coverage for industrial waste operations in the region.
- May 2026: REMONDIS launched a pilot project with Jokey Group in the Ruhr region to collect and recycle polypropylene (PP) food packaging, submitting the process to the European Commission as a Novel Technology. The initiative advances PP packaging recycling and novel-technology pathways. The initiative supports higher value recovery and regulatory alignment for packaging waste.
- April 2026: SUEZ secured authorization to expand the Villeparisis hazardous waste storage facility in the Seine-et-Marne department, increasing treatment capacity to 250,000 tonnes per year. Increases hazardous-waste handling capacity in a key French site. The expansion strengthens scale and resilience in hazardous-waste operations for Europe footprint.


Europe Industrial Waste Management Market Report Scope and Research Methodology
Market Definition and Coverage
This market covers the revenues earned from managing industrial waste across Europe, including the core services that move, treat, recover, and dispose waste generated by industrial activities under applicable permitting and compliance needs.
Scope exclusions: It excludes municipal household waste services and informal handling that is not captured through regulated, reported industrial waste channels.
Segments Covered in This Report
- By Service
- Collection
- Transportation & Logistics
- Treatment & Disposal
- Recycling & Material Recovery
- By Disposal Method
- Landfill
- Recycling
- Incineration & Energy Recovery (RDF, SRF, WtE)
- By Waste Type
- Non-hazardous
- Hazardous
- By Industry
- Chemicals & Petrochemicals
- Oil & Gas
- Power Generation
- Metal & Mining
- Food & Beverage Processing
- Pharmaceuticals
- Electrical & Electronics
- Construction Materials
- By Geography
- United Kingdom
- Germany
- France
- Italy
- Spain
- BENELUX (Belgium, Netherlands, and Luxembourg)
- NORDICS (Denmark, Finland, Iceland, Norway, and Sweden)
- Rest of Europe
Data Sources, Market Sizing, and Validation
Desk Research
Desk research was used to build a consistent fact base on industrial waste generation, treatment routing, and the main compliance requirements that shape how volumes move across Europe. We relied on public statistics and policy references such as Eurostat waste generation series, European Environment Agency waste indicators, and EU legal texts that govern waste shipments and treatment obligations.
To connect volumes with value, supporting context was taken from sources such as national environment agencies, customs and shipment publications where relevant, and peer reviewed studies that discuss treatment yields and recycling economics. We also reviewed company annual reports, investor presentations, and credible press coverage for facility additions, permit changes, and country exposure. In a few places, paid subscriptions for company financials, news and financials, and shipment level trade checks were used to confirm timing and directional splits. The sources listed here are illustrative, and many other public and licensed references were also used to collect data, validate assumptions, and clarify open questions.
Primary Interviews and Surveys
Primary work focused on validating how industrial waste is classified, how it is priced by treatment route, and where cross border movement is constrained in day to day operations. We spoke with a mix of waste operators, industrial waste generators, and sector advisors across major European countries, so the desk research assumptions could be adjusted before final totals were finalized.
Distribution of primary research fieldwork respondents
| Company type | Respondent position |
|---|---|
| Top tier: 31% | CXOs: 15% |
| Mid tier: 53% | Functional/Unit leaders: 38% |
| Smaller Players: 16% | Managers: 47% |
Market-Sizing & Forecasting
Sizing starts from a top-down build where industrial waste volumes by country and economic activity are reconstructed from official waste statistics, and then routed across recycling, landfill, and incineration and energy recovery based on observed treatment mixes. Those routed volumes are then valued using service price bands that reflect collection and transport needs, treatment intensity, and compliance costs, and the full market total is reached only after country weighting and currency timing are applied.
We then pressure test totals with selective bottom-up approximations, such as sampled facility capacity checks, operator revenue exposure by service line, and volume times average price sanity checks for major waste streams. Inputs that most often moved the model were hazardous versus non-hazardous share, country level landfill restrictions and taxes, permitted treatment capacity utilization, cross border shipment friction, and the spread between gate fees for recycling versus thermal treatment.
Forecasting was done using scenario analysis supported by trend checks on industrial output, energy price sensitivity for waste-to-energy economics, and policy driven diversion targets. When bottom-up information was incomplete for a country or waste stream, gaps were handled using peer country ratios and then re-tested in interviews so the totals stayed realistic.
Data Validation & Update Cycle
Outputs were checked against independent signals such as reported waste generation trends, treatment capacity announcements, and country policy changes that can shift routing quickly. Variances were investigated through stepwise reviews where assumptions were revisited, outliers were traced back to a country, waste type, or disposal route, and then the model was adjusted only when the change could be explained.
If a major variance appeared late in the process, respondents were re-contacted for confirmation on the driver, which helped avoid overreacting to a single data point. Reports refresh annually, with interim updates for material events such as new permitting rules, major facility shutdowns, or sharp cost swings. Before delivery, an analyst performs a fresh pass so clients receive the latest updated view.
Mordor Intelligence's Europe Industrial Waste Management Market Estimate Compared With Other Published Estimates
Published market values for Europe industrial waste management can differ because each publisher chooses a different mix of services, waste types, and country coverage, and then applies its own pricing and routing assumptions. Currency timing and the selected base year can also shift the reported value even when the same region is being discussed.
The main gap comes from whether non-industrial waste services get blended into the same total and how hazardous handling is priced when routing includes pre-treatment, transport, and final treatment steps, where Mordor Intelligence ties value to regulated industrial waste streams and validates splits using disposal route mixes and country level policy constraints.
Benchmark comparison
| Source | Market Size | Gaps in Research Methodology |
|---|---|---|
| Mordor Intelligence | USD 53.65 B (2025) | |
| Trade Journal A | USD 47.14 B (2024) | Uses an earlier base year and often reflects a broader services pool, where pricing is less consistently anchored to treatment route differences and country level routing constraints. |
| Regional Consultancy B | USD 46.90 B (2025) | Leans on simplified averages and does not clearly separate hazardous handling intensity and cross border shipment friction, which can compress the value estimate. |
The spread in the table is largely explained by base year choice and by how tightly the value is linked to industrial waste streams versus broader waste services. By keeping the model tied to observable routing mixes, service price bands, and policy signals by country, the final figure remains traceable to clear steps that can be repeated and reviewed.


Key Questions Answered in the Report
How large is the European industrial waste management market in 2026?
The European industrial waste management market size reached USD 56.65 billion in 2026.
What is the forecast CAGR for European industrial waste services?
The market is projected to grow at a 5.59% CAGR from 2026 to 2031.
Which service category holds the biggest share?
Treatment & Disposal leads with 53.78% of the market in 2025.
Which country dominates industrial waste management in Europe?
Germany holds 23.12% of regional revenue thanks to advanced infrastructure and strict enforcement.
What is the fastest-growing industry segment for waste volume?
Electrical & Electronics waste streams are expanding at an 7.96% CAGR through 2031.
How will digital tracking affect cross-border waste shipments?
The EU’s DIWASS blockchain system, mandatory from May 2026, will cut paperwork and improve traceability, lowering administrative costs by roughly 30%.
Page last updated on:


 Your data is secure and never sold or shared.


