
Energy Logistics Market Size and Share
Market Overview
| Study Period | 2020 - 2031 |
|---|---|
| Market Size (2026) | USD 210.21 Billion |
| Market Size (2031) | USD 306.73 Billion |
| Growth Rate (2026 - 2031) | 7.85 % |
| Fastest Growing Market | Asia Pacific |
| Largest Market | Asia-Pacific |
| Market Concentration | Medium |
Major Players *Disclaimer: Major Players sorted in no particular order Image © Mordor Intelligence. Reuse requires attribution under CC BY 4.0. | |
Energy Logistics Market Analysis by Mordor Intelligence
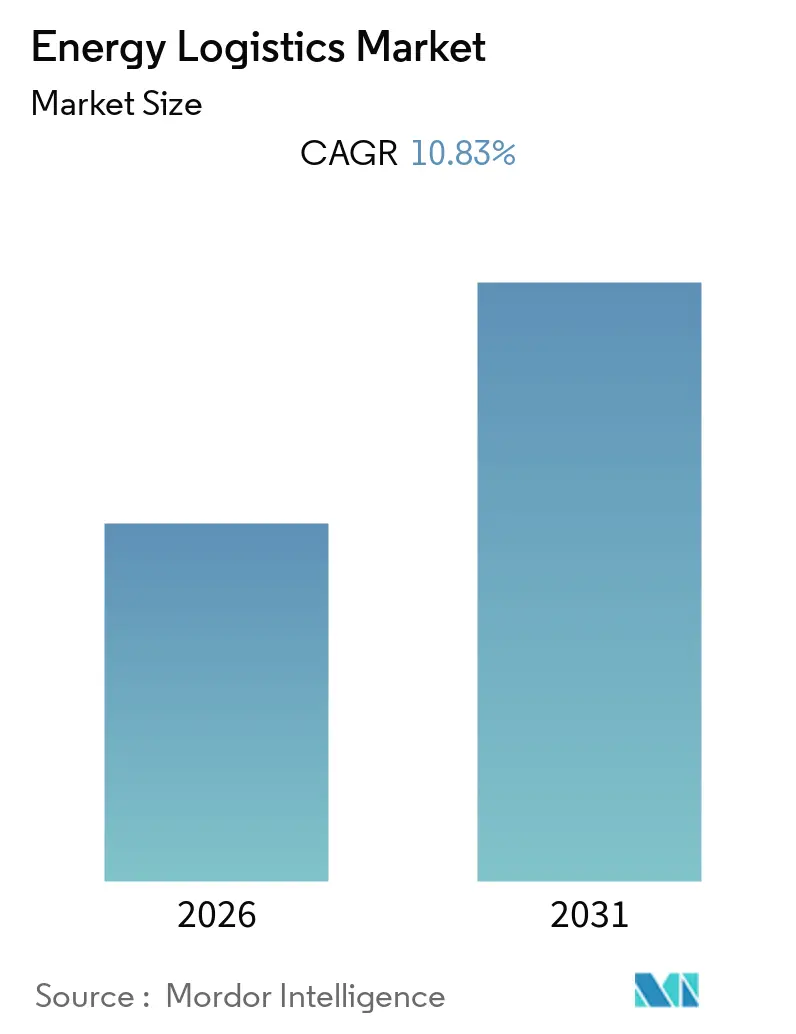
The energy logistics market size was valued at USD 193.02 billion in 2025, and is estimated to grow from USD 210.21 billion in 2026 to reach USD 306.73 billion by 2031, registering a CAGR of 7.85% between 2026 and 2031.
Cross-border trade in LNG, petroleum products, critical minerals, and renewable equipment continued to reshape freight planning across producing and consuming regions. Renewable projects increased demand for heavy lift, hazardous-goods handling, staging, and scheduled site delivery. Conventional oil and gas supply chains also remained active, preserving demand for offshore support, refinery logistics, and dedicated transport. Providers increasingly competed on reliable execution, regulatory capability, asset availability, and visibility across multiple transport modes. Route disruption, port congestion, intermodal costs, and uneven infrastructure constrained network capacity in several regions.
Key Report Takeaways
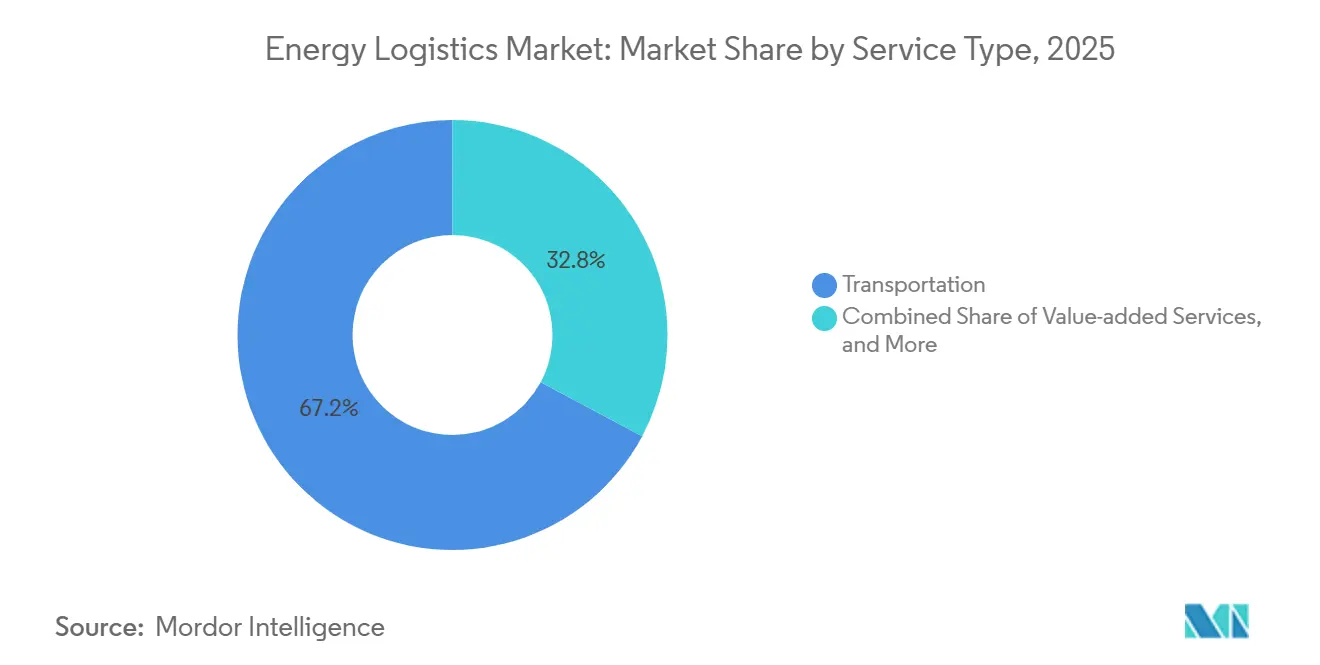
- By service, transportation led with 67.19% of the energy logistics market share in 2025, while value-added services recorded the highest projected CAGR at 10.37% through 2031.
- By transportation mode, road held 42.83% of of the energy logistics market size of transportation revenue in 2025, while air logistics recorded the highest projected CAGR at 9.92% through 2031.
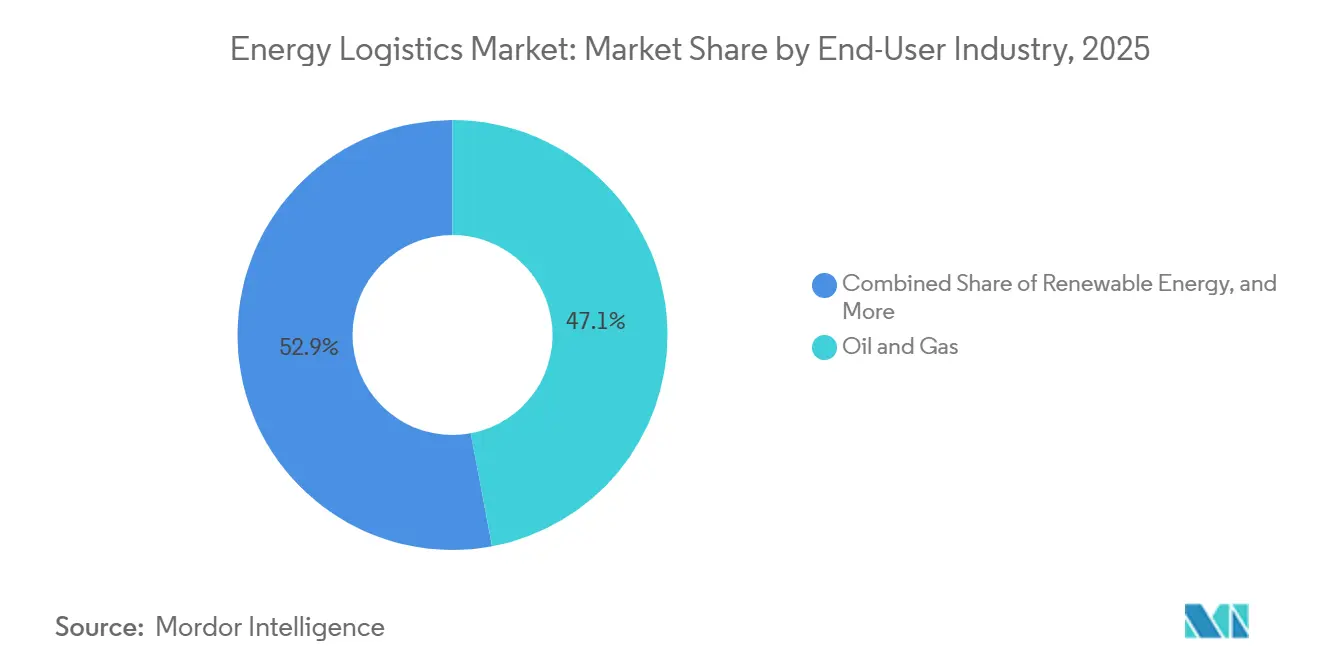
- By end-user, oil and gas held 47.06% of the energy logistics market share in 2025, while renewable energy recorded the highest projected CAGR at 10.65% through 2031.
- By geography, Asia-Pacific held 42.54% of the energy logistics market size in 2025 and recorded the highest projected CAGR at 9.61% through 2031.
Note: Market size and forecast figures in this report are generated using Mordor Intelligence’s proprietary estimation framework, updated with the latest available data and insights as of January 2026.
Global Energy Logistics Market Trends and Insights
Drivers Impact Analysis*
| Driver | (~) % Impact on CAGR Forecast | Geographic Relevance | Impact Timeline |
|---|---|---|---|
| Cross-Border Energy Trade and Energy-Security Investment | +1.8% | Global, concentrated in North America, Asia-Pacific, and MEA | Medium term (2-4 years) |
| Renewable Energy and Battery Storage Project Logistics Expansion | +1.6% | Global, led by Asia-Pacific and North America | Long term (≥ 4 years) |
| Digital Tracking, Control Towers, and Logistics Automation | +1.2% | Global, early gains in North America and EU | Short term (≤ 2 years) |
| Multimodal Infrastructure and Energy Project Development | +1.1% | Asia-Pacific, North America, MEA | Medium term (2-4 years) |
| Remote-Site and Offshore Supply-Chain Criticality | +0.9% | Asia-Pacific, MEA, North Sea, United Kingdom, and Norway | Long term (≥ 4 years) |
| Specialized Logistics for Oversized, Hazardous, and Time-Critical Cargo | +0.7% | Global, concentrated in MEA and Asia-Pacific | Short term (≤ 2 years) |
| Source: Mordor Intelligence | |||
Growth in Cross-Border Energy Trade and Energy-Security Investment
Cross-border energy trade created sustained freight requirements at export facilities and receiving infrastructure. Global LNG trade grew 6.7% in 2025, while LNG supply is forecast to expand by more than 7% by the end of 2026. North America accounted for more than 85% of incremental supply growth during 2026.[1]“Gas Market Report, Q1-2026,” IEA Publications, iea.org North American LNG export capacity was on track to rise from 11.4 billion cubic feet per day at the start of 2024 to 28.7 billion cubic feet per day by 2029. LNG exports averaged 17.4 billion cubic feet per day in the first half of 2026, up 23% from the prior year. New export terminals required construction cargo, while import terminals required equipment procurement, transport, and storage capacity. The United States International Development Finance Corporation and I Squared Capital announced a USD 3 billion platform for LNG and petroleum products import, storage, and transport infrastructure across South and Southeast Asia.
Renewable Energy and Battery Storage Project Logistics Expansion
Renewable capacity additions increased demand for specialized transport, storage, and final-mile delivery across the energy logistics market. Renewable power capacity is projected to increase by nearly 4,600 GW between 2025 and 2030, with solar PV representing 80% of the expansion. Battery energy storage systems became a core project-cargo category because they needed hazardous-goods certification, thermal controls, and delivery timed to grid commissioning. DHL Group announced that it planned to expand New Energy logistics revenue from USD 650 million in 2025 to USD 3.3 billion by 2030. The energy logistics market, therefore, required providers to combine throughput capacity with cargo engineering. Battery systems created heavier-lift and more complex, dangerous-goods work than the solar modules they supported. Early renewable project budgets did not always fully reflect that handling complexity.
Digital Tracking, Control Towers, and Logistics Automation
Energy operators placed more weight on shipment visibility because delays could affect commissioning schedules and asset uptime. Digital control systems became more important as energy operators managed shipments across vessels, trucks, aircraft, and field locations. A shared view of shipment data supported earlier responses to disruptions and more consistent coordination between suppliers, forwarders, and site teams. Operators used these systems to identify dwell time, schedule exposure, and documentation gaps before they affected delivery. Fleet performance tools also supported emissions tracking and LNG cargo management across chartered vessels. Digital control reduced the administrative burden associated with multiple transport modes. This capability separated providers offering live operational control from those still relying on fragmented processes.
Multimodal Infrastructure and Energy Project Development
Multimodal investments changed the cost and schedule choices available to project planners in the energy logistics market. Japan's Inpex broke ground on the USD 21 billion Abadi LNG project in eastern Indonesia in July 2026, requiring coordinated maritime, river, and road logistics for a remote Arafura Sea site. The Asian Transport Observatory estimated that Asia-Pacific low- and middle-income economies needed USD 2.6 trillion in annual transport infrastructure investment from 2025 to 2035.[2]“Asia LMIC Transport Outlook, Investment Needs Released,” Asian Transport Observatory, asiantransportobservatory.org Port areas were projected to grow 24% and aerodrome areas 144% by 2035. New transfer points allowed cargo to move between road, rail, sea, and inland waterways at more suitable points in the journey. This infrastructure reduced a constraint that had limited complex projects in high-growth locations.
Restraints Impact Analysis*
| Restraint | (~) % Impact on CAGR Forecast | Geographic Relevance | Impact Timeline |
|---|---|---|---|
| Fragmented Infrastructure and High Intermodal Transfer Costs | -1.2% | Global, acute in Africa and developing Asia-Pacific markets | Medium term (2-4 years) |
| Complex Safety, Customs, and Environmental Compliance | -0.9% | Global, concentrated in MEA cross-border corridors and North America | Short term (≤ 2 years) |
| Port, Vessel, and Heavy-Lift Bottlenecks for Renewable Projects | -0.7% | Asia-Pacific, Europe, MEA | Long term (≥ 4 years) |
| Low Visibility of Scope 3 Emissions and Inconsistent Data Standards | -0.5% | Global, primarily EU and North America | Long term (≥ 4 years) |
| Source: Mordor Intelligence | |||
Fragmented Infrastructure and High Intermodal Transfer Costs
Fragmented infrastructure raised execution risk where remote facilities depended on several transport modes. Access routes often combined ports, roads, storage yards, river links, and local delivery capacity with uneven reliability. In African downstream networks, government price subsidies reduced margins and discouraged private investment in distribution infrastructure. The resulting gaps added logistics costs to project development and limited the ability of networks to handle greater volumes. Port, vessel, and heavy-lift bottlenecks also constrained renewable projects in Asia-Pacific, Europe, the Middle East, and Africa. In the energy logistics market, these bottlenecks delayed the movement of oversized components and reduced the usable capacity of otherwise growing project pipelines.
Complex Safety, Customs, and Environmental Compliance
Safety, customs, and environmental requirements added variable costs to energy logistics across cargo classes and transport modes. Battery energy storage systems classified as Class 9 miscellaneous dangerous goods require dedicated certification, handling procedures, and emergency-response plans. These requirements added lead time and cost, particularly for renewable project operators handling these units for the first time. New United States tariffs on selected Canadian goods began in August 2026, followed by Canadian measures, affecting USD 20 billion in targeted trade flows. The resulting changes required route review and documentation redesign for cross-border energy supply chains. European hydrogen logistics also faced planning complexity as the Hydrogen and Decarbonised Gas Directive moved through member-state implementation during 2026.
*Our forecasts treat driver/restraint impacts as directional, not additive. The impact forecasts reflect baseline growth, mix effects, and variable interactions.
Segment Analysis
By Service: Transportation Anchored Revenue While Value-Added Services Reshaped Margins
Transportation held 67.19% of the energy logistics market share in 2025. Its position reflected the continuous movement required by LNG trade and distributed renewable projects. Transportation covered the physical flow of cargo from ports, yards, and production sites to remote energy assets. Warehousing and storage developed alongside battery projects and LNG receiving terminals. Permanent staging facilities increasingly replaced temporary laydown areas as volumes increased. Port of Newcastle received state approval in late 2025 to stage grid-scale battery systems at its Mayfield Terminal. The port also invested USD 25 million in a berth extension for larger project-cargo vessels. These assets supported storage, consolidation, and controlled transfer before site delivery.
Value-added services recorded the highest forecast CAGR of 10.37% from 2026 to 2031 in the energy logistics market. This service group included customs brokerage, NORM waste management, health, safety, security, environment, and quality compliance, and shipment visibility. Energy operators used these services to manage regulatory requirements alongside transport execution. Integrated contracts placed transportation, staging, customs, and site delivery under one provider. This structure favored logistics companies that could coordinate the full project scope. ASCO secured a nine-figure North Sea services contract in June 2025, showing the long-duration model used in established energy relationships. The energy logistics industry benefited from such bundled contracts because they provided greater continuity than stand-alone project moves. Renewable contracts still had not replicated that level of recurring service revenue at scale.



By Transportation Mode: Road Dominance and Air Logistics Growth Reflected Energy Asset Needs
Road transport held 42.83% of the energy logistics market size of transportation revenue in 2025. It remained the terminal delivery mode for most energy cargo, regardless of the main transit mode. Trucks connected ports, rail terminals, warehouses, and supply bases with refineries, drilling sites, wind farms, and other facilities. Maritime freight carried a major share of international LNG and crude oil trade. Rail supported bulk movements across North American and Central Asian energy corridors. Inland waterways provided an additional option where rivers or canals connected industrial sites. The 2026 Hormuz disruption reinforced the value of flexible overland capacity within the Persian Gulf.
Air transport recorded the highest forecast CAGR of 9.92% from 2026 to 2031. The growth reflected demand for time-critical spare parts at remote and offshore installations, where equipment downtime could outweigh higher freight charges. DHL Group launched Time Definite Plus across 22 European countries in early 2026. The service used front-stocking at more than 1,100 locations and could reach 88% of European wind farms within 4 hours.[3]“DHL Group Ramps Up New Energy Logistics as Demand for Energy Resilience Surges,” ipc.be This network showed how providers built dedicated maintenance, repair, and operations capacity around wind assets. The energy logistics market size for air-linked maintenance activity expanded as wind installations required faster spare-parts delivery. The service also raised switching costs for operators that depended on predictable recovery times.
By End-User: Oil and Gas Stability and Renewable Growth Created Parallel Demand
Oil and gas held 47.06% of the energy logistics market share in 2025. The segment relied on dedicated shore bases, hazardous-material transport fleets, offshore marine support vessels, and NORM management services. These assets created barriers to entry and supported long-term contract renewal. Upstream drilling and offshore activity required scheduled delivery of equipment, consumables, and personnel-support materials. Refinery operations also depended on consistent inbound and outbound transport. Power generation and utilities, mining and metals, and engineering, procurement, and construction contractors added further demand. Critical mineral extraction created remote-site needs that resembled offshore oil and gas support activity.
Renewable energy recorded the highest forecast CAGR of 10.65% from 2026 to 2031. Battery systems, large turbine components, and narrow commissioning windows made renewable project delivery more specialized than conventional cargo movement. The energy logistics market size for renewable projects depended on providers that could manage dangerous goods, heavy lift, and site scheduling together. Government and public infrastructure gained relevance through energy-security programs and LNG import-terminal projects. The USD 3 billion Indo-Pacific platform supported infrastructure for LNG and petroleum products across South and Southeast Asia. These programs created larger and longer-duration logistics requirements. Established providers with strong compliance systems were well placed to serve those contracts.
Geography Analysis
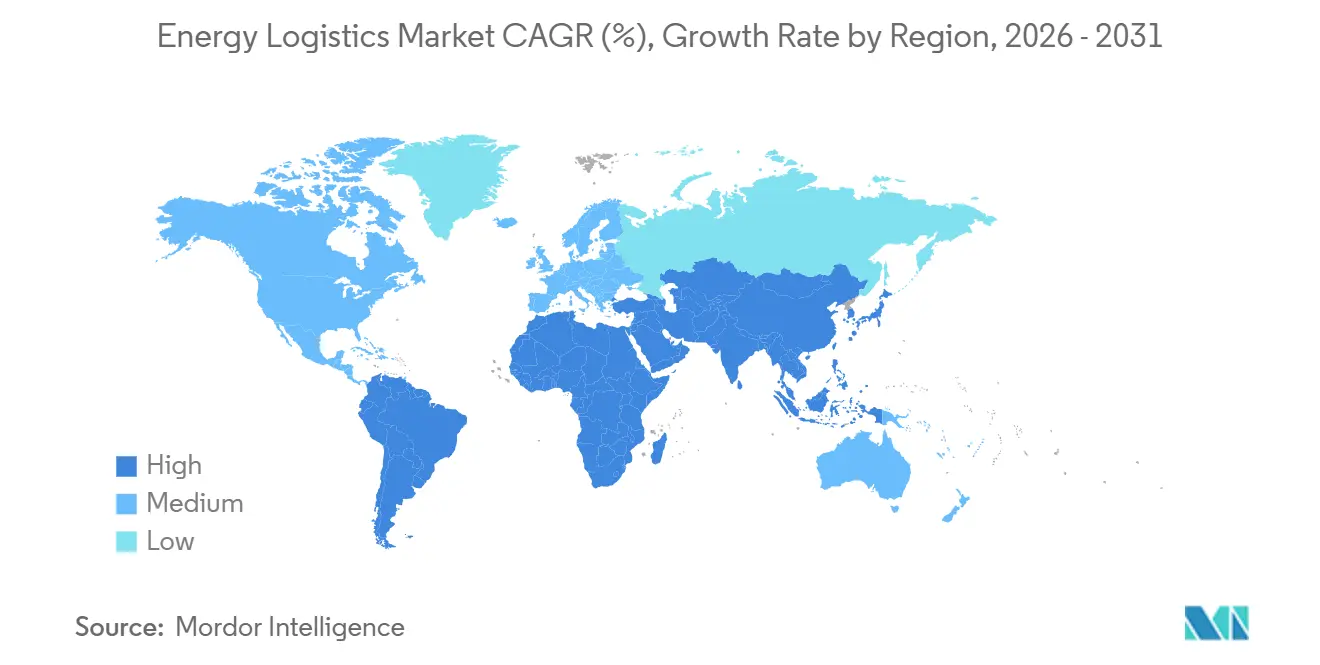
Asia-Pacific held 42.54% of revenue in 2025 and recorded the highest forecast CAGR of 9.61% from 2026 to 2031. LNG import projects, renewable developments, and cross-border energy links increased freight activity across the region. Inpex began work on the USD 21 billion Abadi LNG project in Indonesia in July 2026. Australia's July 2026 National Renewable Energy Priority List added 11 projects, including more than 4 GWh of battery storage. Asia-Pacific was estimated to account for more than 52.4% of global infrastructure investment through the forecast period, while utility-scale storage investment was projected to grow 300%. China, India, Japan, and South Korea supported demand through terminal operations and renewable project work.
North America underwent a major energy logistics transformation as LNG export capacity, pipelines, ports, and specialized carrier capacity expanded. United States LNG exports averaged 17.4 billion cubic feet per day during the first half of 2026, up 23% year-over-year.[4]“2026 Global Gas Report,” International Gas Union, igu.org Cheniere took final investment decisions on additional trains in June 2025 and targeted a capacity of more than 60 million tonnes per annum by 2028. South America also developed as a growth area through Brazil's offshore expansion, Argentina's Vaca Muerta development, and Guyana's production base. ASCO and N.V. Dordt Gateway signed heads of terms in June 2026 for a Suriname marine-support-base venture with a 550-meter quay. The asset targeted offshore logistics demand in the Guyana-Suriname Basin.
Europe had separate logistics needs for hydrocarbons, hydrogen, offshore wind, and carbon capture during 2026. The European Hydrogen Backbone included 33 energy infrastructure operators and identified 40 pipeline projects with 31,500 kilometers of hydrogen pipelines planned for commissioning before 2030. Hydrogen imports into Germany through Amsterdam and Duisburg were technically feasible, with inland waterways, rail, trucks, and future pipelines included in the logistics design. Middle East and Africa carried a different set of risks because the Hormuz crisis constrained 20% of global LNG supply, equal to 3% of total global gas supply. The energy logistics market in these regions placed a premium on route diversification and reliable marine, road, and storage capacity.

Competitive Landscape
The energy logistics market was moderately consolidated among global full-service providers and fragmented across specialized cargo niches. DHL Group, Kuehne + Nagel, A.P. Moller - Maersk, and DSV A/S competed for larger integrated mandates. ASCO Group, Mammoet Group, deugro Group, and ADNOC Logistics & Services held positions in specific sectors, regions, or cargo types. Global providers are increasingly organizing dedicated energy operations rather than serving energy customers from general logistics pools. DHL's New Energy program covered 8 energy-transition segments, including battery storage, hydrogen, and grid infrastructure. This approach recognized that customers placed value on compliance systems and sector experience alongside price.
Greater scale gave large providers more capacity to compete in energy tenders. CEVA Logistics acquired Fagioli Group in December 2025, adding more than 1,000 project-logistics specialists with heavy-lift and transport-engineering capabilities. ADNOC Logistics & Services reported first-half 2026 revenue of USD 2.4 billion, up 40% from the prior year. Its asset-heavy model showed the importance of controlled vessels and specialized capacity as project complexity increased. Companies that operated their own marine or heavy-lift assets could respond more directly to project schedules. Providers without those assets continued to rely more heavily on partner networks and equipment availability.
The clearest opportunity in the energy logistics market lay in integrated renewable and battery-storage projects in emerging economies. These projects needed hazardous-goods certification, heavy-lift capability, and remote-site delivery in a single operating model. Deugro's February 2026 marine equipment investment showed that owned equipment had become a stronger competitive requirement for specialist providers. The energy logistics industry therefore included global networks, regional specialists, and asset-heavy operators with different strengths. The competitive narrative remained consistent with a market that concentrated large mandates among several global providers while retaining many specialized niches.
Energy Logistics Industry Leaders
DHL Group
Kuehne+Nagel
DSV A/S
CMA CGM Group (Including CEVA Logistics)
A.P. Moller – Maersk
- *Disclaimer: Major Players sorted in no particular order


Recent Industry Developments
- September 2026: Deugro established a local marine venture in Papua New Guinea to build logistics capacity for the Papua LNG development, covering dedicated transport equipment, local partnerships, and workforce development programs to handle construction-phase cargo flows from international origins through Port Moresby to project sites.
- July 2026: ADNOC Logistics & Services ordered 4 next-generation LNG carriers from Jiangnan Shipyard for approximately USD 900 million, bringing its total LNG newbuild program to 18 vessels. The 175,000-cubic-meter carriers are scheduled for delivery in 2029 under long-term charters, supporting ADNOC Gas's target of 47 million tonnes per annum of combined marketable LNG by 2035.
- June 2026: ASCO and N.V. Dordt Gateway signed Heads of Terms to establish the Dordt Operations N.V. joint venture for developing and operating the Dordt Marine Support Base in Commewijne, Suriname, featuring a 550-meter quay and 8.0-meter water depth, targeting offshore logistics demand across the Guyana-Suriname Basin.
- June 2026: DHL Group broke ground on a European Battery Logistics Hub in Holtum, Netherlands, with 17,000 square meters of specialized battery storage space, and launched Time Definite Plus wind-farm MRO service across 22 European countries.


Global Energy Logistics Market Report Scope
| Transportation | Road |
| Rail | |
| Air | |
| Sea and Inland Waterways | |
| Warehousing and Storage | |
| Value-added Services |
| Oil and Gas |
| Power Generation and Utilities |
| Renewable Energy |
| Mining and Metals |
| EPC Contractors and Energy Equipment Manufacturers |
| Government and Public Infrastructure |
| Others |
| North America | United States |
| Canada | |
| Mexico | |
| South America | Brazil |
| Argentina | |
| Peru | |
| Chile | |
| Rest of South America | |
| Europe | Germany |
| United Kingdom | |
| France | |
| Italy | |
| Spain | |
| Russia | |
| Nordics (Denmark, Finland, Iceland, Norway, and Sweden) | |
| Rest of Europe | |
| Asia-Pacific | China |
| India | |
| Japan | |
| South Korea | |
| Australia | |
| Southeast Asia (ASEAN) | |
| Rest of Asia-Pacific | |
| Middle East and Africa | Saudi Arabia |
| United Arab Emirates | |
| Qatar | |
| South Africa | |
| Nigeria | |
| Egypt | |
| Rest of Middle East and Africa |
| By Service | Transportation | Road |
| Rail | ||
| Air | ||
| Sea and Inland Waterways | ||
| Warehousing and Storage | ||
| Value-added Services | ||
| By End-User | Oil and Gas | |
| Power Generation and Utilities | ||
| Renewable Energy | ||
| Mining and Metals | ||
| EPC Contractors and Energy Equipment Manufacturers | ||
| Government and Public Infrastructure | ||
| Others | ||
| By Geography | North America | United States |
| Canada | ||
| Mexico | ||
| South America | Brazil | |
| Argentina | ||
| Peru | ||
| Chile | ||
| Rest of South America | ||
| Europe | Germany | |
| United Kingdom | ||
| France | ||
| Italy | ||
| Spain | ||
| Russia | ||
| Nordics (Denmark, Finland, Iceland, Norway, and Sweden) | ||
| Rest of Europe | ||
| Asia-Pacific | China | |
| India | ||
| Japan | ||
| South Korea | ||
| Australia | ||
| Southeast Asia (ASEAN) | ||
| Rest of Asia-Pacific | ||
| Middle East and Africa | Saudi Arabia | |
| United Arab Emirates | ||
| Qatar | ||
| South Africa | ||
| Nigeria | ||
| Egypt | ||
| Rest of Middle East and Africa | ||


Key Questions Answered in the Report
What was the energy logistics market size in 2026?
The energy logistics market stood at USD 210.21 billion in 2026 and is projected to reach USD 306.73 billion by 2031 at a CAGR of 7.85%.
Which service led energy logistics revenue?
Transportation led revenue with a 67.19% share in 2025, while value-added services had the highest projected CAGR at 10.37% through 2031.
Why did battery storage need specialized logistics?
Battery energy storage systems required hazardous-goods certification, thermal controls, specialized handling, and delivery aligned with grid commissioning.
Which region led global energy logistics activity?
Asia-Pacific led with a 42.54% revenue share in 2025 and had the highest forecast CAGR of 9.61% through 2031.
Which end-user segment grew fastest through 2031?
Renewable energy had the highest forecast CAGR at 10.65%, supported by battery systems, turbine components, and grid-linked project delivery.
How concentrated was energy logistics competition?
The sector was moderately consolidated for large mandates but fragmented across specialist niches.
Page last updated on:


 Your data is secure and never sold or shared.


