US Air Freight Transport Market Size and Share
Market Overview
| Study Period | 2020 - 2031 |
|---|---|
| Forecast Data Period | 2026 - 2031 |
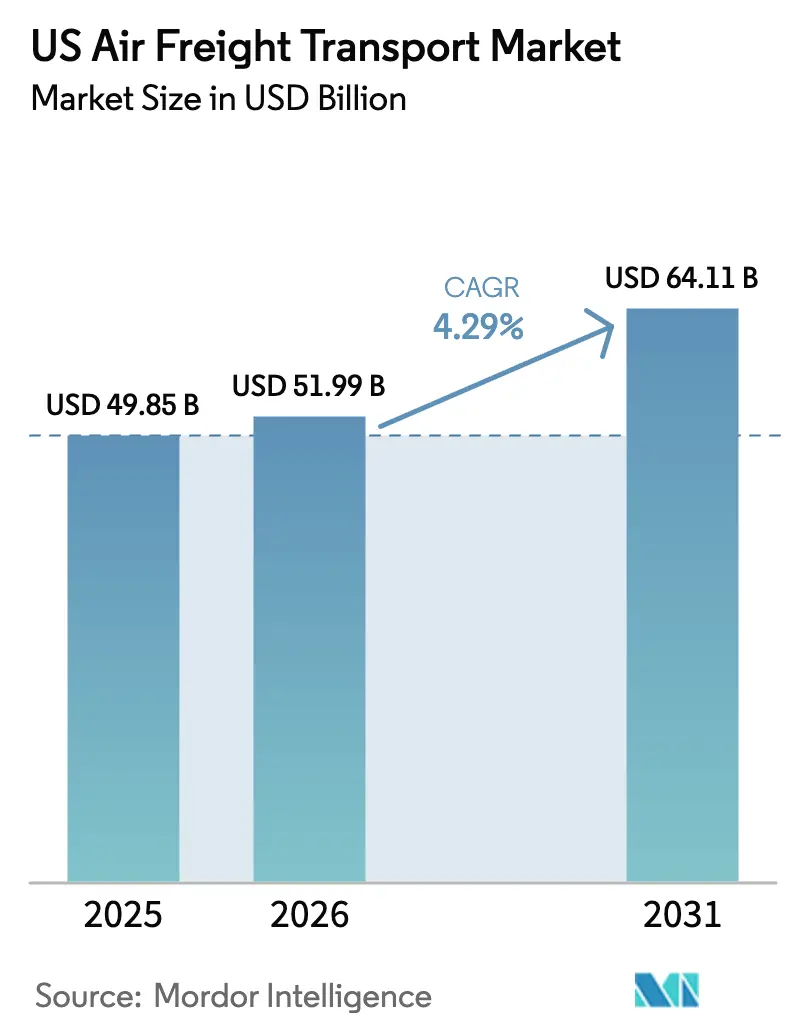
| Base Year Market Size (2025) | USD 49.85 Billion |
| Market Size (2026) | USD 51.99 Billion |
| Market Size (2031) | USD 64.11 Billion |
| Growth Rate (2026 - 2031) | 4.29% CAGR |
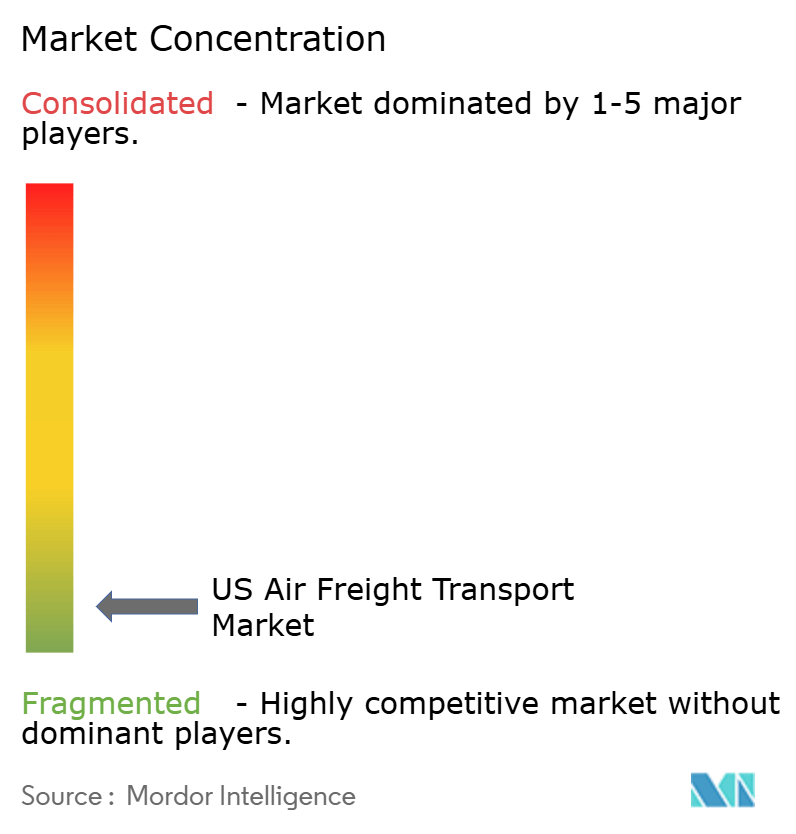
| Market Concentration | Low |
Major Players *Disclaimer: Major Players sorted in no particular order Image © Mordor Intelligence. Reuse requires attribution under CC BY 4.0. | |
US Air Freight Transport Market Analysis by Mordor Intelligence
US Air Freight Transport Market size in 2026 is estimated at USD 51.99 billion, growing from 2025 value of USD 49.85 billion with 2031 projections showing USD 64.11 billion, growing at 4.29% CAGR over 2026-2031.
Double-digit growth in freight‐ton kilometers for 15 straight months through early 2025 underlines the depth of post-pandemic demand even as macro pressures linger. Cross-border e-commerce, structural nearshoring into Mexico, and surging biologics flows are keeping lift factors tight and yields above historical norms. At the same time, tighter customs rules, a resurgence of belly capacity, and wage inflation at hub airports have tempered pricing power and reshaped network strategies across the US air freight transport market. Carriers are investing in dedicated freighters, smart warehouses, and sustainable aviation fuel (SAF) to defend margins while improving service reliability. Forwarders and integrators see upside in value-added brokerage and cold-chain services that mitigate the operational friction created by new tariff regimes and stricter drug‐temperature rules.
Key Report Takeaways
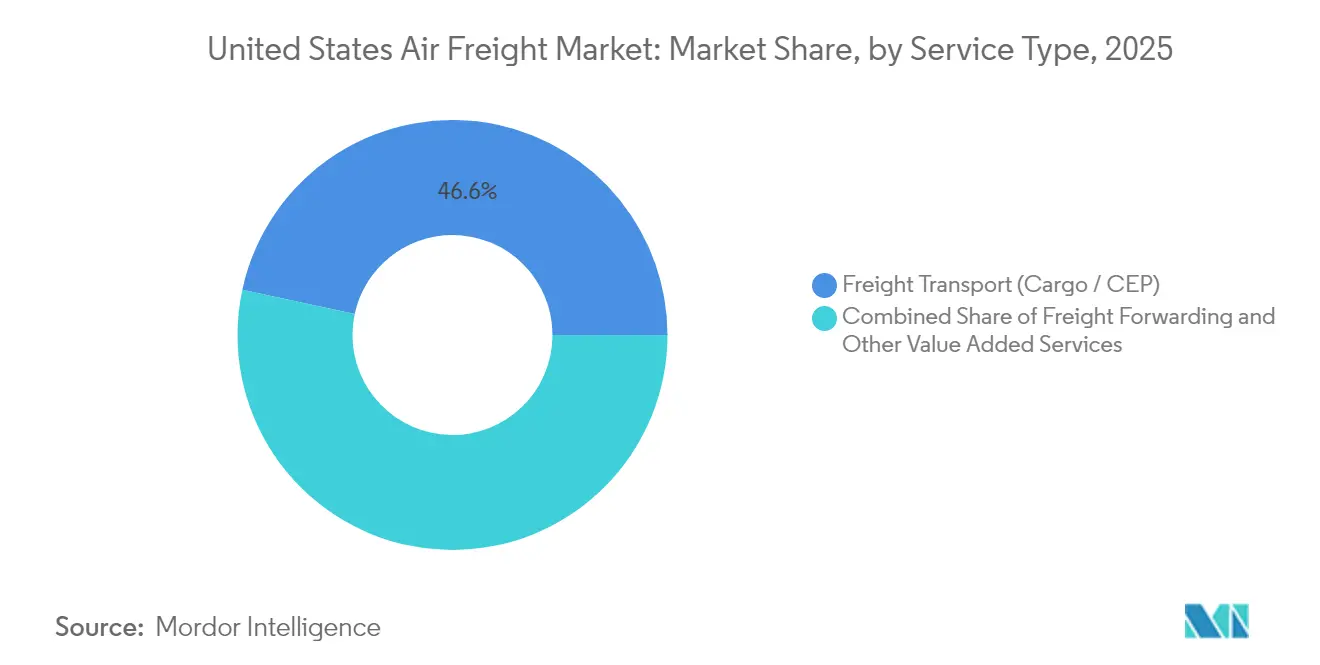
- By service type, Freight Transport (Cargo/CEP) held 46.62% of the US air freight transport market share in 2025, while Other Value-Added Services are poised to post a 5.05% CAGR to 2031.
- By destination, domestic lift accounted for 61.35% of the US air freight transport market size in 2025; the international segment is projected to grow at 4.5% CAGR through 2031.
- By carrier type, belly lift represented 50.40% of the US air freight transport market in 2025, but dedicated freighters are forecast to expand at a 5.05% CAGR to 2031.
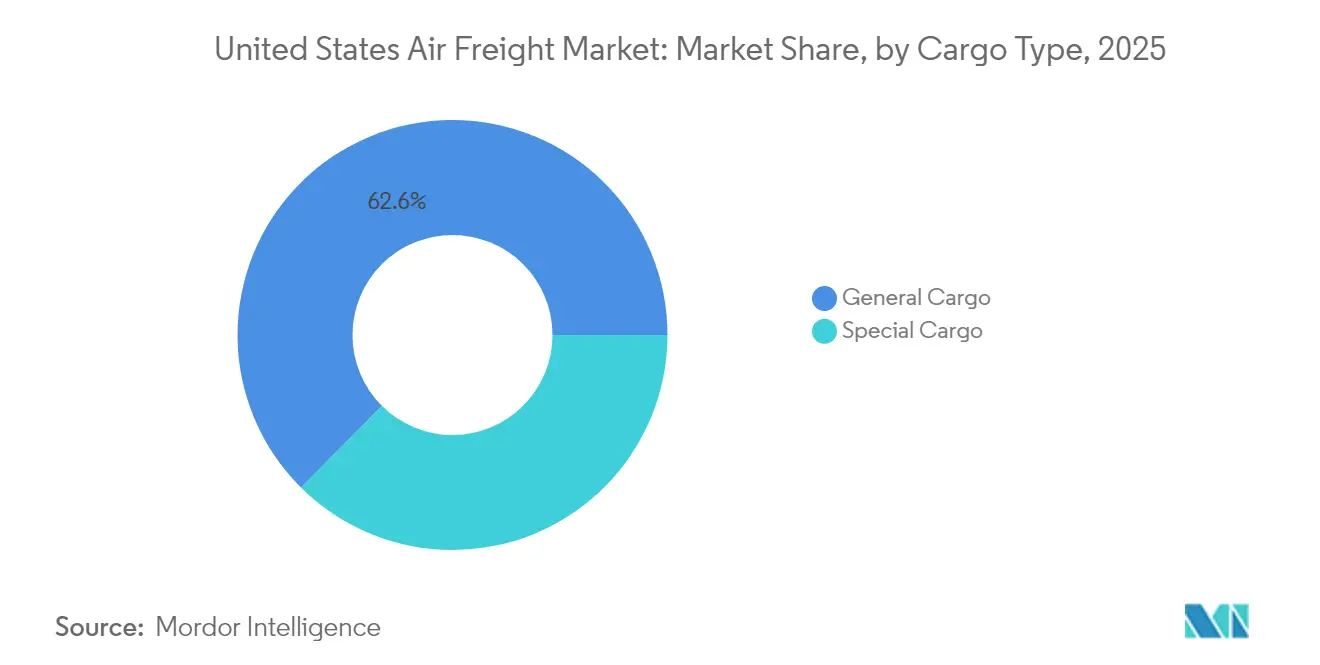
- By cargo type, general cargo held 62.55% of the US air freight transport market size in 2025, whereas special cargo is set to climb at a 5.85% CAGR to 2031.
- By end-use industry, e-commerce & retail led with 35.40% of the US air freight transport market share in 2025; healthcare & pharmaceuticals will advance at a 6.55% CAGR to 2031.
Note: Market size and forecast figures in this report are generated using Mordor Intelligence’s proprietary estimation framework, updated with the latest available data and insights as of 2026.
US Air Freight Transport Market Trends and Insights
Drivers Impact Analysis*
| Driver | (~) % Impact on CAGR Forecast | Geographic Relevance | Impact Timeline |
|---|---|---|---|
| Cross-border e-commerce two-day delivery boom led by U.S.-Asia parcels | +1.20% | Global – focus on US-Asia lanes | Short term (≤ 2 years) |
| Semiconductor & electronics reshoring across U.S.-Mexico corridor | +0.80% | US-Mexico corridor | Medium term (2-4 years) |
| Open-Skies bilateral expansion unlocking new all-cargo routings | +0.60% | Global (130+ bilateral partners) | Long term (≥ 4 years) |
| Temperature-controlled biologics and cell-gene therapies growth | +1.00% | North America & Europe | Medium term (2-4 years) |
| Near-shoring of automotive/aerospace parts requiring JIT airlift | +0.70% | North America, chiefly US-Mexico | Medium term (2-4 years) |
| Airport cargo-city investments (MIA, DFW, RFD) expanding throughput | +0.90% | Major US hubs (MIA, DFW, RFD, ORD) | Long term (≥ 4 years) |
| Source: Mordor Intelligence | |||
Cross-border e-commerce two-day delivery boom led by U.S.-Asia parcels
Consumer expectations have converged on two-day fulfillment, with 90% of US shoppers naming that window as baseline and 30% already demanding same-day service on overseas orders. E-commerce now drives more than half the transpacific tonnage, making it the fulcrum of the US air freight transport market. The segment’s USD 1.06 trillion revenue potential in 2024, coupled with a 7.4% 2025-2028 CAGR, is compelling carriers to up-gauge cross-dock capacity, integrate customs pre-clearance, and co-locate last-mile sorting inside airport perimeters. Fulfillment speed is becoming a differentiator, nudging airlines to favor freighter schedules over belly space to avoid passenger-driven slot curfews and baggage conflicts.
Semiconductor & electronics reshoring across U.S.-Mexico corridor
Nearshoring investment commitments topping USD 31 billion in Mexico in 2023 have catalyzed a high-value corridor for wafer fabs and printed circuit assemblies. Forty percent of a finished Mexican export’s content originates in the US, a stark contrast with the 4% value add from China. This tight co-production loop depends on overnight air bridges linking maquiladora clusters with US design centers, reinforcing the long-term relevance of the US air freight transport market for high-tech just-in-time flows.
Temperature-controlled biologics & cell-gene therapies growth
Biopharma logistics revenues at UPS are set to double to USD 20 billion by 2026 as cell-and-gene therapies scale out of clinical trials. These products mandate ambient, 2-8 °C, or cryogenic ranges with GDP-compliant data logging, pushing forwarders to expand GDP-certified coolers and active‐container fleets. The US air freight transport market benefits from premium yields on medical shipments that regularly command 1.5-2× general cargo rates. Strategic acquisitions such as DHL’s purchase of CRYOPDP in 2025 underscore the arms race for cold-chain capabilities.
Airport cargo-city investments (MIA, DFW, RFD) expanding throughput
Cargo-centric real-estate projects are proliferating from Miami’s VICC build-out to Chicago O’Hare’s 240,000 ft² warehouse, each promising throughput jumps of 15-100%. Capital programs also feature automated sortation, dedicated taxi-lanes, and on-site CFS zones that compress dwell time. These upgrades expand the physical ceiling of the US air freight transport market while attracting new operators who previously avoided congested hubs.
Restraints Impact Analysis*
| Restraint | (~) % Impact on CAGR Forecast | Geographic Relevance | Impact Timeline |
|---|---|---|---|
| Belly-capacity resurgence squeezing yields post-pandemic | -0.90% | Global trunk routes | Short term (≤ 2 years) |
| Cargo-hub labor shortages and wage inflation | -0.60% | US domestic hubs | Medium term (2-4 years) |
| Tariff and de-minimis crackdown causing customs delays for e-commerce | -1.00% | US-Asia corridors (esp. China) | Short term (≤ 2 years) |
| SAF blending mandates elevating fuel cost base | -0.30% | Global (initially Europe & North America) | Long term (≥ 4 years) |
| Source: Mordor Intelligence | |||
Belly-capacity resurgence squeezing yields post-pandemic
Passenger recovery has re-introduced dormant wide-body underbellies, lifting global capacity by 2% in late 2024 against 11% freight demand growth. As airlines re-activate Airbus A350 and Boeing 787 fleets, shippers regain rate leverage, eroding freighter premiums. The International Air Transport Association projects a deceleration to 5.8% global volume growth in 2025, with cargo revenues falling to USD 111 billion[1]International Air Transport Association, “Net Zero Roadmap,” iata.org. This softens the earnings outlook for the US air freight transport market despite sustained trade growth.
Tariff and de-minimis crackdown causing customs delays for e-commerce
Revoking the sub-USD 800 duty-free threshold on Chinese parcels from May 2025 adds 30% tariffs or USD 25 per item, doubling in June. More than 1 billion de-minimis parcels entered in 2024—61% from China—and most arrived by air. Sudden rule changes drove package backups at JFK and caused e-tailers such as Shein to cancel uplift, curbing the near-term volume outlook for the US air freight transport market.
*Our forecasts treat driver/restraint impacts as directional, not additive. The impact forecasts reflect baseline growth, mix effects, and variable interactions.
Segment Analysis
By Service Type: Value-added offerings outpace core lift
Freight transport commanded 46.62% of the US air freight transport market share in 2025 on the strength of established hub-and-spoke courier networks. The segment’s scale provides baseline volumes that anchor aircraft utilization. Yet value-added services—from customs brokerage to insurance—will grow 5.05% annually, outstripping the broader US air freight transport market. Forwarders are bundling duty automation tools with compliance audits to help e-merchants confront rule changes on de-minimis entries. UPS’s plan to double healthcare revenue exemplifies the margin upside in specialized advisory and cold-chain orchestration, which often carries mark-ups 3-4 percentage points above line-haul.
As regulatory hurdles multiply, shippers prize single-invoice solutions that collapse brokerage, labeling, and last-mile into one contract. That preference positions integrators and tech-enabled 4PLs to capture a larger share of the US air freight transport market, even if pure lift revenues flatten. Over the forecast period, the US air freight transport market size tied to consulting, packaging, and IoT tracking could top USD 8.27 billion, reinforcing the service pivot away from commoditized tonnage.


By Destination: International flows accelerate on nearshoring
Domestic lift still represents 61.35% of the US air freight transport market size in 2025, due to Alaska, Hawaii, and coast-to-coast fulfillment patterns. Growth, however, tilts to cross-border lanes, which are tracking a 4.5% CAGR. Transpacific e-commerce volumes and northbound flows from Mexico dominate this acceleration. Asia-North America already accounts for a quarter of global air cargo; with online orders rising, that share may climb toward one-third by the decade’s midpoint.
Ground haulage competes fiercely on sub-1,000-mile domestic moves, but for apparel, electronics, and biologics, air freight remains the only mode that satisfies two-day service-level agreements. The interplay between US gateways and Mexican maquila cities also underscores the momentum: USD 656 billion in bilateral trade flowed in the first 11 months of 2023, a figure boosting the international slice of the US air freight transport market.
By Carrier Type: Freighters reclaim strategic relevance
Belly capacity accounted for 50.40% of the US air freight transport market in 2025 as passenger schedules rebounded. Despite that numerical edge, all-cargo operators will expand faster at 5.05% CAGR on resilience and specialized handling. Atlas Air’s fleet grew to 121 wide-body units in 2024, representing 14% of global freighter capacity .The carrier’s ACMI model caters to e-commerce giants seeking guaranteed maindeck volume, highlighting a secular shift toward controlled capacity.
Cargo-only airports such as Rockford and Greenville-Spartanburg logged freight increases even when mixed-use hubs dipped, reflecting shippers’ pivot to congestion-free nodes. As airports court freighters with lower landing fees and 24/7 slots, the US air freight transport market may see the freighter share rise above 50% on critical lanes by 2031.
By Cargo Type: Special cargo rides premium yield curve
General freight still fills 62.55% of bellies and maindecks, but pharmaceuticals, perishables, and dangerous goods are charting 5.85% annual growth. The US air freight transport market size for healthcare consignments alone could reach USD 19.74 billion by mid-decade, mirroring UPS’s revenue target. Miami International already processes 69% of US perishable imports and is doubling capacity via the VICC project. With gene therapy vials valued in the millions, airlines are prioritizing real-time temperature telemetry and GDP certification.
Dangerous-goods training demand has similarly ballooned as lithium-battery volumes soar, forcing carriers to field fire-resistant containers. The premium on special cargo, often 50-100% above general rates, serves as an earnings hedge when belly capacity softens the broader US air freight transport market.
By End-Use Industry: Healthcare outpaces e-commerce juggernaut
E-commerce & retail commands 35.40% of the US air freight transport market in 2025, a share cemented by next-day delivery expectations. Healthcare & pharma, although smaller, is advancing at a 6.55% CAGR due to biologics scale-up, cell therapy trials, and vaccine pipeline activity. DHL’s CRYOPDP acquisition and UPS’s Frigo-Trans buy signal intensifying competition for GDP-qualified volume. Auto and aerospace nearshoring contribute further lift as OEMs hedge geopolitical risk with proximate suppliers; Mexico’s vehicle output climbed 13.54% in 2023, bolstering just-in-time airfreight lanes.
High-tech firms leverage CHIPS Act subsidies to onshore wafer finishing, requiring emergency uplift of reticles and spare parts. Agriculture and perishables remain steady, leveraging Miami and Houston gateways into Latin America, round-tripping flowers and seafood that exploit northbound rates to cover backhaul.
Geography Analysis
The West region held 25.70% of the US air freight transport market share in 2025, buoyed by Los Angeles and San Francisco’s dominant positions on the transpacific bridge. Large‐scale e-commerce consolidation centers near LAX drive late-cutoff exports, reinforcing the region’s stature. The Southwest is the fastest riser at 4.08% CAGR through 2031, propelled by maquila manufacturing and sprawling Dallas–Fort Worth capacity additions. Texas airports now field incremental freighter sorties that bypass coastal congestion, magnifying the regional slice of the US air freight transport market.
Southeast hubs leverage Miami’s 39 daily Latin American frequencies; the airport’s USD 6.8 billion modernization blueprint aims to double freight by 2027 while maintaining its 69% share of US perishable imports. The Midwest benefits from Chicago O’Hare’s new warehouse and Cincinnati/Northern Kentucky’s USD 2 billion cargo campus, consolidating inland rail and truck connections for cross-dock services. Conversely, the Northeast grapples with capacity pinch points at JFK and EWR, exacerbated by de-minimis inspection surges that stranded parcels in 2025. Regional diversification strategies are therefore pivotal to sustaining nationwide resilience in the US air freight transport market.
Competitive Landscape
The United States air freight transport market skews moderately concentrated: UPS and FedEx together control 74.3% of segment revenues, leaving a mid-tier of airlines, ACMI operators, and forwarders to divide the remainder. UPS posted a 5.62% revenue uptick in Q3 2024 and a 36.56% net-income jump, out-delivering peers who averaged negative earnings growth. FedEx sharpened its European network while selling off less-profitable domestic routes, realigning capacity toward healthcare and aerospace lanes.
Atlas Air, Air Transport Services Group, and Sun Country Airlines carve out share in the dedicated-lift niche, leasing freighters to Amazon and Alibaba. Digital enablers such as CargoAi’s interline platform streamline spot bookings, reducing the administrative friction that often shadows the US air freight transport industry. Policy also shapes competition: the DOT’s FLOW data pipeline gives integrators real-time container visibility, a feature small forwarders are racing to replicate.
M&A remains active: Alaska Airlines merged with Hawaiian Airlines in 2025, unlocking a cargo expansion that leverages both wide-body fleets across Pacific lanes. With healthcare logistics offering superior margins, further consolidation is probable as carriers vie for GDP-certified assets within the US air freight transport market.
US Air Freight Transport Industry Leaders
UPS (United Parcel Service Inc.)
FedEx Corp.
DHL (Deutsche Post AG)
Atlas Air Worldwide Holdings
Kuehne + Nagel
- *Disclaimer: Major Players sorted in no particular order

Recent Industry Developments
- March 2025: DHL Group acquired CRYOPDP to expand specialized pharma logistics.
- February 2025: Milwaukee Mitchell International Airport broke ground on a 337,000 ft² cargo facility projected to raise annual landing-fee revenue by USD 1.3 million.
- January 2025: UPS completed Frigo-Trans and BPL acquisitions, boosting temperature-controlled warehousing in Europe.
- January 2025: Forward Air signaled potential sale or merger to unlock shareholder value after Omni Logistics takeover.


Research Methodology Framework and Report Scope
Market Definitions and Key Coverage
Our study defines the United States air freight transport market as all revenue earned from moving commercial cargo by scheduled or chartered aircraft, whether the lift is provided in dedicated freighters or in the belly hold of passenger jets. The valuation counts freight charges, surcharges, and fuel levies collected by carriers and integrators for both domestic and international routings originating, terminating, or transiting the United States.
Private general aviation lift, experimental drone parcels, and passenger ticket income are outside this scope.
Segmentation Overview
- By Service Type
- Freight Transport (Cargo/CEP)
- Freight Forwarding
- Other Value-Added Services (Customs brokerage, insurance, etc.)
- By Destination
- Domestic
- International
- By Carrier Type
- Belly Cargo
- Freighter
- By Cargo Type
- General Cargo
- Special Cargo
- By End-Use Industry
- E-commerce & Retail
- Manufacturing & Automotive
- Healthcare & Pharmaceuticals
- Perishables & Fresh Produce
- High-Tech & Electronics
- By Region (United States)
- Northeast
- Midwest
- Southeast
- Southwest
- West
Detailed Research Methodology and Data Validation
Primary Research
Interviews with airline cargo managers, ecommerce shippers, GSSA executives, and ground handling vendors across the Northeast, Midwest, and Pacific gateways let us sense check belly capacity rebounds, rate behavior, and upcoming slot constraints. Short surveys with pharmaceutical and perishables exporters added lane level growth expectations that filled blind spots in secondary data.
Desk Research
Mordor analysts first mapped the demand base using tier 1 public sources such as the US Bureau of Transportation Statistics, Federal Aviation Administration airport activity tables, Bureau of Economic Analysis trade series, and UN Comtrade airway bill commodity splits. Industry insights came from IATA quarterly cargo market updates, Airforwarders Association briefs, and congressional SAF blending mandates under review. Company 10-Ks, Form 41 carrier financials, and tariff filings supplied baseline yields and surcharge patterns, while D&B Hoovers helped us gauge operator revenue mix. These sources, together with periodic coverage in the Wall Street Journal and Logistics Management, framed the historic data stack. The sources listed illustrate our desk work and are not exhaustive, as many further publications informed validation and clarification.
Market Sizing and Forecasting
A top down build drew on freight tonne kilometer output, average yields, and carrier mix to size 2024, followed by sampled ASP × volume roll ups at four major hubs to test the total. Key variables like ecommerce parcel share, freighter fleet additions, jet A price index, semiconductor export value, and cold chain pallet demand drive the model equations. Multivariate regression projects each driver through 2030, while scenario analysis adjusts for SAF cost shocks or de minimis reform. Where sampled airport figures under indexed against national totals, a weighted uplift was applied before results were reconciled with bottom up checks once.
Data Validation and Update Cycle
Every draft run passes variance scans against FAA monthly tonnage, IATA yield trackers, and BEA trade flash estimates. Outliers trigger re contact of at least one previously interviewed expert. The model is refreshed annually; material events such as tariff shifts prompt an interim update, and a final pre publication sweep ensures clients receive the latest view.
Why Mordor's US Air Freight Transport Baseline Commands Reliability
Published estimates often diverge because different firms bundle forwarding fees, rely on aggressive ASP curves, or freeze models for years.
Key gap drivers include whether belly revenue is imputed or observed, the treatment of ancillary warehousing income, and the cadence at which macro drivers like ecommerce penetration are refreshed. Our team revisits each driver quarterly, chooses a balanced ASP path, and excludes forwarding margin layers, yielding a leaner but decision ready figure.
Benchmark comparison
| Market Size | Anonymized source | Primary gap driver |
|---|---|---|
| USD 49.85 B (2025) | Mordor Intelligence | - |
| USD 150 B (2025) | Regional Consultancy A | Includes forwarding, warehousing, and charter broking revenues, inflating base |
| USD 180 B (2024) | Trade Journal B | Uses headline airport cargo value without carrier yield separation and applies global CAGR to US totals |
In sum, Mordor Intelligence offers a transparent baseline anchored to observable freight activity, checked with on ground voices, and updated on a disciplined schedule, providing decision makers a dependable starting point amid widely scattered numbers.


Key Questions Answered in the Report
What is the current value of the US air freight transport market?
The sector stands at USD 51.99 billion in 2026 and is projected to reach USD 64.11 billion by 2031.
Which segment is growing fastest within the US air freight transport market?
Healthcare & pharmaceuticals lead with a 6.55% CAGR, reflecting rising biologics and cell-gene therapy shipments.
How will the de-minimis rule change affect air freight volumes?
Ending duty-free entry for sub-USD 800 parcels from China adds up to 30% duties, likely curbing e-commerce volumes in the short term and increasing brokerage complexity at US gateways.
Why are dedicated freighters gaining ground despite the belly-capacity comeback?
Shippers want guaranteed maindeck space, temperature control, and fewer passenger-related schedule constraints, driving a 5.05% freighter CAGR versus slower growth for belly capacity.
Which US region is expected to grow quickest for air freight?
The Southwest, especially Texas gateways tied to US-Mexico supply chains, is forecast to post a 4.08% CAGR through 2031.
How big is the opportunity for value-added services?
The US air freight transport market size generated by customs brokerage, insurance, and supply-chain consulting could exceed USD 8.27 billion by 2031 as regulatory complexity rises.
Page last updated on:


