
Market Overview
| Study Period | 2020 - 2031 |
|---|---|
| Forecast Data Period | 2026 - 2031 |
| Base Year Market Size (2025) | USD 478.98 Billion |
| Market Size (2026) | USD 499.53 Billion |
| Market Size (2031) | USD 604.47 Billion |
| Growth Rate (2026 - 2031) | 3.89 % |
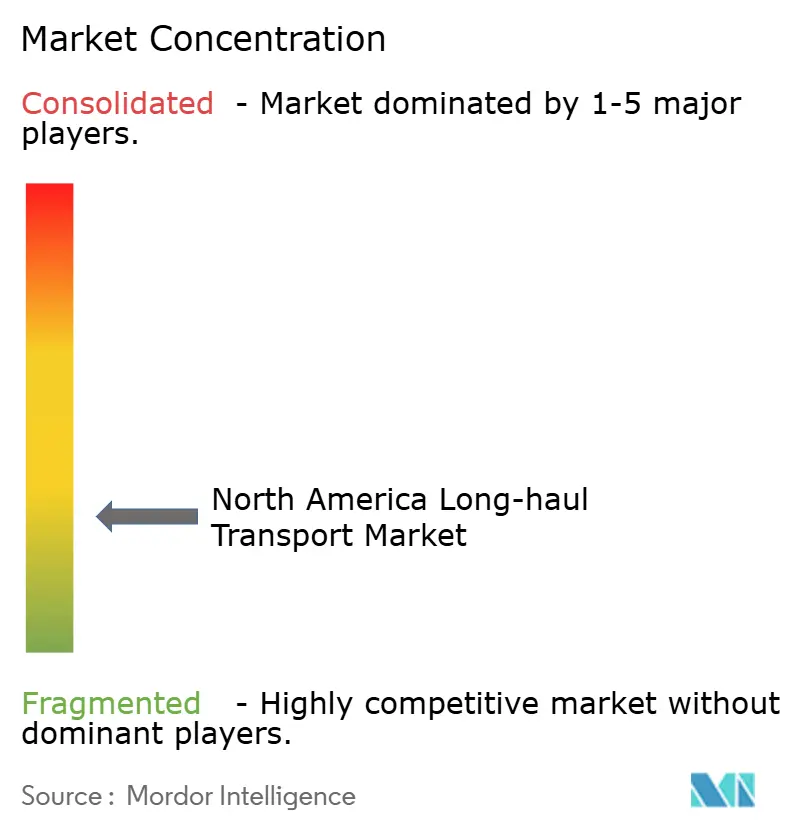
| Market Concentration | Low |
Major Players *Disclaimer: Major Players sorted in no particular order Image © Mordor Intelligence. Reuse requires attribution under CC BY 4.0. | |
North America Long-haul Transport Market Analysis by Mordor Intelligence
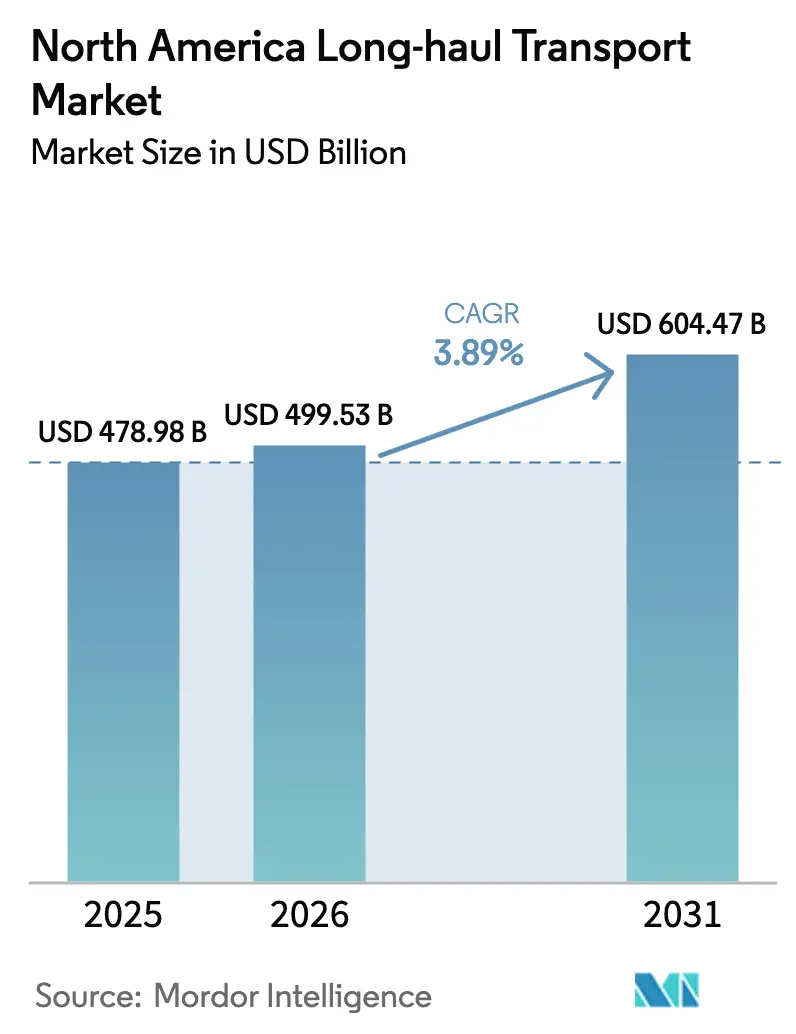
The North America Long-haul Transport Market size is expected to increase from USD 478.98 billion in 2025 to USD 499.53 billion in 2026 and reach USD 604.47 billion by 2031, growing at a CAGR of 3.89% over 2026-2031.
Intensifying cross-border freight flows under the United States-Mexico-Canada Agreement (USMCA), e-commerce fulfillment models that reward fast replenishment, and capacity constraints linked to electronic-logging-device enforcement continue to underpin steady growth in the North America long-haul transport market. Spot rates moderated in late 2025, yet disciplined fleet additions and persistent driver shortages kept contract pricing firmer than historical down-cycles. Omnichannel retailers pulled inventory closer to consumption zones, which broadened less-than-truckload (LTL) demand, while manufacturing reshoring from Asia to Mexico and the United States lifted north-south lane volumes. Carriers that deploy aerodynamic tractors and fuel-saving trailers gained a cost edge as Environmental Protection Agency (EPA) Phase 3 standards drew closer, and digital load-matching platforms compressed booking lead times from hours to minutes.
Key Report Takeaways
- By end user, manufacturing captured a 32.30% North America long-haul transport market share in 2025; Wholesale and Retail Trade is poised to expand at a 4.41% CAGR (2026-2031) and will be the fastest growing end-user segment through 2031.
- By destination type, domestic shipments accounted for 62.51% of the North America long-haul transport market size in 2025, while international movements are projected to register a 4.47% CAGR (2026-2031) as nearshoring accelerates.
- By truckload specification type, Full-Truck-Load (FTL) operations dominated with 79.88% revenue share in 2025; the LTL segment is forecast to grow at 4.30% CAGR (2026-2031), the quickest within truckload specifications.
- By containerization type, non-containerized freight represented 85.75% of the 2025 value, yet containerized intermodal lanes are expected to advance at a 3.97% CAGR (2026-2031).
- By goods configuration type, solid goods held 72.43% of revenue share in 2025; fluid goods will pace ahead at a 4.21% CAGR (2026-2031) on refinery expansions and renewable-fuel mandates.
- By temperature control type, non-temperature-controlled comprised 94.70% of revenue in 2025, whereas temperature-controlled shipments will increase at a 4.25% CAGR (2026-2031), fueled by biologics distribution.
- By country, the United States maintained an 85.22% share of the North America long-haul transport market in 2025; Mexico is set to rise the fastest, posting a 5.41% CAGR (2026-2031).
Note: Market size and forecast figures in this report are generated using Mordor Intelligence’s proprietary estimation framework, updated with the latest available data and insights as of January 2026.
Market Trends and Insights
Drivers Impact Analysis of North America Long-haul Transport Market*
| Driver | (~) % Impact on CAGR Forecast | Geographic Relevance | Impact Timeline |
|---|---|---|---|
| E-commerce parcel volume surge | +0.6% | United States, with spillover to Canada and urban Mexico | Short term (≤ 2 years) |
| Manufacturing reshoring and near-shoring | +0.5% | United States and Mexico, concentrated in automotive and electronics corridors | Medium term (2-4 years) |
| Cross-border trade growth under USMCA | +0.4% | United States-Mexico border states, Ontario-Michigan gateway | Medium term (2-4 years) |
| Cold-chain pharma and biologics expansion | +0.3% | United States and Canada, clustered around biotech hubs | Long term (≥ 4 years) |
| Engine and aerodynamics fuel-efficiency gains | +0.2% | North America-wide, accelerated by EPA Phase 3 standards | Long term (≥ 4 years) |
| AI-enabled back-haul and load-matching platforms | +0.3% | United States and Canada, early adoption in high-density freight lanes | Short term (≤ 2 years) |
| Source: Mordor Intelligence | |||
E-commerce Parcel Volume Surge
United States online retail sales touched USD 1.14 trillion in 2024, driving parcel counts past 21 billion units and forcing carriers to restructure linehaul legs into relay runs that keep drivers closer to home. Integrated express players invested heavily in automated hubs capable of processing 1.2 million pieces per hour, raising service benchmarks for the broader North America long-haul transport market. Truckload fleets responded by embedding AI route-optimization tools that trimmed empty-mile ratios four points to 14% in early 2025. The mix shift toward smaller, more frequent shipments expanded LTL terminal traffic but added handling costs of USD 0.08 to USD 0.12 per pound. E-commerce share of total freight tonnage is projected to stabilize near 20% by 2028 as omnichannel models blend store pickups with home deliveries[1]“Quarterly Retail E-commerce Sales,” U.S. Census Bureau, census.gov .
Manufacturing Reshoring and Near-Shoring
United States manufacturing construction outlays doubled to USD 228 billion in 2024, largely for semiconductor, battery, and pharmaceutical projects that shorten supply chains from 30-day ocean legs to three-day truck hauls. Mexico attracted USD 36 billion in foreign direct investment the same year, with plants in Nuevo León and Guanajuato funneling wire harnesses and battery modules northbound under USMCA content rules. Cross-border truck freight hit a record USD 47.9 billion in March 2025, underscoring resilient lane demand. Reshoring lifts shipment frequency and complexity, rewarding carriers that operate bonded yards and offer bundled drayage, warehousing, and linehaul services. Smaller brokers struggle to match this integrated suite, spurring consolidation in the North America long-haul transport market[2]“Foreign Direct Investment Statistics,” Banco de México, banxico.org.mx.
Cross-Border Trade Growth under USMCA
USMCA governed USD 1.6 trillion in trilateral trade by 2024 and lifted automotive content rules to 75%, encouraging component sourcing within the bloc. Daily truck crossings at Laredo averaged 14,200 in 2024, a 9% year-over-year jump, while Canada–United States lanes carried USD 36.8 billion in March 2025. Labor-value provisions tightened wage differentials, anchoring freight inside the North America long-haul transport market lanes for another decade. Carriers with authority in all three nations leverage seamless documentation processes to capture higher-margin, door-to-door business. Investments in bilingual customer support and customs-brokerage partnerships are emerging differentiators.
Cold-Chain Pharma and Biologics Expansion
The Food and Drug Administration approved 14 biologics in 2024 that mandate an unbroken 2°C to 8°C chain, elevating the premium segment of the North America long-haul transport market. Logistics providers spent USD 1.8 billion retrofitting reefer trailers with IoT sensors broadcasting data every 15 minutes, safeguarding compliance and curbing recall risk. Each biologic launch requires 50 to 100 reefer loads per month during ramp-up, a volume that tightens specialized capacity and commands spot rates 20% higher than dry van equivalents. Cold-chain demand extends to Mexican produce exports, which advanced 8% in 2024 and depend on equipment meeting both USDA and FDA standards. Carriers holding ISO 9001 certifications and validated lanes lock in premium contracts but shoulder higher maintenance costs because reefer units consume 0.5 to 0.8 gallons of diesel per hour when idling.
Restraints Impact Analysis of North America Long-haul Transport Market*
| Restraint | (~) % Impact on CAGR Forecast | Geographic Relevance | Impact Timeline |
|---|---|---|---|
| Acute driver shortage and wage inflation | -0.4% | United States and Canada, most severe in long-haul over-the-road segments | Short term (≤ 2 years) |
| Volatile diesel prices | -0.3% | North America-wide, with greater impact on independent owner-operators | Short term (≤ 2 years) |
| Escalating bridge and highway tolls | -0.2% | Concentrated in Northeast U.S. and Ontario toll corridors | Medium term (2-4 years) |
| ESG-driven early fleet-electrification CAPEX | -0.2% | United States and Canada, led by large fleets with sustainability mandates | Long term (≥ 4 years) |
| Source: Mordor Intelligence | |||
Acute Driver Shortage and Wage Inflation
Retirements accelerated a shortfall that reached 60,000 to 80,000 drivers in 2025, keeping turnover above 90% at large truckload fleets and pushing median pay to USD 62,000. Federal clearinghouse disqualifications removed capacity equal to 2.5% of the commercial-license pool by year-end 2024. Recruiting costs soared to as high as USD 12,000 per new hire, which squeezed smaller carriers’ margins. Autonomous truck trials logged 2.5 million commercial miles in 2024 yet await rulemaking on liability frameworks before scaling beyond pilots. As the labor gap persists, contract rates remain sticky, underpinning the North America long-haul transport market even in periods of soft freight demand[3]“Driver Shortage Report 2025,” American Trucking Associations, trucking.org .
Volatile Diesel Prices
Diesel averaged USD 3.52 per gallon in 2024, swinging USD 0.65 between monthly peaks and troughs and adding USD 6,000 to USD 8,000 per tractor annually. Fuel constitutes roughly one-quarter of operating costs, so rapid price climbs erode margins when surcharges lag. Large carriers hedged exposure through bulk contracts that shaved up to 8% off retail pump levels, while 8,200 independent owner-operators exited in 2024 amid price spikes. The emergence of renewable diesel and biodiesel blends, which captured 4.2% of consumption in 2024, layered additional volatility owing to feedstock swings. Persistent variability keeps fleet modernization toward aerodynamic equipment a strategic priority[4]“Diesel Fuel Update,” U.S. Energy Information Administration, eia.gov.
*Our forecasts treat driver/restraint impacts as directional, not additive. The impact forecasts reflect baseline growth, mix effects, and variable interactions.
North America Long-haul Transport Market Segment Analysis
By End User Industry:
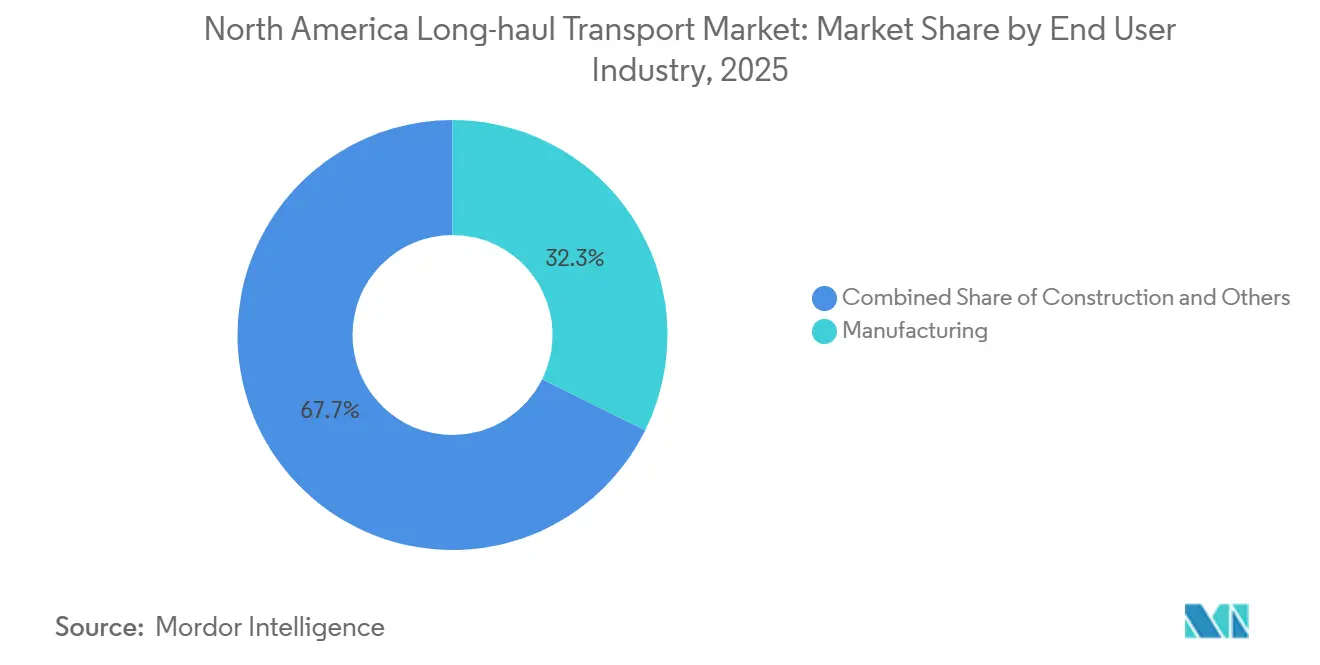
Manufacturing Volume Anchors, Wholesale Trade AcceleratesManufacturing generated 32.30% of the North America long-haul transport market share in 2025, reflecting consistent automotive and machinery flows into integrated assembly corridors. Wholesale and Retail Trade leads growth at a 4.41% CAGR (2026-2031) as retailers redistribute inventory across regional fulfillment centers for faster final-mile execution. Agriculture continues to rely on bulk grain moves from Midwest elevators to Gulf export terminals, while construction traffic rose 6.8% on federally funded infrastructure work. Oil and Gas, Mining, and Quarrying softened 2.1% due to flat energy output and subdued natural-gas pricing, but fluid-grade tanker carriers partially offset weakness through chemical shipments tied to semiconductor fabrication. Other diversified verticals, including health care and consumer electronics, aligned with broader GDP expansions.
Reshoring has steadily increased intermediate-goods flows, prompting manufacturers to contract more frequent LTL runs that reduce in-process inventory. Safety audits under the Compliance, Safety, Accountability (CSA) program sharpen carrier selection criteria, elevating well-scored fleets above price-only competitors. E-commerce retail imports continue to reinforce the wholesale segment’s momentum, especially on west-to-east, port-to-inland corridors. As fiscal support cools post-2026, construction freight is likely to normalize, yet the diversified base built by the wholesale channel keeps the North America long-haul transport market insulated from sector-specific shocks.



By Destination:
Domestic Dominates, International Gains on NearshoringDomestic lanes comprised 62.51% of 2025 revenue, driven by dense manufacturing clusters and large consumption centers located within a 500-mile radius. International traffic is forecast to expand at a 4.47% CAGR (2026-2031) as USMCA compliance embeds more north-south component shipments. March 2025 cross-border freight tallied USD 47.9 billion, underlining sustained Mexico–United States flows that shorten lead times and cut inventory costs. Canadian traffic of USD 36.8 billion in the same month emphasized diversified bidirectional volumes of lumber, auto parts, and energy products.
Bonded warehousing near Laredo, El Paso, and Detroit allows integrated solutions that command premiums over plain linehaul. Currency-exchange exposure introduces complexity but offers margin plays for carriers with automated invoicing in multiple denominations. Domestic freight faces higher exposure to driver turnover, while customs bottlenecks remain the prime risk on international lanes. Harmonized electronic-logging-device standards across Mexico and Canada reduce border dwell times and improve asset turns, strengthening the North America long-haul transport market outlook for cross-border specialists.
By Truckload Specification:
FTL Efficiency Meets LTL Density EconomicsFTL controlled 79.88% of revenue in 2025, catering to shippers that fill trailers with homogeneous freight requiring direct point-to-point service. LTL advances at a 4.30% CAGR (2026-2031), lifted by omnichannel inventory strategies that send smaller batches more frequently. Hub-and-spoke networks deliver load factors north of 95% and generate per-pound savings of up to 40% over FTL spot lanes. Yet FTL maintains lower cargo-damage claims and simpler pricing structures, keeping it the default for high-value or fragile shipments.
Digital load-matching applications reduced empty-mile ratios for FTL fleets to 14% by early 2025, closing part of the utilization gap with LTL. Hybrid services, such as dedicated truckload legs feeding white-glove final-mile teams, illustrate the ongoing convergence. LTL operators invest in automated dimensioning technology to avoid misclassification disputes, an area where early adopters gain an accuracy edge. Both models will coexist, yet the North America long-haul transport market rewards carriers agile enough to toggle between density-driven LTL and high-velocity FTL based on daily tender patterns.
By Containerization:
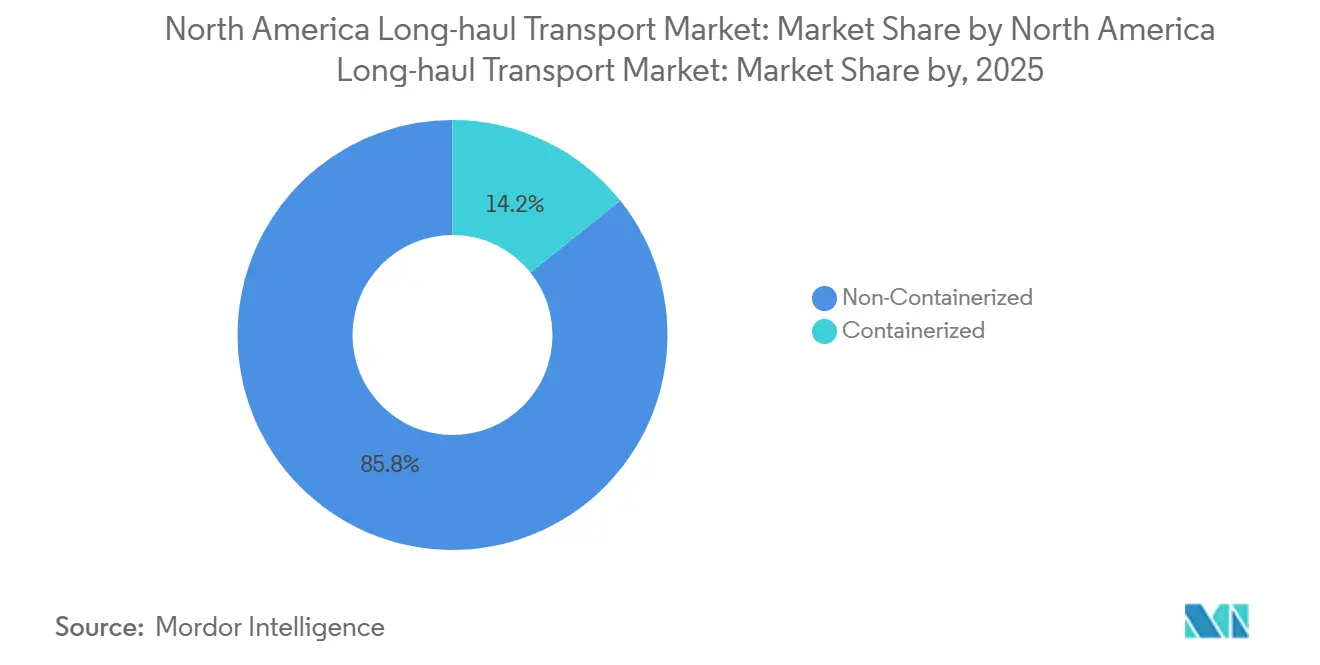
Bulk Dominates, Intermodal Climbs on Rail PartnershipsNon-containerized freight represented 85.75% of revenue in 2025, underscoring the prevalence of bulk commodities and out-of-gauge equipment. Containerized intermodal traffic is projected to grow at a CAGR (2026-2031) of 3.97% as Class I railroads expand double-stack corridors and stabilize port dwell times. J.B. Hunt Intermodal volumes rose 8% year on year in early 2025 under rail-capacity guarantees, confirming demand for truck-to-rail modal shifts on hauls above 750 miles.
Chassis shortages and terminal congestion still constrain full adoption, but new inland ports in Chicago, Memphis, and Kansas City can now handle 12 million lifts annually, more than double 2021 capacity. Adoption of 53-foot domestic boxes improves volumetric efficiency on low-density freight such as furniture, nudging more traffic into intermodal networks. Flatbed operators continue to command premiums on oversized machinery, yet high insurance costs and specialized equipment requirements cap broader segment expansion. These countervailing forces keep the North America long-haul transport market balanced between high-volume bulk lanes and emerging intermodal corridors.
By Goods Configuration:
Solid Goods Lead, Fluid Gains with Energy TransitionSolid goods claimed 72.43% of overall tonnage in 2025, anchored by automotive parts, consumer electronics, and packaged foods. Fluid goods are set to climb at a 4.21% CAGR (2026-2031) as Gulf Coast refinery expansions and renewable diesel mandates raise tanker demand. Stainless-steel trailers with vapor-recovery units meet purity standards for semiconductor chemicals, unlocking higher-margin loads for tanker fleets.
Regulatory liability tied to spills keeps insurance premiums elevated, and specialized trailers costing USD 40,000 to USD 60,000 more than dry vans limit fleet flexibility. Solid-goods carriers contend with cargo-theft risks that require geofencing and tamper-evident seals, adding USD 200 to USD 400 per shipment. Fluid-goods haulers carry less theft exposure but face environmental penalties exceeding USD 1 million for contamination incidents. The two equipment pools complement each other, allowing diversified carriers to buffer cyclical swings in either sub-market of the North America long-haul transport market.
By Temperature Control:
Ambient Prevails, Cold Chain Expands on BiologicsNon-temperature-controlled moves represented 94.70% of 2025 activity, reflecting the dominance of dry freight. Temperature-controlled freight will grow at a 4.25% CAGR (2026-2031) as biologics, specialty foods, and fresh produce require ever-tighter thermal bands. The North America long-haul transport market size for cold-chain lanes is therefore expected to expand steadily, as FDA approvals now average double-digit counts annually.
Reefer trailers priced USD 25,000 to USD 35,000 above dry vans add 15%-20% to operating costs, yet validated capacity can command rate premiums of similar magnitude. IoT sensor adoption reduces spoilage claims and demonstrates compliance, a prerequisite for high-value pharmaceuticals. Dry-van operators benefit from wider equipment redeployability, but oversupply of ambient trailers compresses yields whenever freight softens. Temperature-control diversification thus acts as a hedge for integrated carriers within the broader North America long-haul transport market.
Geography Analysis
United States Long-haul Transport Market
The United States generated 85.22% of North America long-haul transport market revenue in 2025, fueled by dense consumer markets, four million miles of paved roads, and investments of USD 110 billion earmarked for freight infrastructure upgrades. E-commerce parcel volumes soared 12% year on year in 2025, accelerating hub reconfigurations for next-day commitments. Driver disqualifications removed 135,000 commercial licenses in four years, further tightening capacity.
Mexico Long-haul Transport Market
Mexico is projected to advance at a 5.41% CAGR (2026-2031) on the back of USD 36 billion of foreign capital inflows and MXN 87 billion (USD 4.25 billion) in highway spending that shaved transit times between Nuevo León and border gateways by 12%. Manufacturing construction reached MXN 412 billion (USD 20.14 billion) in 2024, anchoring sustained outbound truck traffic northward. Electronically enforced hours-of-service rules harmonized with United States standards in 2024, cutting border dwell to 55 minutes by 2025.
Canada Long-haul Transport Market
Canada rounds out the regional picture with USD 36.8 billion in March 2025 truck freight, much of it tied to auto parts, lumber, and refined products. Congestion in the Greater Toronto and Vancouver corridors lengthens transit times by up to 30% during peaks, encouraging off-peak programs and urban consolidation centers. Harmonized hours-of-service rules adopted in 2024 streamline cross-border operations and reduce administrative overhead. In aggregate, these dynamics sustain diversified lane growth and reinforce the resilience of the North America long-haul transport market.
Regulatory Landscape
The regulatory framework for North America long-haul transport is still shaped by federal safety enforcement and freight-planning requirements, especially in the United States through the Federal Motor Carrier Safety Administration (FMCSA) and the U.S. Department of Transportation (USDOT). In February 2026, USDOT issued updated guidance on Multimodal State Freight Plans and State Freight Advisory Committees to align with IIJA requirements, including shortening the freight plan update cycle from five years to four years and tying planning more closely to freight funding and project pipelines.
Operational practices for carriers continue to be influenced by electronic logging devices (ELDs). In June 2026, FMCSA published a final rule rescinding the requirement for commercial motor vehicle operators to carry a printed ELD users manual in the vehicle, which reduces administrative burden while keeping the core ELD compliance framework in place. In July 2026, FMCSA removed 10 ELD models from the registered list for technical non-compliance and set a transition window to September 8, 2026, which is prompting near-term device replacement activity for affected fleets and reinforcing the role of enforcement in standardizing digital compliance across long-haul operations.
Value Chain Analysis
The North America long-haul transport value chain starts with shippers in manufacturing, wholesale and retail trade, agriculture, and energy contracting for linehaul capacity through asset-based carriers (truckload and LTL), intermodal providers, and brokers or digital freight platforms. Upstream inputs include tractors, trailers (dry van, reefer, flatbed, tank), fuel, maintenance and parts, insurance, and telematics or ELD systems. Enabling services include warehousing, cross-dock and LTL terminals, customs brokerage for cross-border moves, and rail partnerships for intermodal conversion on longer lanes. Operational control points are concentrated in terminal networks, border crossings, notably around Laredo and other USMCA gateways, and in the data layers that support tendering, routing, and compliance.
Recent infrastructure and network investments are also shifting how value is captured across modes and nodes. In December 2024, CPKC completed the Patrick J. Ottensmeyer International Railway Bridge at Laredo/Nuevo Laredo (USD 100 million), doubling border rail freight capacity and supporting truck-rail interchanges for north-south corridors. In June 2025, Green Corridors, LLC received a U.S. Presidential Permit to develop a USD 10 billion commercial elevated guideway for autonomous freight crossing between Laredo, Texas and Monterrey, Mexico, highlighting how public-private border capacity projects can alter drayage, linehaul, and brokerage roles. In August 2025, Americold opened an import-export hub in Kansas City in partnership with CPKC, strengthening temperature-controlled intermodal flows that connect Mexico-origin freight to inland distribution and expanding the set of value-added services around cold chain compliance and inland port connectivity.
Competitive Landscape
Roughly 35%-40% of industry revenue is held by the 10 largest carriers, indicating low concentration. Knight-Swift’s USD 808 million takeover of United States Xpress in June 2024 consolidated 18,000 tractors and 44,000 trailers, boosting its purchasing leverage on fuel and maintenance. XPO’s spin-off of RXO sharpened its LTL focus, while C.H. Robinson embedded generative AI into its Navisphere platform in January 2025, cutting booking times to five minutes.
Temperature-controlled pharmaceutical logistics represents a lucrative niche, yet compliance hurdles and high entry capital insulate incumbents. Autonomous-truck developers Aurora Innovation and Kodiak Robotics logged 2.5 million on-road miles in 2024 but still await a cohesive liability framework before commercial scaling. Meanwhile, retailers such as Walmart and Amazon expand private fleets to hedge against future spot-rate swings.
Horizontal consolidation among mid-sized fleets accelerates as insurance and fuel procurement rates increasingly reward scale. Digital brokerage margins shrank from 16% in 2023 to 13% in early 2025, but higher visibility and faster tender acceptance added throughput capacity. The North America long-haul transport market therefore balances legacy assets with agile technology entrants, while environmental regulation intensifies the capital barrier for newcomers.
North America Long-haul Transport Industry Leaders
FedEx
XPO, Inc.
United Parcel Service of America, Inc. (UPS)
Schneider National, Inc.
Knight-Swift Transportation Holdings Inc.
- *Disclaimer: Major Players sorted in no particular order
North America Long-haul Transport Market Companies Covered in this Report
- A.P. Moller - Maersk
- ArcBest
- C.H. Robinson
- Canada Cartage
- CMA CGM Group (including CEVA Logistics)
- DHL Group
- DSV A/S (De Sammensluttede Vognmand af Air and Sea)
- FedEx
- J.B. Hunt Transport, Inc.
- Knight-Swift Transportation Holdings, Inc.
- Landstar System, Inc.
- Old Dominion Freight Line
- Penske Corporation
- Ryder System, Inc.
- Schneider National, Inc.
- Transportes Marva
- Traxion
- United Parcel Service of America, Inc. (UPS)
- Werner Enterprises Inc.
- XPO, Inc.
Read Analysis of North America Long-haul Transport Companies

Market Opportunities and Future Outlook
Cross-border and inland network capacity upgrades are creating whitespace for carriers and intermediaries that can bundle linehaul with customs-enabled, time-definite service. In April 2026, Canada broke ground on the Contrecoeur Container Terminal near Montreal, a project designed to increase capacity by 60%, which can support additional container flows into Quebec and Ontario distribution lanes that depend on long-haul drayage, intermodal transfers, and LTL replenishment. In July 2026, the Government of Canada referred the Port of Vancouver Gateway Strategy to the Major Projects Office and designated Roberts Bank Terminal 2 for fast-tracked national interest handling, reinforcing the role of west-coast port throughput and inland rail-truck corridors in long-haul capacity planning.
Digital freight visibility and compliance-led standardization are also expanding opportunities in data-enabled brokerage, network optimization, and equipment modernization. USDOTs 2026 National Freight Strategic Plan emphasizes modernization of the freight network and supply chain visibility, which aligns with carrier investments in digital load-matching, routing, and utilization improvements already being used in the market. On the compliance side, FMCSA actions in 2026 that streamline ELD documentation while removing non-compliant ELD models increase the value of standardized, audit-ready telematics deployments across fleets, lifting demand for integrated solutions that link tendering, tracking, and safety compliance for large shippers operating domestic and USMCA lanes.
Recent Industry Developments in North America Long-haul Transport Market
- June 2026: FedEx Freight completed its spin-off from FedEx Corporation and began trading on the New York Stock Exchange under the ticker FDXF. The separation creates a stand-alone LTL operator with its own capital allocation and network investment priorities, sharpening competitive focus in North American long-haul and LTL linehaul operations.
- June 2025: Green Corridors, LLC received a U.S. Presidential Permit to construct, maintain, and operate a commercial elevated guideway border crossing near Laredo, Texas, positioned as a USD 10 billion project for freight movements between the United States and Mexico. The authorization signals momentum for new cross-border capacity concepts that can change how long-haul trucking, drayage, and intermodal handoffs are structured around the Laredo gateway.
- June 2024: Knight-Swift Transportation completed its acquisition of U.S. Xpress for USD 808 million. The deal expanded scale across tractors and trailers, strengthening purchasing leverage and network density across long-haul lanes, and added pressure on mid-sized fleets facing higher costs for fuel, insurance, and equipment.


North America Long-haul Transport Market Report Scope and Research Methodology
Market Definition and Coverage
We size the North America long-haul transport market as the revenue generated from moving freight over longer distances by road, including line-haul services tied to domestic and cross-border shipments across the United States, Canada, and Mexico.
Scope exclusions: We exclude passenger transportation, courier and local last-mile delivery-only movements, and non-road long-distance freight moved only by rail, air, or ocean.
Segments Covered in This Report
- End User Industry
- Agriculture, Fishing, and Forestry
- Construction
- Manufacturing
- Oil and Gas, Mining and Quarrying
- Wholesale and Retail Trade
- Others
- Destination
- Domestic
- International
- Truckload Specification
- Full-Truck-Load (FTL)
- Less than-Truck-Load (LTL)
- Containerization
- Containerized
- Non-Containerized
- Goods Configuration
- Fluid Goods
- Solid Goods
- Temperature Control
- Non-Temperature Controlled
- Temperature Controlled
- Country
- United States
- Canada
- Mexico
- Rest of North America
Data Sources, Market Sizing, and Validation
Desk Research
Desk research starts by mapping the real-world freight base for long-distance moves, then aligning it with how carriers and shippers report activity. We referenced public datasets such as U.S. Bureau of Transportation Statistics releases, U.S. Census Bureau economic series, Statistics Canada tables, and Mexico INEGI transport indicators, which help anchor fleet activity, trade flows, and macro demand.
To keep assumptions grounded, we also used sources such as Federal Highway Administration freight statistics, trade publications for cross-border flow context, carrier annual reports and investor presentations, and reputable press coverage on rate cycles and capacity. In a few cases, subscription databases were used only for company financials, shipment-level import and export checks, and patent lookups related to trucking technology. These desk sources are illustrative rather than exhaustive, and we also relied on other public documents and data points to collect, validate, and clarify inputs.
Primary Interviews and Surveys
Primary work was used to test the desk assumptions against how freight is actually priced, routed, and contracted in the region, so the model is not reliant on a single data series. We spoke with carriers, 3PL staff, and shipper-side logistics managers across the United States, Canada, and Mexico, then cross-checked lane mix, fuel surcharge pass-through, and contract versus spot behavior before locking the model.
Distribution of primary research fieldwork respondents
| Company type | Respondent position |
|---|---|
| Top tier: 33% | CXOs: 13% |
| Mid tier: 48% | Functional/Unit leaders: 41% |
| Smaller Players: 19% | Managers: 46% |
Market-Sizing & Forecasting
Sizing starts with a top-down build that reconstructs long-haul demand from freight activity signals, then converts that activity into revenue using observed rate behavior. In practice, we used indicators such as cross-border truck trade value and volume, industrial output and retail replenishment trends, long-distance shipment mix by destination, fuel price movement that drives surcharge logic, and reported capacity tightness proxies (equipment and driver availability commentary).
After the total is built, we corroborate it with selective bottom-up checks, including sampled carrier revenue split logic, lane-level rate quotes gathered in interviews, and sanity checks on implied revenue per load for common long-haul moves. Where a supplier roll-up could not cover smaller fleets, gaps were handled through coverage ratios and then adjusted for fragmentation and brokerage participation.
For forecasting, we mainly rely on scenario analysis because the market is sensitive to cycles in industrial production, inventory restocking, and fuel costs. The base case is set using consensus expectations shared by interviewees on contract rate resets, capacity additions, and trade lane stability, then stress-tested through optimistic and conservative cases.
Data Validation & Update Cycle
Outputs are cross-checked against independent signals so totals do not drift away from what the market is showing, and the most obvious outliers are forced to be explained. We review large year-on-year changes by tracing them back to the specific drivers in the model, and any mismatch triggers a re-check of the underlying assumptions and, when needed, a follow-up call with a respondent group.
Before sign-off, the model and inputs go through multi-step analyst review, and variance checks are run across country totals and shipment destinations to confirm internal consistency. Reports are refreshed annually, with interim updates when major events affect rates, capacity, or trade. Right before delivery, we do a final pass so clients receive the latest updated view.
Mordor Intelligence's North America Long Haul Transport Market Size Versus Other Published Estimates
Published market values can differ even when the topic sounds the same, because groups do not always use the same boundary for long-haul, the same year for currency conversion, or the same treatment of brokerage and fuel surcharge revenue. We see the spread most often when one estimate leans on a narrow industry code view, and another uses a broader logistics revenue pool.
Cross-border truck flow statistics and carrier-reported revenue trends are the checks that keep Mordor Intelligence tied to long-haul movements across the United States, Canada, and Mexico, and they also explain why some figures sit higher or lower when adjacent road freight activities are counted differently.
Benchmark comparison
| Source | Market Size | Gaps in Research Methodology |
|---|---|---|
| Mordor Intelligence | USD 499.53 B (2026) | |
| Industry Classification Tracker A | USD 226.50 B (2026) | Typically scoped to U.S. long-distance freight trucking under a single industry classification, which can exclude Canada and Mexico activity and undercount brokered moves that still sit inside long-haul demand. |
| Econometric Dataset Publisher B | USD 337.40 B (2024) | Often reported as a broad Americas regional revenue pool with limited clarity on North America-only coverage, year alignment, and how fuel surcharges and cross-border long-haul lanes are handled in the value build. |
The table shows that the biggest swings come from geography boundaries and what gets counted as long-haul revenue, not from arithmetic errors. By tying the total to observable freight signals, then testing the implied pricing and lane mix with interviews, the estimate stays traceable to clear drivers that can be repeated and updated year after year.


Key Questions Answered in the Report
What is the current value of the North America long-haul transport market?
The market is valued at USD 499.53 billion in 2026 and is projected to reach USD 604.47 billion by 2031.
Which end-user segment is growing fastest?
Wholesale and Retail Trade is advancing at a 4.41% CAGR (2026-2031), outpacing all other end-user industries.
How large is the opportunity for temperature-controlled freight?
Temperature-controlled lanes will post a 4.25% CAGR (2026-2031) as biologics and fresh-produce volumes rise.
Why is Mexico the fastest-growing geography?
Manufacturing nearshoring, USD 36 billion in foreign investment, and upgraded highways push Mexican freight at a 5.41% CAGR (2026-2031).
What impact does the driver shortage have on carrier costs?
Median pay rose 14% to USD 62,000 by 2025 and recruitment expenses can reach USD 12,000 per new driver, lifting operating ratios.
How are digital platforms changing brokerage margins?
AI-enabled load-matching cut booking times to five minutes and lowered broker margins from 16% in 2023 to 13% in 2025.
Page last updated on:





