
Market Overview
| Study Period | 2020 - 2031 |
|---|---|
| Market Size (2026) | USD 340.5 Billion |
| Market Size (2031) | USD 423.87 Billion |
| Growth Rate (2026 - 2031) | 4.48 % |
| Fastest Growing Market | Asia Pacific |
| Largest Market | Asia Pacific |
| Market Concentration | Medium |
Major Players *Disclaimer: Major Players sorted in no particular order Image © Mordor Intelligence. Reuse requires attribution under CC BY 4.0. | |
Rail Freight Transport Market Analysis by Mordor Intelligence
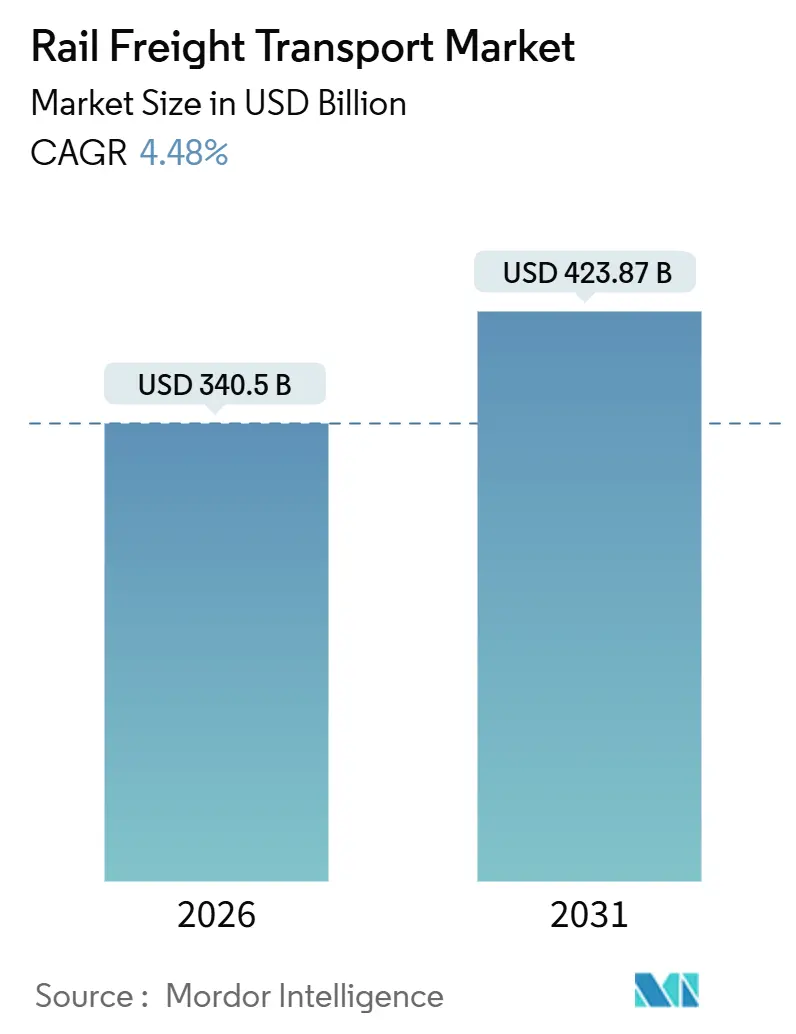
The Rail Freight Transport Market size is estimated at USD 340.5 billion in 2026, and is expected to reach USD 423.87 billion by 2031, at a CAGR of 4.48% during the forecast period (2026-2031).
The rail freight transport market is benefiting from decarbonization mandates, nearshoring, and infrastructure modernization, even as competitive pressures from low-cost trucking persist. Containerized and intermodal volumes are accelerating, alternative-fuel traction is scaling, and allied maintenance services are seizing higher margins. Cross-border corridors, especially in Asia-Pacific and North America, are drawing capital as supply chains reroute around geopolitical and climatic risks.
Key Report Takeaways
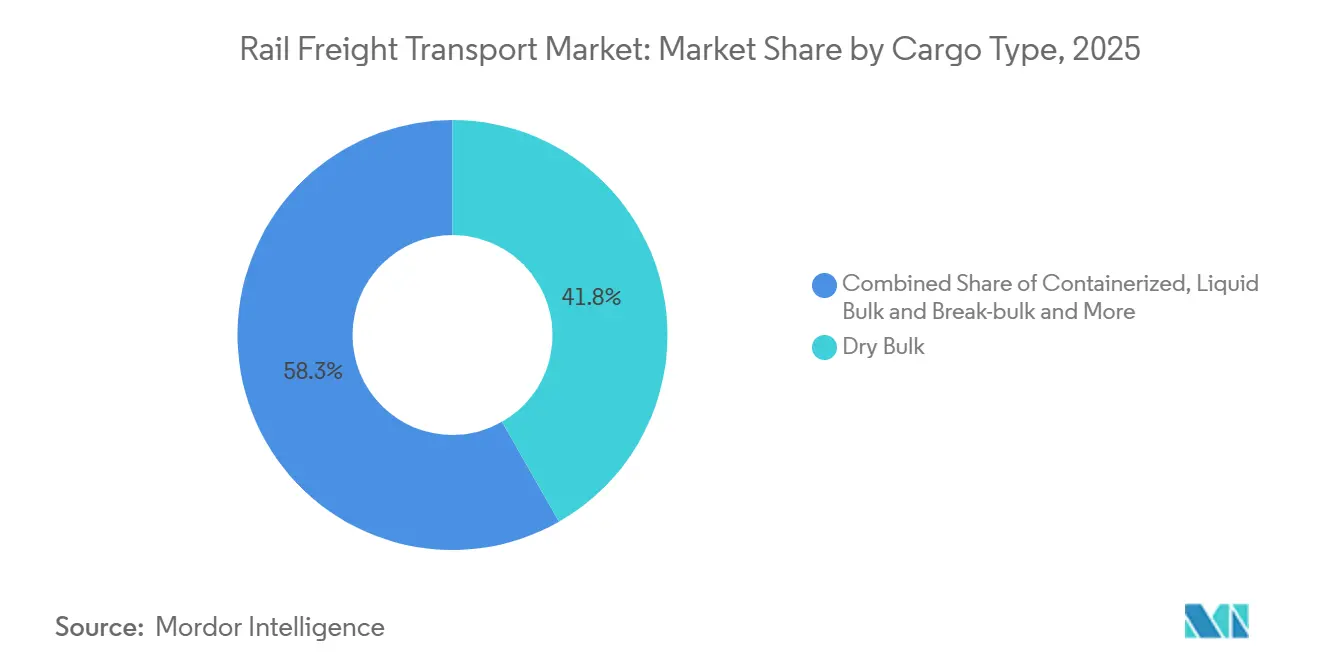
- By cargo type, dry bulk accounted for 41.75% of the rail freight transport market share in 2025, while containerized and intermodal freight are advancing at a 6.23% CAGR through 2031.
- By service type, transportation accounted for 83.14% of the rail freight transport market size in 2025; allied services are expanding at a 7.49% CAGR to 2031.
- By service type, transportation contributed 83.14% of 2025 revenue; allied services are expanding at a 7.49% CAGR to 2031.
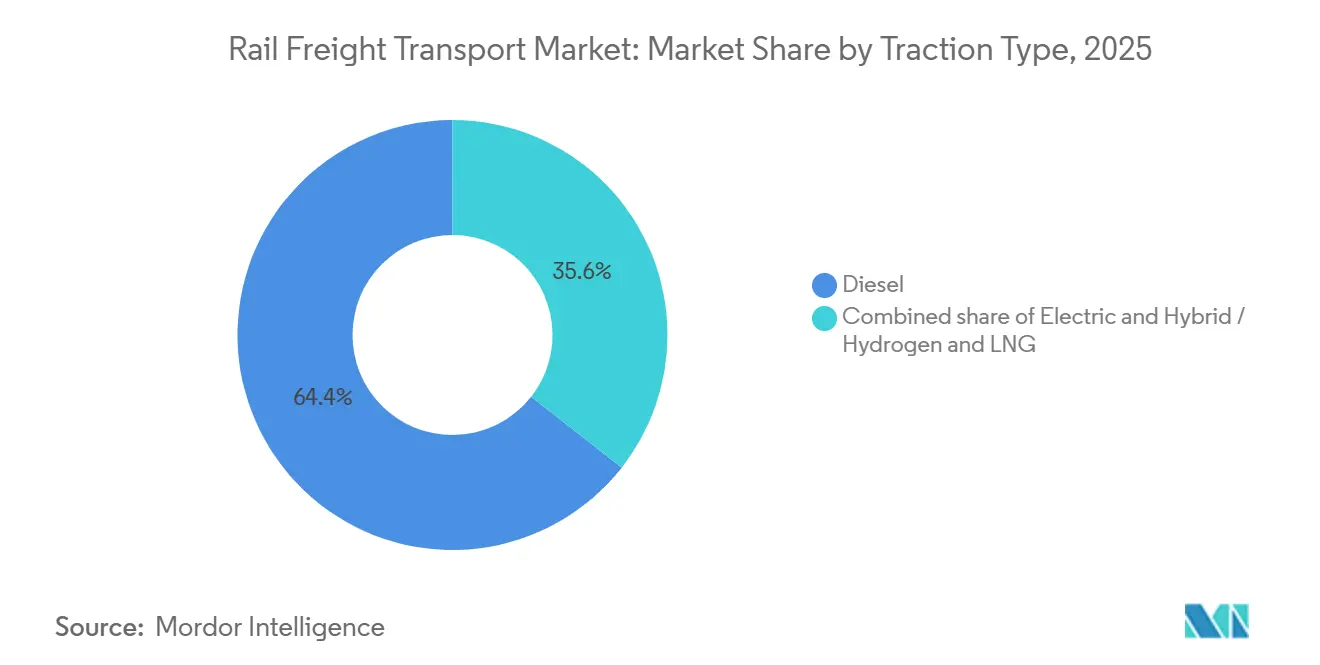
- By traction, diesel remained dominant at a 64.41% installed base in 2025, yet hybrid-hydrogen-LNG locomotives are growing at a 10.62% CAGR through 2031.
- By destination, domestic services captured 61.28% of 2025 volumes; international and cross-border freight is enlarging at a 6.68% CAGR through 2031.
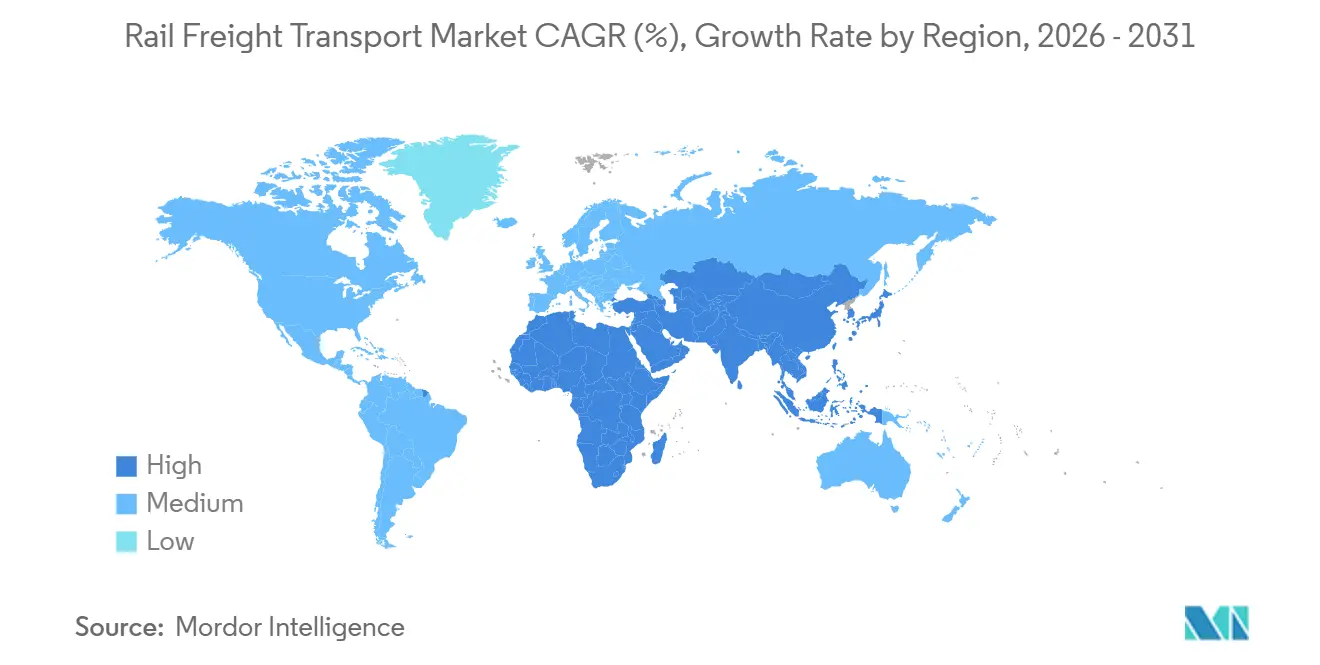
- By region, Asia-Pacific is expanding at a 6.21% CAGR to 2031.
Note: Market size and forecast figures in this report are generated using Mordor Intelligence’s proprietary estimation framework, updated with the latest available data and insights as of January 2026.
Market Trends and Insights
Drivers Impact Analysis of Rail Freight Transport Market*
| Driver | (~) % Impact on CAGR Forecast | Geographic Relevance | Impact Timeline |
|---|---|---|---|
| Decarbonization Mandates Driving Modal Shift on Long-haul North-South Corridors | +1.1% | EU & North America, extending to Asia-Pacific | Medium term (2-4 years) |
| Nearshoring of heavy manufacturing to Mexico and CEE | +0.8% | North America (U.S.-Mexico), Europe (CEE) | Short term (≤2 years) |
| Energy-transition commodities requiring bulk rail capacity | +0.6% | South America (Andean), Australia, North America | Medium term (2-4 years) |
| China-EU Land-Bridge Resilience Programs | +0.5% | Asia, Europe, Middle East corridors | Medium term (2-4 years) |
| Tier-1 Port Congestion Spurring Inland Rail-Intermodal | +0.4% | Asia-Pacific, spillover to global hubs | Short term (≤2 years) |
| Government Stimulus for Hydrogen-ready Freight Locomotives | +0.3% | Germany, Japan, select North American routes | Long term (≥4 years) |
| Source: Mordor Intelligence | |||
Decarbonization Mandates Accelerate Long-haul Modal Substitution
Emission standards are reshaping freight mode choices on routes longer than 800 km. The EU “Fit for 55” package requires a 43% reduction in heavy-duty vehicle CO₂ emissions by 2030 and a 90% drop by 2040, prompting shippers to favor rail to meet Scope 3 targets[1]European Commission, “Fit for 55 Package,” climate.ec.europa.eu. California’s Advanced Clean Fleets rule obliges large fleets to procure zero-emission trucks from 2024, further tilting demand toward the rail freight transport market. Operators are reacting by ordering hydrogen and battery locomotives; Deutsche Bahn alone intends to replace 1,300 diesel units by 2030 with federal backing of EUR 13.7 million (USD 16 million). As carbon pricing widens, the rail freight transport market gains structural cost advantages over road, supporting steady volume gains through 2031.
Nearshoring Reconfigures North American and European Rail Corridors
Manufacturers relocating closer to end markets are boosting south-north and east-west rail flows. Mexico exported more than USD 550 billion of goods to the United States in 2025, surpassing China, with automotive and electronics firms leading the shift. In Central and Eastern Europe, suppliers have clustered within 500 km of German plants, lifting cross-border rail tonnage through Poland and Czechia by 12% year over year. These shifts expand the addressable rail freight transport market while rewarding incumbents that already handle customs and interchange complexity.
Energy Transition Minerals Demand Specialized Bulk Rail Capacity
Lithium, copper, and rare-earth minerals underpin renewable-energy supply chains and require high-capacity rail solutions. Chile expects lithium output to triple by 2030, triggering investments in dedicated rail links from Atacama mines to Pacific ports. Rio Tinto’s autonomous AutoHaul trains in Western Australia carry iron ore 1,700 km with 15% lower fuel use than crewed operations, showcasing bulk-rail productivity[2]Rio Tinto, “AutoHaul Autonomous Rail Network,” riotinto.com. Hydrogen locomotives delivered to FCAB in 2024 prove alternative traction in harsh Andean terrain. Such projects widen the rail freight transport market as energy-transition minerals move in larger volumes.
China-EU Land-Bridge Optimization Enhances Eurasian Connectivity
Post-pandemic supply chain diversification has revived interest in overland corridors linking East Asia with Europe. The China-Kyrgyzstan-Uzbekistan Railway, approved in 2024, promises transit-time savings of up to 10 days compared with conventional routes. China-Europe freight train trips increased from 19,392 in 2024 to 20,022 in 2025, marking an uptick of about 3.3%. Goods value rose to USD 67.7 billion in 2025 from prior years, serving 232 cities amid network expansion. Persistent gauge-change delays still add costs, but operators that invest in dual-gauge bogies will capture more of the rail freight transport market as Eurasian volumes grow.
Restraints Impact Analysis of Rail Freight Transport Market*
| Restraint | (~) % Impact on CAGR Forecast | Geographic Relevance | Impact Timeline |
|---|---|---|---|
| Class-I Network Congestion on U.S. Midwest Grain Routes | -0.7% | U.S. Midwest, spillover to Gulf export terminals | Short term (≤2 years) |
| Draft-imposed Axle-Load Limitations on Sub-Saharan Narrow-Gauge Lines | -0.4% | Sub-Saharan Africa | Long term (≥4 years) |
| Divergent Wagon-Coupling Standards Hindering China-Central Asia Through-Traffic | -0.6% | China-Central Asia corridor | Medium term (2-4 years) |
| Long-haul Trucking Cost Deflation Narrowing Rail Price Advantage | -0.3% | North America (NAFTA region) | Short term (≤2 years) |
| Source: Mordor Intelligence | |||
Class-I Network Congestion Constrains Agricultural Export Competitiveness
US grain rail carloads rose to approximately 1.11 million in 2025, up about 3.7% from 1.07 million in 2024, supported by strong export demand and above-average weekly volumes. Proposed reciprocal-switching rules aim to improve service but may disrupt network planning. A USD 50 million siding extension in Chicago boosted CN’s velocity by 30%, illustrating that targeted capital can ease chokepoints. Operators that fail to expand capacity risk losing share of the rail freight transport market to barge and truck rivals.
Divergent Coupling Standards Fragment Eurasian Rail Integration
Incompatible coupler systems force time-consuming transshipment at China-Central Asia borders, adding 6-8 hours per train and USD 500-800 per container. Europe’s Digital Automatic Coupling program could lift freight capacity 30% by 2030, but China’s AAR-type couplers and Russia’s SA-3 design remain misaligned[3]Rail Freight Forward, “Digital Automatic Coupling,” railfreightforward.eu. Until harmonization advances, these technical barriers limit through-traffic and temper the expansion pace of the rail freight transport market on Eurasian corridors.
*Our forecasts treat driver/restraint impacts as directional, not additive. The impact forecasts reflect baseline growth, mix effects, and variable interactions.
Rail Freight Transport Market Segment Analysis
By Cargo Type:
Bulk Volumes Anchor, Containers Propel GrowthThe rail freight transport market size for bulk commodities accounted for 41.75% of the 2025 value, underscoring rail’s cost edge for coal, ore, and grain. Rio Tinto’s 1,700 km AutoHaul network runs at 99.7% reliability, proving autonomous bulk operations at scale. Containerized and intermodal flows are advancing at a 6.23% CAGR, fueled by e-commerce and nearshoring that prioritize flexible logistics. BNSF’s USD 3.8 billion 2025 capex includes a Phoenix intermodal hub targeting 15% domestic-container growth.
Liquid bulk, chiefly oil and chemicals, retains stable demand because rail offers safer handling of hazardous cargo over pipelines for specific routes. Break-bulk and project cargo remain niche, serving turbines and oversize machinery. The Federal Railroad Administration’s 2025 Freight Car Safety Standards ban components from countries of concern, raising procurement costs yet strengthening long-term resilience. Operators that balance mass-bulk roots with container diversification will weather commodity cycles better than pure-play specialists.



By Service Type:
Core Haulage Dominates as Ancillary Services SurgeTransportation services generated 83.14% of 2025 revenue, reflecting the historic core of the rail freight transport market. Precision-scheduled railroading, asset turns, and line-haul velocity remain central performance metrics. Allied services maintenance, switching, and storage are growing at a 7.49% CAGR, signaling a pivot to higher-margin business lines. SNCF’s split into Hexafret (operations) and Technis (maintenance) targets EUR 200 million (USD 233.6 million) third-party maintenance revenue by 2027.
Regulatory rules demanding more frequent inspections of tank cars and hazardous-materials wagons raise compliance hurdles for new entrants, protecting incumbent profits. Wabtec booked over USD 1 billion in fourth-quarter 2024 orders for locomotive upgrades and digital diagnostics, underscoring aftermarket scale[4]Wabtec Corporation, “Q4 2024 Results,” wabteccorp.com. Operators that internalize maintenance talent can capture lifecycle value and strengthen negotiating power with rolling-stock suppliers.
By End-user Industry:
Mining Still Leads, Retail Logistics AccelerateMining and minerals shipped the highest tonnage, contributing 31.77% of 2025 volumes to the rail freight transport market. Rate negotiations remain tough; BHP secured 8-12% reductions in 2024 contracts by guaranteeing volumes. Retail and FMCG flows are climbing at a 7.98% CAGR, as coastal port arrivals connect to inland fulfillment centers by rail. Schneider National’s Southeast-Mexico intermodal lane promises 62% less CO₂ than truck and 18-24 hours faster delivery.
Oil, gas, and chemicals enjoy steady carloads because pipeline capacity is finite and safety rules favor rail for certain hazmat routes. Agriculture volumes fluctuate seasonally but benefit from expanded grain elevator connections. Automotive supply chains integrate rail to handle batteries and finished vehicles; Norfolk Southern markets itself as an EV supply-chain partner with specialized battery handling. Diversified customer portfolios enable operators to hedge against sector downturns.
By Traction Type:
Diesel Dominates, Alternatives Gain SpeedDiesel locomotives accounted for 64.41% of the active fleet in 2025, but fuel-price volatility and carbon taxes are eroding their cost advantage. Hybrid-hydrogen-LNG units are advancing at a 10.62% CAGR, reflecting government subsidies and technology maturation. CPKC’s hydrogen trial in Western Canada achieved diesel-like refuel times and 500 km ranges, highlighting the potential for cleaner rail freight transport in Canada across non-electrified corridors. Siemens Mobility and Tyczka Hydrogen plan an end-to-end hydrogen supply architecture for non-electrified corridors.
Electric traction spreads where catenary already exists, notably in Europe and parts of Asia, offering zero direct emissions and higher energy efficiency. Battery-electric and dual-mode locomotives allow silent, zero-emission urban operation while retaining long-haul capability. Operators phasing investments along high-utilization routes first will avoid stranded-asset write-downs and secure green-premium contracts.
By Destination:
Domestic Maturity Meets Cross-border MomentumDomestic movements captured 61.28% of 2025 tonnage, reflecting entrenched national networks and regulatory familiarity. Growth is moderate as capacity caps approach, and trucking competes on short hauls. International and cross-border traffic is rising at a 6.68% CAGR, fueled by trade accords and dedicated infrastructure. Europe’s TEN-T program earmarks EUR 30 billion (USD 35 billion) to lift rail modal share to 30% by 2030.
Schneider National’s new Mexico-to-Southeast U.S. service leverages CSX and CPKC’s single-line route to bypass traditional truck lanes. Digital customs platforms that pre-clear documentation reduce idle dwell, improving rail’s door-to-door competitiveness. Operators with established border-agency relationships and multidomain IT systems are positioned to win incremental cross-border share of the rail freight transport market.
Geography Analysis
APAC Rail Freight Transport Market
Asia-Pacific contributes the fastest regional expansion at 6.21% CAGR through 2031, underpinned by China’s Belt and Road projects and India’s 3,360 km of dedicated freight corridors. India’s corridors support 25-ton axle loads and 1,500 m trains, slicing per-ton costs up to 40%. Japan is piloting hydrogen locomotives, Australia’s mining lines run autonomous consists, and Southeast Asia is modernizing track and terminals, such as Vietnam SuperPort.
North America Rail Freight Transport Market
North America records stable mid-single-digit growth as nearshoring boosts south-north volumes. Union Pacific posted USD 1.8 billion in Q3 2025, including merger costs. CPKC, now the continent’s only single-line Canada-U.S.-Mexico operator, is capturing automotive and consumer goods traffic on the newly branded Southeast Mexico Express.
EMEA and South America Rail Freight Transport Market
Europe’s liberalization increases rivalry; SNCF’s Hexafret spin-off pursues profitability via specialization, and Germany subsidizes hydrogen locomotives. South America remains commodity-focused, with FCAB’s hydrogen locomotive proving green traction at high altitude. The Middle East and Africa present greenfield prospects such as the USD 3 billion UAE-Oman line and a USD 1 billion AfDB loan to rehabilitate South Africa’s Transnet Freight Rail. Narrow gauges and axle-load limits temper near-term capacity but provide long-run upside once upgrades finish.

Regulatory Landscape
Regulation is tightening around safety, interoperability, and network capacity allocation, with direct implications for fleet investment, cross-border performance, and compliance costs. In the United States, the Federal Railroad Administration has continued to formalize safety requirements, including a December 2024 final rule strengthening Freight Car Safety Standards (49 CFR Part 215), and a January 2026 Federal Register action codifying existing waivers for reflectorization of rail freight rolling stock (49 CFR Part 224). This is pushing operators and lessors toward more standardized retrofit, inspection, and documentation practices.
In Europe, rail policy is moving from corridor-by-corridor approaches toward more unified, digital-first coordination for international freight paths. In May 2026, the European Parliament approved a Regulation on the use of railway infrastructure capacity in the Single European Railway Area, replacing Regulation (EU) No 913/2010 to improve cross-border coordination. At the same time, the EU has continued to refine wagon interoperability through updates to the WAG TSI (Implementing Regulation (EU) 2025/2064, adopted in October 2025). Great Britain has advanced rolling-stock technical rules via the Department for Transport's National Technical Specification Notice (NTSN) for freight wagons (Issue 2, May 2025), and reintroduced a Railways Bill in the 2026-27 session that includes a statutory rail freight growth target under the proposed Great British Railways model.
Value Chain Analysis
The rail freight transport value chain runs from infrastructure ownership and access (governments and infrastructure managers) to fleet and technology supply (locomotive and wagon OEMs, braking and control-system providers, and alternative-fuel supply partners), then to operations (rail freight operators, intermodal and combined-transport operators, and terminal and depot managers), and finally to cargo owners and forwarders that contract line-haul plus last-mile services. As containerized and intermodal freight grows faster than bulk in the current market structure, terminals, cranes, yard automation, and data interfaces (slot booking, tracking, and customs pre-clearance on cross-border corridors) are becoming higher-leverage nodes than line-haul alone, which increases the importance of partnerships among railways, ports and dry ports, and logistics integrators.
Bottlenecks tend to cluster at network interfaces, where congestion and poorly coordinated construction windows, signal disruptions, and equipment imbalances can strand containers away from demand centers. Recent corridor activity also shows how infrastructure and border logistics shape capacity creation, including regular freight traffic beginning on the Budapest-Belgrade line in February 2026, and Türkiye, Azerbaijan, and Georgia moving the Baku-Tbilisi-Kars (BTK) line to full-capacity operations in June 2026. On the demand side, North American port-to-inland intermodal remains a major flow generator, since intermodal throughput is a significant share of containers leaving port terminals by train. That keeps chassis management, container repositioning, and inland hub throughput central to end-to-end service reliability.
Competitive Landscape
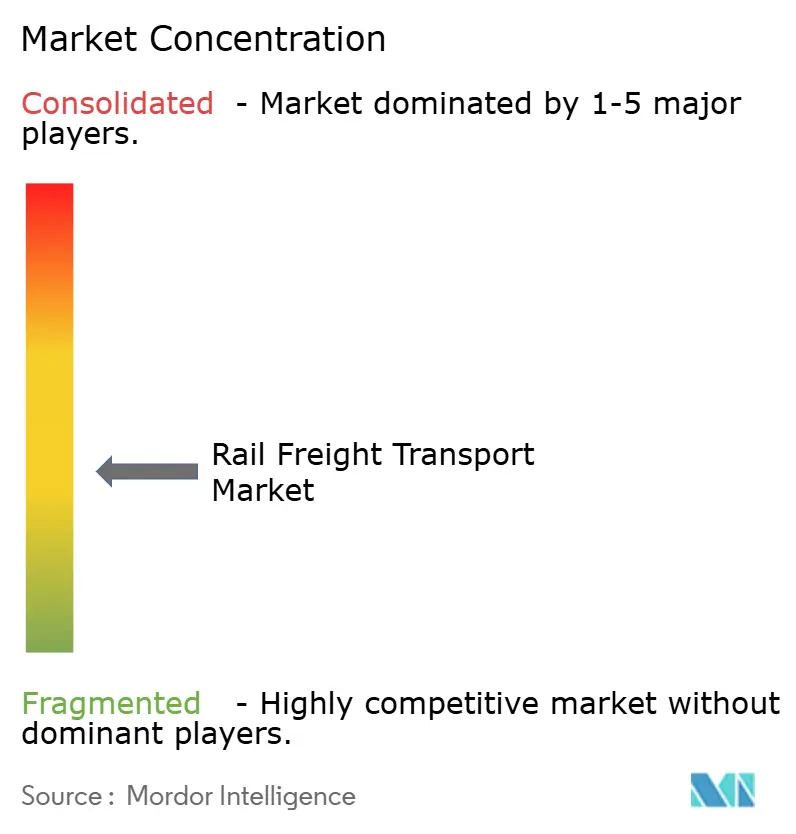
The rail freight transport market is regionally concentrated yet globally fragmented. In North America, seven Class I operators control the majority of ton-miles, leveraging precision-scheduled railroading, double-stack intermodal, and fuel surcharges to sustain margins. BNSF, Union Pacific, and CPKC continue multibillion-dollar capex programs targeting key growth corridors and allied services like car repair.
Europe hosts national incumbents DB Cargo, SNCF’s Hexafret, PKP Cargo, plus agile entrants such as SBB Cargo and Genesee & Wyoming Europe. Liberalization enables price competition but erodes individual share, pushing incumbents toward specialization, automated coupling, and hydrogen traction pilots.
Technology uptake separates leaders from laggards. Rio Tinto’s 99.7%-reliable AutoHaul raises the bar for autonomous heavy haul. Wabtec supplies digital braking and diagnostics that raise uptime and support emissions compliance. Compliance with ISO 14001 and Science-Based Targets now influences shipper choices, granting operators with credible decarbonization roadmaps a pricing premium in the rail freight transport market.
Rail Freight Transport Industry Leaders
BNSF Railway
Union Pacific Railroad
Russian Railways
Canadian National Railway
DB Cargo
- *Disclaimer: Major Players sorted in no particular order
Rail Freight Transport Market Companies Covered in this Report
- Union Pacific Railroad Company
- BNSF Railway Company
- Canadian National Railway Company
- Canadian Pacific Kansas City Limited (CPKC)
- CSX Transportation, Inc.
- Norfolk Southern Railway Company
- DB Cargo AG
- Fret SNCF (Hexafret)
- SBB Cargo AG
- Russian Railways (RZD)
- PKP Cargo S.A.
- Genesee & Wyoming Inc.
- Pacific National Pty Ltd
- Qube Holdings Limited
- Japan Freight Railway Company
- Indian Railways
- Qatar Railways Company (Qatar Rail)
- Etihad Rail PJSC
- Transnet Freight Rail
- Aurizon LTD*

Market Opportunities and Future Outlook
Intermodal capacity and inland logistics nodes are a clear whitespace where nearshoring, e-commerce replenishment, and port-to-inland distribution are converging. In the United States, BNSF announced a USD 3.6 billion 2026 capital investment plan that includes dedicated funding for capacity expansion projects. It has also advanced the Barstow International Gateway (BIG) development in California as a large inland hub intended to handle intermodal shipments and reduce truck miles. Together, these moves point to where operators are allocating capital to protect service velocity and win share on long-haul lanes, where rail can combine line-haul with terminal productivity.
Policy simplification and operator-access reforms also create room for new service designs and partnerships, especially in high-growth Asia-Pacific corridors where domestic rail dominates today but cross-border and containerization are increasing. In July 2026, Indian Railways announced reforms that remove multi-slab freight structures for fertilizers and foodgrains, introduce a unified license for container train operators, and roll out a skill certification framework. That supports more standardized, scalable container-train operations and broader third-party participation. Alongside infrastructure programs such as dedicated freight corridors and the shift toward digitalization (automation in yards, remote operations, and DAC-related initiatives in Europe), opportunities are concentrating around: (i) allied services such as maintenance, switching, and storage that monetize asset uptime, and (ii) alternative-traction pilots and fueling ecosystems on non-electrified freight routes, where operators can pair emissions compliance with shipper Scope 3 requirements without completing full network electrification.
Recent Industry Developments in Rail Freight Transport Market
- July 2026: Canadian National Railway reported moving 2.67 million metric tonnes of grain in June 2026, setting a new monthly record on its network. The result highlights how operational execution and corridor fluidity convert agricultural demand into rail volumes, reinforcing the importance of terminal throughput and cycle time during peak export periods.
- May 2026: Keyera, AltaGas, and Canadian National Railway launched the Alberta Corridor Export (ACE) Rail Terminal Project, anchored by an initial USD 240 million investment by Keyera. The project links Alberta industrial supply with West Coast export platforms, strengthening end-to-end commodity logistics and creating a new capture point for rail-linked export growth.
- April 2026: Union Pacific Railroad signed a seven-year contract with Rocky Mountain Steel Mills for domestic production of steel rails from the Pueblo, Colorado facility. Securing a long-term, domestic rail supply supports maintenance and renewal programs and reduces exposure to cross-border procurement disruptions for critical track materials.


Rail Freight Transport Market Report Scope and Research Methodology
Market Definition and Coverage
This market covers revenues earned from transporting goods by rail, where freight is moved on rail networks using freight trains and related operating services. The sizing focuses on paid freight movement services delivered by licensed rail operators for commercial customers.
Scope exclusions: passenger rail services (including commuter and high-speed), pipeline transport, and in-plant industrial shunting are excluded from this market sizing.
Segments Covered in This Report
- By Cargo Type
- Containerised / Intermodal
- Dry Bulk (Coal, Ores, Grains)
- Liquid Bulk (Crude, Chemicals)
- Break-bulk and Project Cargo
- By Service Type
- Transportation
- Services Allied to Transportation (Maintenance of Railcars and Rail Tracks, Switching of Cargo, and Storage)
- By End-user Industry
- Mining and Minerals
- Oil, Gas and Chemicals
- Agriculture and Food
- Manufacturing and Automotive
- Retail and FMCG
- Construction Materials and Forestry
- By Traction Type
- Diesel
- Electric
- Hybrid / Hydrogen and LNG
- By Destination
- Domestic
- International / Cross-border
- By Geography
- North America
- United States
- Canada
- Mexico
- South America
- Brazil
- Peru
- Chile
- Argentina
- Rest of South America
- Asia-Pacific
- India
- China
- Japan
- Australia
- South Korea
- South East Asia (Singapore, Malaysia, Thailand, Indonesia, Vietnam, and Philippines)
- Rest of Asia-Pacific
- Europe
- United Kingdom
- Germany
- France
- Spain
- Italy
- BENELUX (Belgium, Netherlands, and Luxembourg)
- NORDICS (Denmark, Finland, Iceland, Norway, and Sweden)
- Rest of Europe
- Middle East And Africa
- United Arab of Emirates
- Saudi Arabia
- South Africa
- Nigeria
- Rest of Middle East And Africa
- North America
Data Sources, Market Sizing, and Validation
Desk Research
Desk research starts by organizing the demand pool and the service revenue boundary, then collecting consistent reference series by region. Public sources such as the International Union of Railways (UIC), International Transport Forum (ITF), the World Bank, UN Comtrade, and national transport ministries and rail regulators help anchor freight activity indicators like rail ton-km, trade flows, and corridor utilization.
We also review operator annual reports, investor presentations, and audited filings to understand revenue mix and changes in yield per ton-km, and we use reputable logistics press for policy and network events. For cross-checking trade-linked volumes, an import and export shipment-level database is used selectively to validate commodity and container flows that typically end up on rail. The desk research sources listed here are illustrative, and other public references were also used during data collection, validation, and clarification.
Primary Interviews and Surveys
Primary work is used to test revenue boundaries and to translate activity indicators into realistic pricing and mix assumptions, especially where public reporting is uneven. We spoke with rail freight operators, logistics providers, infrastructure stakeholders, and large shipper-side users across major rail corridors, and then rechecked assumptions by region to reflect differences in commodity mixes and contract styles.
Distribution of primary research fieldwork respondents
| Company type | Respondent position | Region |
|---|---|---|
| Top tier: 35% | CXOs: 12% | APAC: 43% |
| Mid tier: 48% | Functional/Unit leaders: 38% | EMEA: 36% |
| Smaller Players: 17% | Managers: 50% | Americas: 21% |
Market-Sizing & Forecasting
The core model uses a top-down approach where rail freight activity indicators are converted into revenue by applying region-specific yield logic. In practice, rail ton-km trends, intermodal share shifts, bulk commodity cycles, corridor capacity additions, and fuel and electricity cost movements are used as inputs that shape both volume and pricing expectations.
To keep totals realistic, selective bottom-up approximations are used as a cross-check, such as rolling up sampled operator freight revenue and testing implied yield per ton-km against interviewed ranges. We also validate intermodal pricing direction through channel checks. Where country-level public disclosure is limited, we proxy from comparable rail networks, then correct using trade exposure, commodity mix, and network density differences.
For forecasting, scenario analysis is applied around macro drivers that rail freight tends to track, and then the final path is tightened using multivariate regression outputs for variables like industrial production, trade value, and infrastructure additions. Assumptions are kept simple enough to repeat, and we only retain them after they align with what primary respondents describe as practical contract and volume behavior.
Data Validation & Update Cycle
Outputs are validated through triangulation across independent signals, and we run checks for sharp variances by region, cargo mix, and implied yield levels. If a country total suggests unrealistic revenue per ton-km, or shows a sudden mix change without an identifiable policy or network trigger, we revisit the underlying inputs and start follow-up conversations.
Before sign-off, the model and assumptions go through a multi-step internal review to keep calculation logic, unit consistency, and currency handling clean. The report is refreshed annually, and interim updates are made when a material event affects rail corridors, regulation, or freight demand. Right before delivery, we run a final pass to incorporate the latest public releases and key market signals.
Mordor Intelligence's Rail Freight Transport Market Size Versus Other Published Estimates
Published market values for rail freight transport can differ even when they appear to cover the same scope, because the service boundary, timing, and pricing choices are not always aligned. Variations commonly come from whether allied services are counted, how domestic versus cross-border revenue is treated, and how the model translates tonnage or ton-km into realized revenue.
Freight activity evidence such as reported rail ton-km direction, intermodal volume commentary, and the implied revenue per ton-km range are used to keep Mordor Intelligence tied to a clear rail-only revenue pool. This is one reason the 2026 total can sit away from figures anchored to different base years. In some publications, the base year is earlier and then projected using a higher growth path, while others widen scope to include adjacent logistics services or different pricing uplift assumptions that are not revalidated each year.
Benchmark comparison
| Source | Market Size | Gaps in Research Methodology |
|---|---|---|
| Mordor Intelligence | USD 340.5 B (2026) | |
| Global Research House A | USD 313.0 B (2024) | Uses an earlier base year and a longer horizon, and the scope signals a broader service stack across cargo, traction, and end users without clearly separating rail service revenue from allied logistics revenue. |
| Industry Publisher B | USD 291.62 B (2024) | Anchors the estimate to 2023 to 2024 values and applies a uniform growth rate, with limited visibility on how ton-km and yield are reconciled across regions and how currency timing is handled. |
The spread across the three figures is mainly explained by base-year choice and how strictly the rail service revenue boundary is applied. When activity signals and yield checks are used together, the final number is easier to trace back to observable freight movement and pricing behavior, which improves repeatability for planning.


Key Questions Answered in the Report
How large is the rail freight transport market in 2026?
The rail freight transport market size is USD 340.50 billion in 2026, expanding toward USD 423.87 billion by 2031 at a 4.48% CAGR.
Which cargo type is growing fastest through 2031?
Containerized and intermodal freight leads with a 6.23% CAGR, driven by e-commerce logistics and flexible supply-chain needs.
What traction technologies will gain share?
Hybrid, hydrogen, and LNG locomotives are projected to grow at 10.62% CAGR as operators comply with decarbonization rules and fuel-cost volatility.
Which region posts the highest growth rate?
Asia-Pacific registers the fastest expansion at 6.21% CAGR, supported by Belt and Road investments and India’s dedicated freight corridors.
How are nearshoring trends impacting rail volumes?
Manufacturing shifts to Mexico and Central and Eastern Europe are adding density to north-south and east-west rail lanes, lifting cross-border volumes by double digits.
What is the biggest operational restraint today?
Capacity bottlenecks on U.S. Midwest grain routes are lengthening transit times and risking modal shifts to trucking and barges.
Page last updated on:




