
Market Overview
| Study Period | 2020 - 2031 |
|---|---|
| Forecast Data Period | 2026 - 2031 |
| Base Year Market Size (2025) | USD 71.77 Billion |
| Market Size (2026) | USD 74.17 Billion |
| Market Size (2031) | USD 87.42 Billion |
| Growth Rate (2026 - 2031) | 3.34 % |
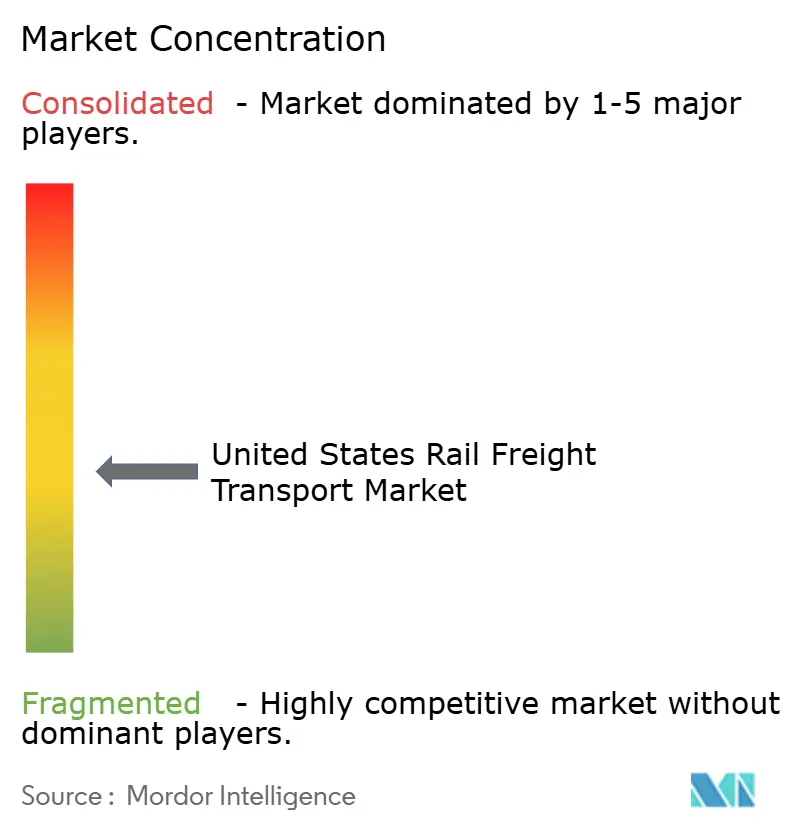
| Market Concentration | Medium |
Major Players *Disclaimer: Major Players sorted in no particular order Image © Mordor Intelligence. Reuse requires attribution under CC BY 4.0. | |
United States Rail Freight Transport Market Analysis by Mordor Intelligence
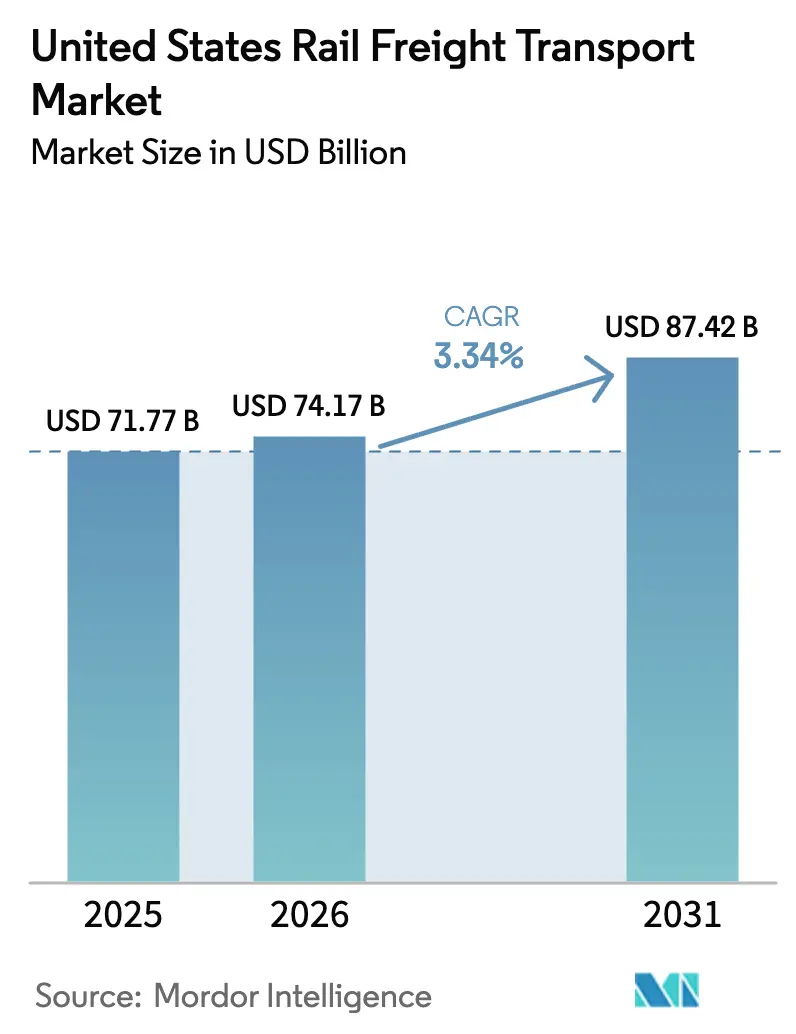
The United States Rail Freight Transport Market size market size in 2026 is estimated at USD 74.17 billion, growing from 2025 value of USD 71.77 billion with 2031 projections showing USD 87.42 billion, growing at 3.34% CAGR over 2026-2031.
Intermodal traffic remains the engine of top-line expansion as retailers strengthen e-commerce supply chains and shift more import boxes from coast-side terminals onto inland trains. Carriers are funding larger intermodal ramps, siding extensions, and double-tracking projects that ease bottlenecks and add turn-time flexibility, helping them protect pricing in lanes where trucking still offers speed advantages. Bulk flows are changing too: grain has stepped up to fill part of the coal shortfall, while Gulf Coast petrochemical output is nudging tank-car demand higher and encouraging railroads to commit capital to hazmat-certified equipment. Persistent federal investment especially through Infrastructure Investment and Jobs Act grants lowers the cost of modernisation and supports advanced train-handling technologies that can lift asset productivity even as headcount stabilises. Competitive focus is shifting from pure cost control to service dependability; operators that blend Precision Scheduled Railroading discipline with customer-facing visibility tools appear better positioned to win discretionary freight over the next five years.
Key Report Takeaways
- By cargo type, Intermodal captured 47.20 % of the United States Rail Freight Transport market share in 2025, while break-bulk and project cargo within the United States Rail Freight Transport market size is expected to expand at a 6.82 % CAGR through 2031.
- By service type, core Transportation services generated 88.40 % of the United States Rail Freight Transport market share in 2025, whereas the United States Rail Freight Transport market size tied to Allied services is forecast to grow at a 7.02 % CAGR to 2031.
- By end-user industry, Mining & Minerals held 21.60 % of the United States Rail Freight Transport market share in 2025, and the United States Rail Freight Transport market size linked to Retail & FMCG is projected to advance at an 7.88 % CAGR over the same horizon.
- By traction type, Diesel locomotives accounted for 81.30 % of the United States Rail Freight Transport market share in 2025, yet the United States Rail Freight Transport market size for Hybrid/Hydrogen & LNG locomotion is set to rise at a 10.05 % CAGR through 2031.
- By destination, Domestic movements represented 80.70 % of the United States Rail Freight Transport market share in 2025, while the United States Rail Freight Transport market size for cross-border traffic is anticipated to climb at a 8.25 % CAGR during 2026-2031.
Note: Market size and forecast figures in this report are generated using Mordor Intelligence’s proprietary estimation framework, updated with the latest available data and insights as of 2026.
United States Rail Freight Transport Market Trends and Insights
Drivers Impact Analysis*
| Driver | (~) % Impact on CAGR Forecast | Geographic Relevance | Impact Timeline |
|---|---|---|---|
| Surge in E-commerce-led Intermodal Volumes | +0.8% | West Coast, Southwest, inland hubs | Medium term (3-4 yrs) |
| Gulf Coast Petrochemical Boom | +0.4% | Texas and Louisiana Gulf Coast | Medium term (3-4 yrs) |
| IIJA-Funded Corridor Upgrades | +0.6% | Nationwide; emphasis on Northeast Corridor and key freight routes | Long term (≥ 5 yrs) |
| Cross-border Grain Flows from Canada | +0.3% | Northern border states, Upper Midwest | Short term (≤ 2 yrs) |
| Resurgence of Domestic Coal under High Gas Prices | +0.2% | Powder River Basin, Appalachia | Short term (≤ 2 yrs) |
| Precision Scheduled Railroading Cost Efficiencies | +0.5% | National | Medium term (3-4 yrs) |
| Source: Mordor Intelligence | |||
Surge in E-commerce-Led Intermodal Volumes
Containerised freight remains the United States rail freight transport market’s growth engine, with total intermodal units up 8.5 % year over year in 2024. Class I carriers have accelerated pop-up ramp initiatives and inland-port developments to capture e-commerce imports flowing through West Coast and Southwest gateways. Because omnichannel retailers schedule inventory replenishment in daily windows, on-time performance is becoming as vital as price. A clear outgrowth is the placement of new distribution centres on rail-served sites in secondary urban rings, which lengthens the dray leg and tilts the cost equation toward rail line-haul.
Gulf Coast Petrochemical Boom Boosting Tank-Car Traffic
Petrochemical complexes along the Texas-Louisiana coastline recorded a 4.2 % production increase in 2024, and rail shipments of chemicals rose roughly 3.5 % year over year, outpacing overall freight growth. ExxonMobil’s USD 2 billion Baytown expansion alone is raising specialty-chemical output by 40 %, driving additional inbound feedstock and outbound product moves. The planned deep-water Sea Port Oil Terminal at Freeport, Texas, approved by the Maritime Administration, will further reshape tank-car corridors by adding capacity to load 2 million barrels of crude daily. Growing traffic density is prompting carriers to invest in double-tracking and yard expansions to avoid pinch points.
Cross-Border Grain Flows from Canada to the United States
Canadian National’s grain and fertiliser revenue climbed 9 % in Q3 2024 thanks to a robust U.S. harvest. Rail grain movements from Canada to the U.S. exceeded 6.9 million metric tonnes that year, reinforcing rail’s role in cross-border trade. The single-line network created by Canadian Pacific Kansas City (CPKC) is poised to add further capacity, with a winter contingency plan targeting 685 000 tonnes weekly when Thunder Bay is ice-free [1]Canadian Pacific Kansas City, “Strengthening Resiliency: 2024–2025 Winter Contingency Report,” Canadian Pacific Kansas City, cpkcr.com. Increased throughput tightens supply-chain integration between Prairie grain elevators and Midwest processors, boosting car utilisation for carriers.
Resurgence of Domestic Coal under High Gas Prices
Temporary spikes in natural-gas prices drove a 3.2 % winter-over-winter increase in coal burn at power plants, and about 70 % of that coal moves by rail [2]U.S. Energy Information Administration, “U.S. coal shipments increased slightly in 2022 as power plants replenished stockpiles,” U.S. Energy Information Administration, eia.gov. Railroads chose to keep capacity active in the Powder River Basin, valuing optionality over immediate cost cuts. The upturn supports network economics because coal routes often subsidise mixed-freight lanes, although operators remain cautious about investing new capital in declining corridors. This behaviour suggests that cash-flow resilience, rather than long-term growth, motivates carriers to maintain coal capability.
Restraints Impact Analysis*
| Restraint | (~) % Impact on CAGR Forecast | Geographic Relevance | Impact Timeline |
|---|---|---|---|
| Structural Decline in Coal-Fired Power | -0.7% | Coal-producing regions | Long term (≥ 5 yrs) |
| Service Reliability Issues | -0.6% | Congested corridors nationwide | Medium term (3-4 yrs) |
| Labor Contract Disputes & Wage Inflation | -0.4% | National | Medium term (3-4 yrs) |
| Tightened Hazmat Regulations on Flammable Liquids | -0.3% | Gulf Coast, major energy corridors | Medium to long term (3-5 yrs) |
| Source: Mordor Intelligence | |||
Structural Decline in U.S. Coal-Fired Power
Coal shipments fell 13.6 % in 2024, reaching their lowest volume since 1988, and the Energy Information Administration sees coal’s share of generation sliding to 15 % by 2030. Class I carriers manage the downturn by allowing specialised coal cars to retire through attrition while redirecting capital toward diversified bulk and intermodal projects. Because coal routes historically subsidised network maintenance, their decline requires rate adjustments across other commodities, subtly affecting overall pricing power.
Service Reliability Issues Driving Mode Shift to Trucking
Journal of Commerce surveys show that many rail customers remained dissatisfied with H2 2024 performance, citing missed pick-ups and erratic transit times. Shippers warned regulators that weak rail service threatens the broader economy, prompting congressional hearings and calls for Surface Transportation Board action. Some cargo has migrated to trucking despite higher freight rates, underscoring the premium shippers place on dependability. Carriers have begun posting real-time dashboards and rehiring crews to stabilise key terminals, indicating a more proactive stance on service recovery.
*Our forecasts treat driver/restraint impacts as directional, not additive. The impact forecasts reflect baseline growth, mix effects, and variable interactions.
Segment Analysis
Cargo Type: Intermodal Leads Growth Amid Evolving Commodity Mix
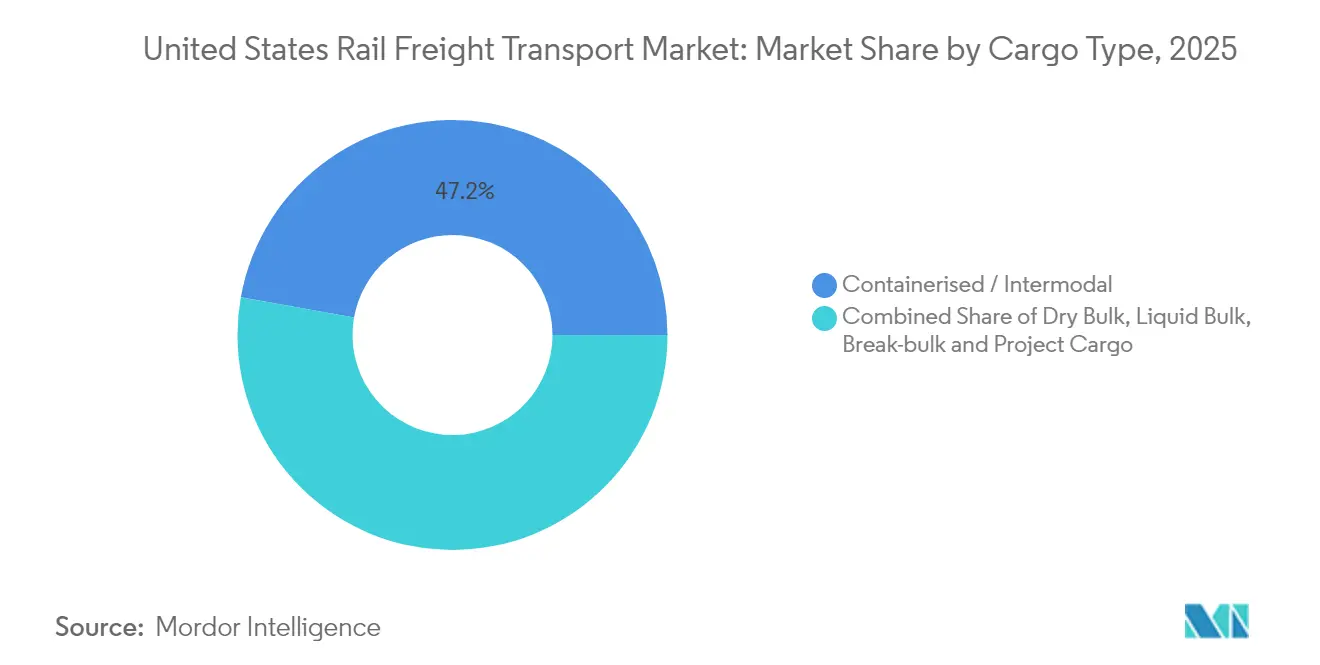
Intermodal holds a 47.20 % market share of the United States rail freight transport market size in 2025, reflecting the segment’s dominance as e-commerce and global sourcing reshape supply chains. Volume growth of 8.5 % in 2024 confirms that container traffic remains the primary engine of car-load expansion. Terminal productivity, rather than mainline speed, is emerging as the constraint; BNSF and Union Pacific have therefore prioritised new ramp capacity in Chicago and Phoenix to keep stack-train velocity intact.
Dry bulk is the next-largest segment, yet coal’s 13.6 % decline has shifted its internal mix toward grains and aggregates. Grain carloads rose year over year, cushioning revenue loss from coal and highlighting the importance of agricultural flows reported by the Agricultural Marketing Service . Liquid bulk benefits from petrochemical output gains, while break-bulk and project cargo, though the smallest, show the fastest forecast CAGR at 6.82 % as renewable-energy components move by rail. The evolving commodity mix signals that railroads must maintain a flexible wagon fleet to manage diverse loading needs across cargo types.



Service Type: Allied Services Gain Momentum in Integrated Logistics
Transportation services account for roughly 88.40 % of 2025 market size, but allied services are forecast to grow at a 7.02 % CAGR through 2031. Growth in storage, transloading, and wagon maintenance reflects shippers’ demand for one-stop logistics solutions that reduce hand-offs. By bundling these services, carriers create stickier revenue streams and improve car utilisation, indirectly lifting margins.
BNSF’s Shortline Select partnership with Genesee & Wyoming demonstrates how main-line carriers leverage network reach to support smaller railroads and expand transload offerings. Railroads are also investing in predictive-maintenance software to cut repair cycle-time, freeing assets for higher-yield traffic. Together, these trends imply that allied services will outpace core haulage in revenue growth, enhancing overall industry resilience.
End-user Industry: Retail & FMCG Disrupts Traditional Dominance
Mining & Minerals commands a 21.60 % market share of 2025 rail freight volumes, anchored by residual coal traffic and rising shipments of critical minerals. Agriculture & Food retains a significant slice, supported by grain unit-train configurations that deliver low cost per tonne. Notably, cross-border grain expansions have strengthened this segment’s outlook.
Retail & Fast-Moving Consumer Goods is forecast to post an 7.88 % CAGR through 2031, making it the fastest-growing end-user category. Oil, Gas & Chemicals is buoyed by Gulf Coast investments, while Manufacturing & Automotive shows corridor-specific variability linked to plant schedules. This diversified demand mosaic reduces cyclicality and supports steady capital spending across the rail network.
Traction Type: Hybrid/Hydrogen & LNG Accelerates Amid Decarbonization Push
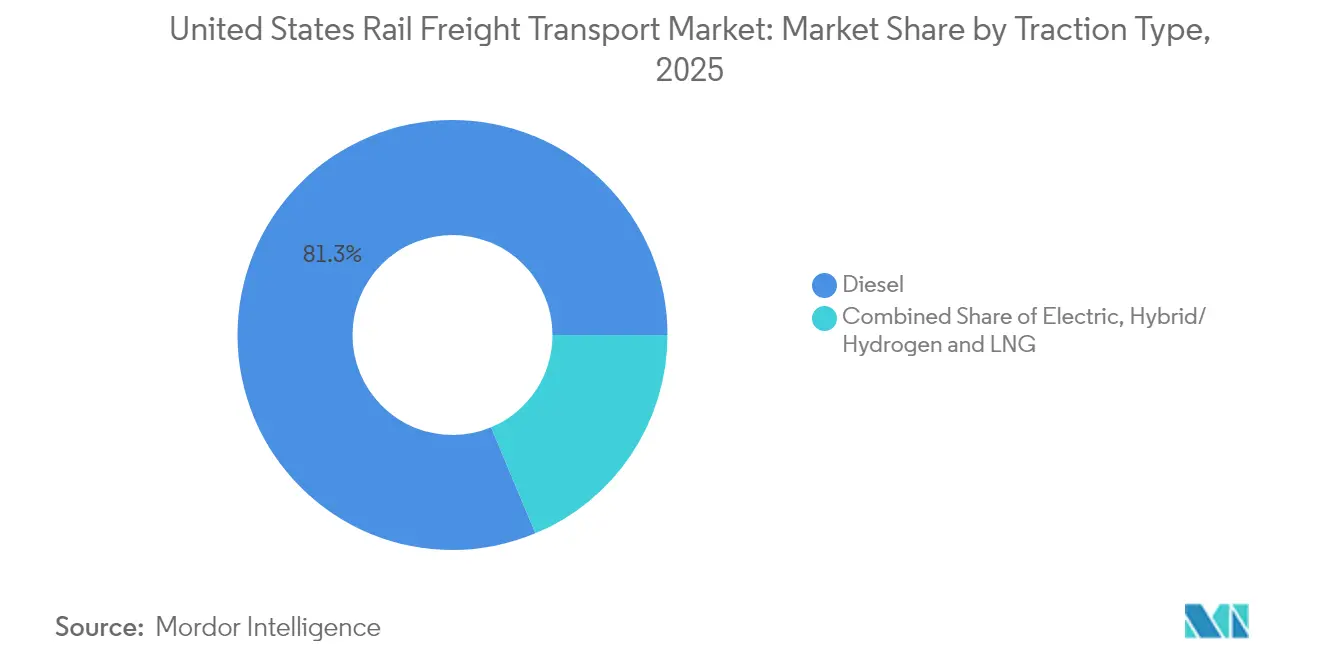
Diesel traction maintains an 81.30 % market share, but Hybrid / Hydrogen & LNG is projected to grow at a 10.05 % CAGR between 2026 and 2031. CSX’s prototype hydrogen locomotive, developed with CPKC, showcases the industry’s move toward lower-emission motive power.
Union Pacific’s battery-electric hybrid demonstrator targets up to 80 % fuel-efficiency gains in yard service. Early results suggest that hybridisation will scale first in switching roles before moving to mainline assignments, potentially stimulating domestic battery and hydrogen supply chains.
Destination: International Cross-border Growth Outpaces Domestic
Domestic movements represent 80.70 % of 2025 market size, yet cross-border traffic is forecast to expand at a 8.25 % CAGR through 2031. The CPKC network provides the only single-line rail service connecting Canada, the United States, and Mexico, trimming transit times and border delays.
A joint CPKC-CSX corridor linking Mexico, Texas, and the Southeast will add optionality for exporters and tighten service schedules. Growth in refrigerated agricultural exports and automotive near-shoring supports sustained international volume gains, implying that carriers will continue investing in customs-compliant gateways and temperature-controlled equipment.
Regulatory Landscape
The Surface Transportation Board (STB) regulates rail in the United States and has been refining rules around transparency and network access. On May 8, 2026, the STB issued a final rule terminating supplemental Positive Train Control (PTC) reporting for Class I carriers, with the change taking effect on June 7, 2026, and the regulator expanding performance data visualization tools in 2026 to improve visibility and accountability.
In January 2026, the STB opened Docket EP 788 to consider repealing 49 CFR part 1144 on reciprocal switching, targeting restored case-by-case discretion under statutory standards. By July 2026, the STB also mandated two additional weekly metrics, Original Estimated Time of Arrival (OETA) and Industry Spot and Pull (ISP), to strengthen service visibility.
Value Chain Analysis
The United States rail freight value chain spans freight generation, origin services, line-haul movement on Class I networks, and destination services such as intermodal lifts and drayage. Shippers and 3PLs increasingly contract bundled offerings that combine storage, switching, railcar and track maintenance coordination, and transloading to reduce handoffs across corridors.
Capacity and reliability are shaped by carriers' capital programs. BNSF reported a 2026 capital plan totaling USD 3.6 billion, including USD 2.8 billion for maintenance and USD 358 million for expansion and efficiency projects such as the Barstow International Gateway, a Phoenix-area intermodal facility, and yard expansions in Galesburg, Illinois and Winslow, Arizona. Some Class I carriers also indicated lower 2026 capex budgets versus 2025 after completing major capacity and fleet investments, reflecting a shift toward extracting throughput from existing assets.
Competitive Landscape
Seven Class I railroads account for 94 % of industry freight revenue, reflecting a consolidated structure backed by extensive track mileage. Recent mergers, notably Canadian Pacific and Kansas City Southern’s formation of CPKC, demonstrate carriers’ intent to secure contiguous networks that reduce interchange hand-offs and maximise asset turns. Canadian National’s 2025 purchase of Iowa Northern Railway further highlights targeted regional acquisitions as a cost-efficient growth vehicle.
Competition increasingly revolves around service reliability and digital transparency rather than price alone. Railroads with robust customer portals that provide real-time tracing are winning discretionary freight, particularly in short-haul lanes where trucking remains a viable option. PSR-driven cost advantages endow incumbents with pricing power, yet any lapse in on-time performance can trigger rapid mode shifts, motivating carriers to reinvest in yards and crews.
Technological differentiation is a rising competitive lever. Operators equipping wagons with smart sensors for predictive maintenance report higher asset availability, which they market as a guarantee to shippers demanding tight delivery windows. Alternative traction pilots—hydrogen, battery electric, blended LNG—offer shippers measurable Scope 3 emissions reductions, potentially influencing modal choices for carbon-conscious cargo owners. Smaller regionals and short lines respond by specialising in first- and last-mile services that feed into Class I networks, creating a collaborative ecosystem where technology and service complement geography.
United States Rail Freight Transport Industry Leaders
Union Pacific Railroad
BNSF Railway
CSX Transportation
Norfolk Southern Railway
Canadian Pacific Kansas City
- *Disclaimer: Major Players sorted in no particular order

Market Opportunities and Future Outlook
Intermodal continues to lead as a growth driver, with terminal expansion and efficiency projects broadening the lanes where rail competes with trucking. Intermodal accounted for 47.20% of the 2025 market, and carriers are adding ramp capacity, yards, and transload capabilities to improve fluidity and reliability for time-sensitive shipments.
Gulf Coast petrochemical output growth and the Sea Port Oil Terminal at Freeport, Texas, approved by the Maritime Administration, expand origin-destination options for chemicals and energy inputs. Cross-border grain movements via the Canada-US corridor also keep building through the Canada Pacific Kansas City network. The STB's 2026 push for expanded weekly service metrics increases the transparency shippers can use when selecting rail for time-sensitive supply chains, while IIJA-funded corridor upgrades expand capacity across key routes.
Recent Industry Developments
- July 2026: Union Pacific and Norfolk Southern submitted the first portion of responses to the STB's May 28, 2026 request for additional information regarding the merger, addressing Terminal Railroad Association of St. Louis, Kansas City Terminal Railway, and TTX Company. This regulatory activity increases scrutiny and information requirements, which can shape the merger process and affect intermodal network implications and pricing power.
- May 2026: Union Pacific and Norfolk Southern saw the STB accept the revised merger application for consideration while holding proceedings in abeyance pending further supplemental information. The milestone indicates a possible path toward transcontinental consolidation, with implications for shippers and rivals through service options and competitive dynamics.
- April 2026: Union Pacific and Norfolk Southern submitted a revised primary application to the Surface Transportation Board for the 85 billion acquisition and control of Norfolk Southern. The filing sets up a potential market-wide realignment, with expectations of capacity and pricing changes affecting both intermodal and long-haul freight.


Research Methodology Framework and Report Scope
Market Definition and Coverage
This market covers the value of rail freight transport services within the United States, measured as revenues earned from moving freight by rail across domestic and cross-border flows that touch the country.
Scope exclusions: We exclude passenger rail services and non-rail freight modes, and we do not treat non-transport logistics like warehousing as rail freight transport revenue.
Segmentation Overview
- By Cargo Type
- Containerised / Intermodal
- Dry Bulk (Coal, Ores, Grains)
- Liquid Bulk (Crude, Chemicals)
- Break-bulk & Project Cargo
- By Service Type
- Transportation
- Services Allied to Transportation (Maintenance of Railcars and Rail Tracks, Switching of Cargo, and Storage)
- By End-user Industry
- Mining & Minerals
- Oil, Gas & Chemicals
- Agriculture & Food
- Manufacturing & Automotive
- Retail & FMCG
- Construction Materials & Others
- By Traction Type
- Diesel
- Electric
- Hybrid / Hydrogen & LNG
- By Destination
- Domestic
- International / Cross-border
Data Sources, Market Sizing, and Validation
Desk Research
Desk research helped us map the industry boundaries and build reliable starting assumptions before the model was finalized. We used public datasets and official references such as the Bureau of Transportation Statistics, the Federal Railroad Administration, the Surface Transportation Board, and the U.S. Census Bureau trade data to understand freight movement, safety and operating indicators, and cross-border activity.
To translate activity into market value, we also reviewed company filings, investor presentations, and published rail performance summaries, which helped validate the service mix and revenue drivers like how fuel surcharges are treated. Where needed, paid subscriptions for company financials and news intelligence were used to keep corporate-level revenue and event timelines consistent, and an import/export shipment-level database was used selectively to sanity-check trade-linked freight signals. The desk sources listed above are illustrative, and many other public and paid references were also reviewed for data collection, validation, and clarification.
Primary Interviews and Surveys
Primary work was used to pressure-test the desk assumptions and to fill gaps on pricing behavior, service definitions, and near-term volume expectations. We spoke with a mix of rail operators, shippers, freight forwarders, and industry experts across major U.S. corridors. Feedback helped us align variables like intermodal share shifts, commodity mix, and fuel surcharge pass-through with what is happening on the ground.
Distribution of primary research fieldwork respondents
| Company type | Respondent position |
|---|---|
| Top tier: 27% | CXOs: 16% |
| Mid tier: 53% | Functional/Unit leaders: 36% |
| Smaller Players: 20% | Managers: 48% |
Market-Sizing & Forecasting
The core sizing logic uses top-down reconstruction, where rail activity and trade indicators are translated into revenue pools and then adjusted by service mix assumptions for the United States market. That total is then corroborated with selective bottom-up checks, such as sampled carrier revenue splits, corridor-level channel checks, and simple price-per-unit times volume approximations to confirm that the totals stay realistic.
Key inputs used in the model include intermodal versus bulk mix, carloads and ton-miles trend direction, cross-border share of volumes, fuel price movements that shape surcharge behavior, and changes in industrial output that influence coal, grains, and chemicals flows. When a data series is incomplete for a sub-slice, we fill gaps using proxy indicators that are stable over time, then re-test the implied shares with interview feedback.
For forecasting, scenario analysis is used so that volume growth, pricing, and surcharge dynamics can be flexed in a clear way for base, conservative, and faster-recovery cases. Final year-by-year values are produced only after assumptions are aligned with what operators and large shipper groups expect for demand, network capacity, and service reliability.
Data Validation & Update Cycle
Outputs are validated through multiple checks so that unusual jumps in value do not pass through without an explanation. We compare the implied revenue per unit movement with independent operating signals, then review any variances that appear inconsistent with fuel trends, industrial activity, or reported service levels.
Before sign-off, the model is reviewed in steps by another analyst, and callbacks are triggered when a key assumption changes or when stakeholder feedback conflicts with desk indicators. Reports are refreshed annually, with interim updates when material events occur, and a final pre-delivery review is completed so the latest public data and developments are reflected.
Mordor Intelligence's United States Rail Freight Transport Market Sizing Compared With Other Published Estimates
Published estimates for U.S. rail freight transport often differ because the service scope is not always defined the same way, and the treatment of add-on charges can shift revenue totals materially. Timing also matters, because base year selection and the latest updates to fuel and volume trends can change what gets counted in a given year.
The main gap comes from whether allied-to-transportation services and fuel surcharge revenues are included consistently. In this area, Mordor Intelligence counts rail transportation and closely linked rail service revenues while keeping non-transport logistics out of scope, and it refreshes the surcharge assumptions with recent operating conditions. Differences can also come from mixing passenger and freight rail in one number, using nominal revenue without normalizing for one-off pricing, or applying aggressive volume recovery assumptions without corridor-level checks.
Benchmark comparison
| Source | Market Size | Gaps in Research Methodology |
|---|---|---|
| Mordor Intelligence | USD 71.77 B (2025) | |
| Industry Database A | USD 97.20 B (2026) | Uses a broader rail transportation revenue bucket that can blend freight and passenger-linked services, which tends to lift the reported value versus a freight-only scope. |
| Market Publisher B | USD 72.00 B (2024) | Anchors the size to a different base year and relies on a simpler historical roll-forward, which can understate shifts in fuel surcharge pass-through and intermodal mix. |
The table shows that the spread is mostly explained by what is included in the revenue definition and how quickly pricing and surcharge assumptions are refreshed. By tying the value build-up to observable freight activity signals and then re-checking totals through interviews, the estimate stays traceable to clear steps that a reader can follow and replicate.


Key Questions Answered in the Report
What is the current United States rail freight transport market size?
The market size is USD 74.17 billion in 2026.
How fast is the market expected to grow through 2031?
It is forecast to expand at a 3.34 % CAGR from 2026 to 2031.
Which cargo type commands the largest market share?
Intermodal containers lead with a 47.20 % share of total rail freight volumes.
How will the Infrastructure Investment and Jobs Act affect rail freight?
IIJA grants are funding track upgrades, grade separations, and siding extensions that will increase capacity and enhance reliability across national corridors.
Which end-user industry is projected to grow fastest?
Retail & Fast-Moving Consumer Goods is expected to register the highest CAGR through 2030 due to e-commerce-driven demand.
What technologies are Class I railroads adopting to cut emissions?
Carriers are piloting hydrogen-fuel locomotives, battery-electric hybrids, and LNG-capable engines to reduce greenhouse-gas output and improve fuel efficiency.
Page last updated on:


 Your data is secure and never sold or shared.


