Computer Vision In Healthcare Market Size and Share
Market Overview
| Study Period | 2019 - 2030 |
|---|---|
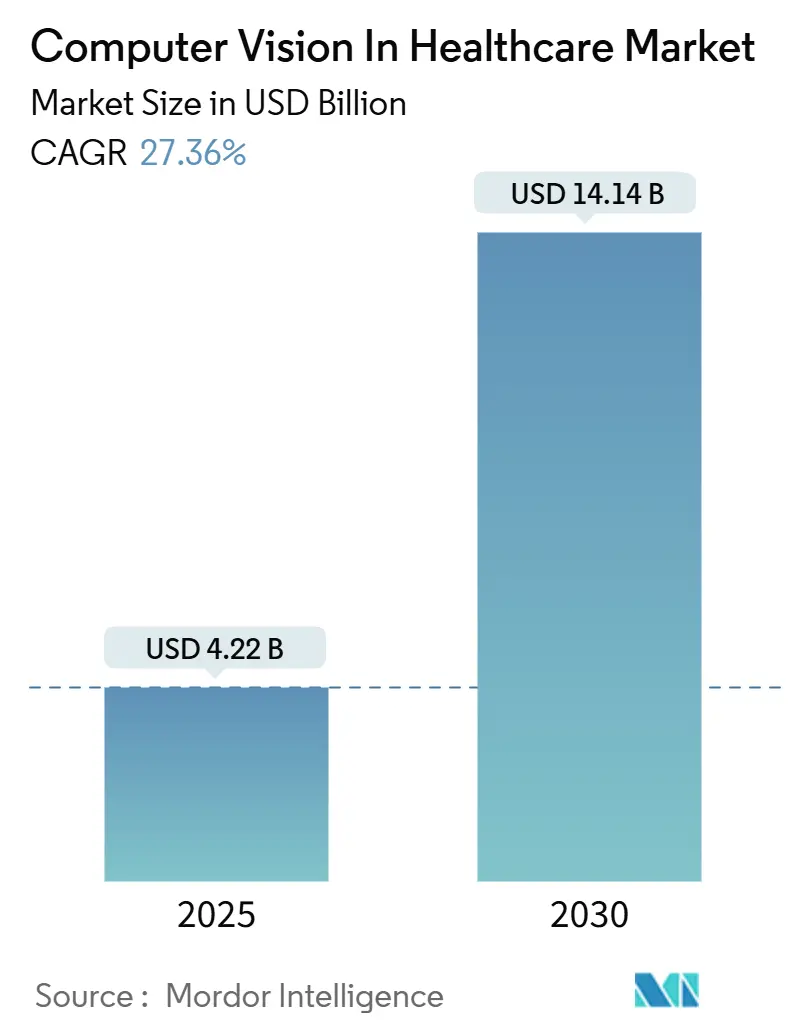
| Market Size (2025) | USD 4.22 Billion |
| Market Size (2030) | USD 14.14 Billion |
| Growth Rate (2025 - 2030) | 27.36% CAGR |
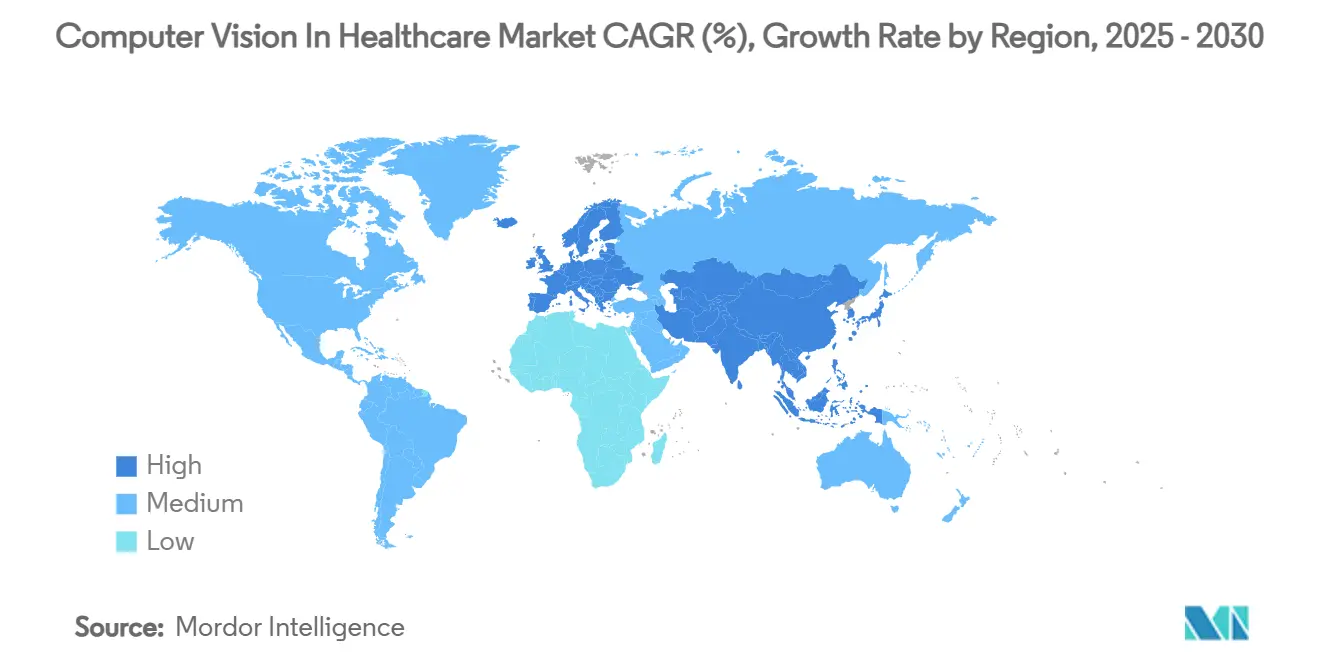
| Fastest Growing Market | Asia Pacific |
| Largest Market | North America |
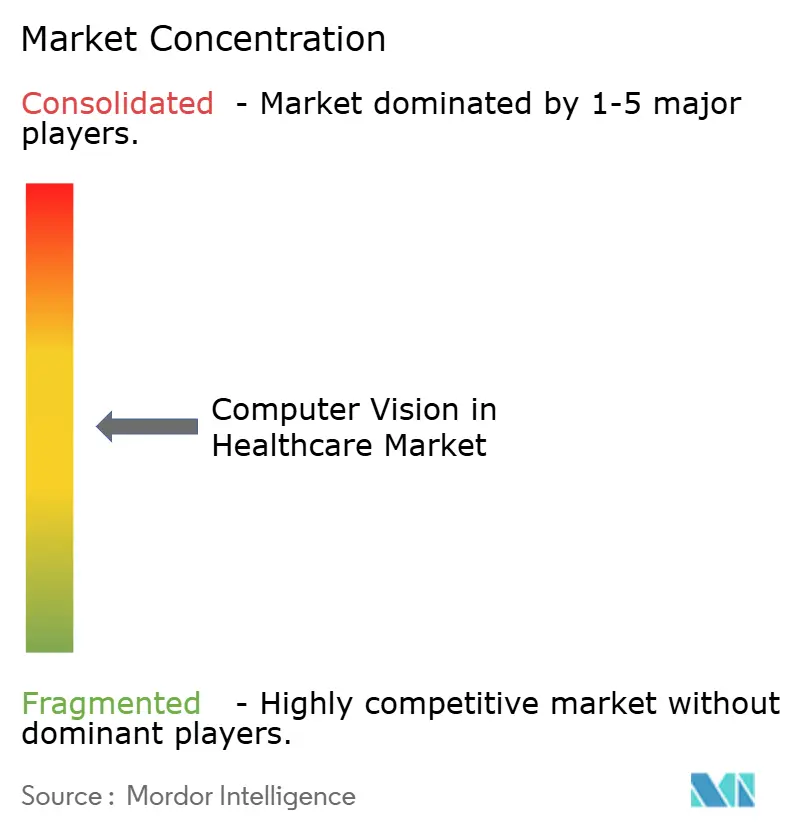
| Market Concentration | Medium |
Major Players *Disclaimer: Major Players sorted in no particular order Image © Mordor Intelligence. Reuse requires attribution under CC BY 4.0. | |
Computer Vision In Healthcare Market Analysis by Mordor Intelligence
The Computer Vision In Healthcare Market size is estimated at USD 4.22 billion in 2025, and is expected to reach USD 14.14 billion by 2030, at a CAGR of 27.36% during the forecast period (2025-2030).
Momentum springs from edge-AI chips that cut surgical-suite latency below 100 milliseconds, relentless growth in chronic-disease imaging demand, and structured workflow automation that offsets radiologist shortages. Regulatory clarity also accelerates adoption: the FDA now classifies radiological computer-assisted detection software as Class II, and more than 1,000 clinical AI applications—758 focused on radiology—carry U.S. clearance. Software still delivers the largest revenue slice, yet service-oriented contracts outpace all other components as hospitals pivot toward continuous optimisation. Medical imaging and diagnostics dominate use cases, while “dark labs” propel pathology automation. North America leads on early reimbursement decisions, but Asia-Pacific supplies the fastest expansion, powered by China’s AI ecosystem and 600-plus regional health-tech start-ups.
Key Report Takeaways
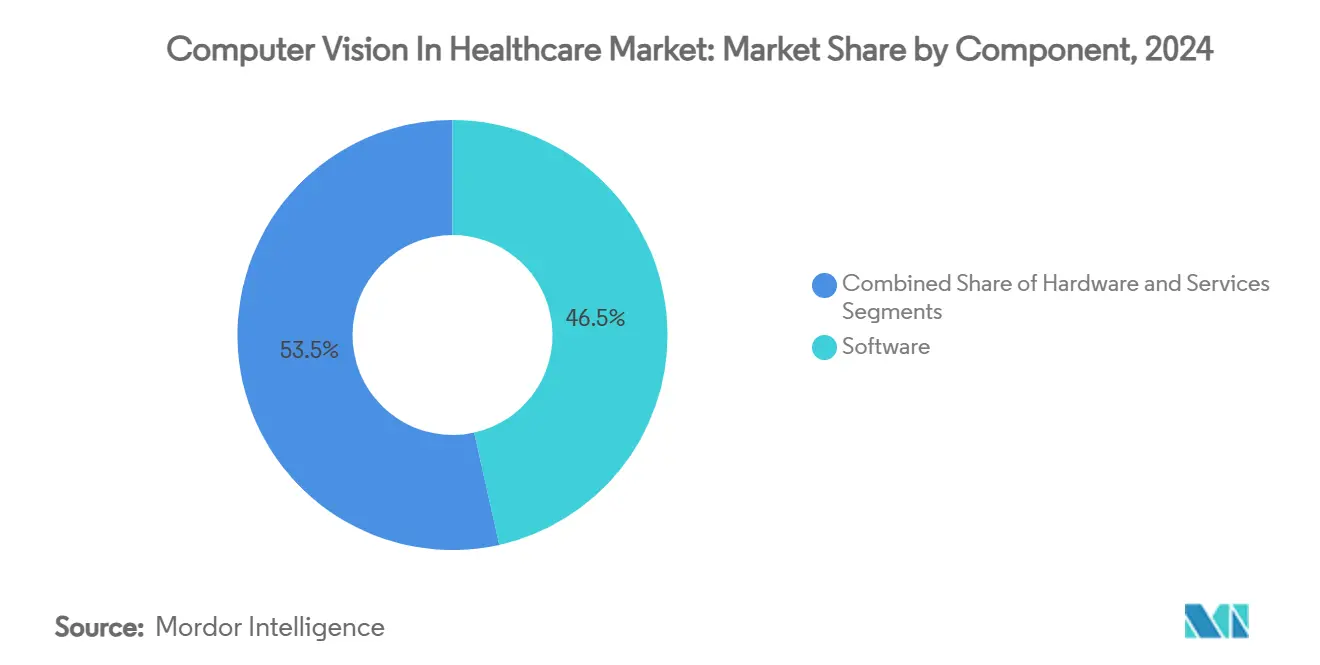
- By component, software held 46.52% of the computer vision in healthcare market share in 2024; services are forecast to scale at a 30.34% CAGR through 2030.
- Medical imaging and diagnostics captured 59.88% of the computer vision in healthcare market share in 2024, whereas pathology and laboratory automation is projected to expand at 31.44% CAGR by 2030.
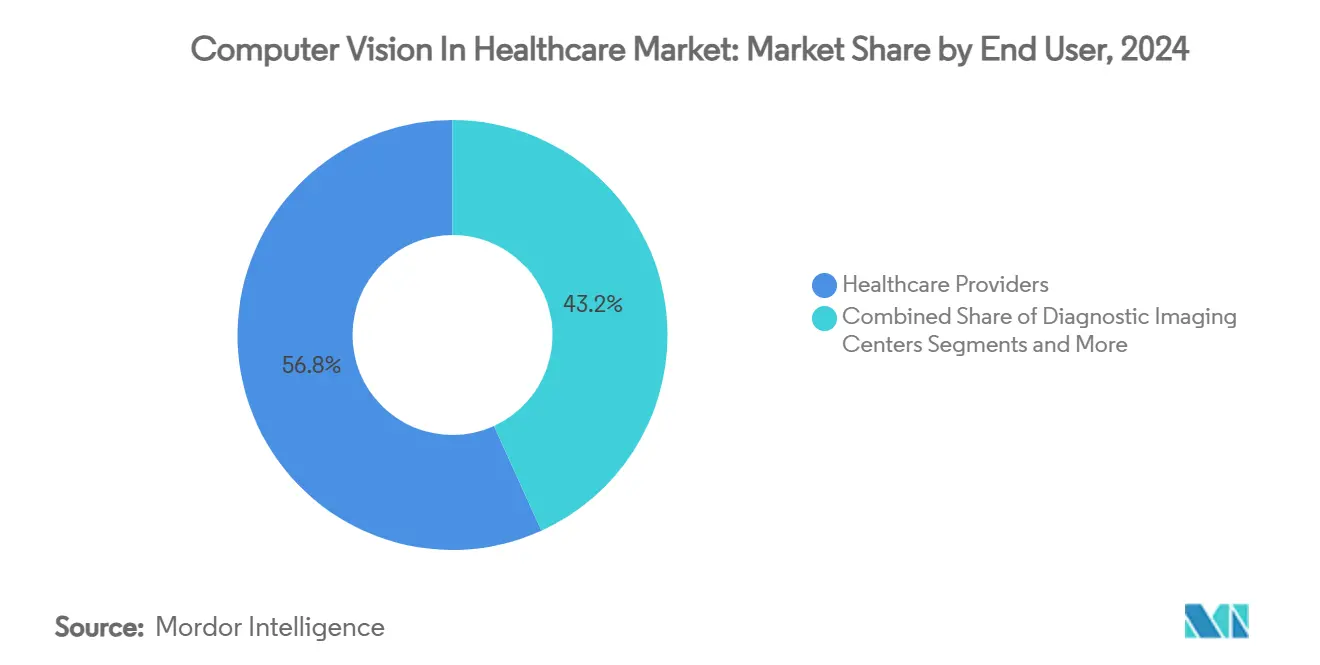
- Healthcare providers commanded 56.79% share of the computer vision in healthcare market size in 2024, while diagnostic imaging centres are set to post the quickest 29.58% CAGR to 2030.
- On-premise deployments controlled 61.23% share in 2024; however, edge and hybrid roll-outs are projected to climb at a 31.81% CAGR through 2030.
- North America contributed 37.44% revenue share in 2024, but Asia-Pacific is anticipated to advance at a 29.63% CAGR across the outlook period.
Global Computer Vision In Healthcare Market Trends and Insights
Drivers Impact Analysis*
| Driver | (~) % Impact on CAGR Forecast | Geographic Relevance | Impact Timeline |
|---|---|---|---|
| Exploding Chronic-Disease Imaging Demand | + 6.5% | Global, with concentration in North America & Europe | Medium term (2-4 years) |
| Rapid Adoption Of AI-Enabled Imaging Modalities | + 4.8% | Global, led by North America, expanding to APAC | Short term (≤ 2 years) |
| Radiologist Shortage & Workflow Automation Needs | + 3.2% | Global, acute in UK, US, and developed markets | Long term (≥ 4 years) |
| Government Reimbursement Shift Toward Early Diagnosis | + 2.1% | North America & EU, emerging in APAC | Medium term (2-4 years) |
| Edge-AI Chips Enabling Sub-100 Ms OR Vision Latency | + 1.9% | Global, early adoption in advanced healthcare systems | Short term (≤ 2 years) |
| OR-Turnover & Bed-Capacity KPIs Driving Hospital CV Roll-Outs | + 1.2% | North America & EU, expanding globally | Medium term (2-4 years) |
| Source: Mordor Intelligence | |||
Exploding Chronic-Disease Imaging Demand
Health services worldwide confront unprecedented imaging queues as long-term conditions proliferate. In the UK radiologist staffing lags by 30%, and U.S. projections warn of up to 124,000 physician shortfalls by 2034. Automated screening tools now read mammograms in milliseconds with accuracy rivalling specialists, a vital capability when delayed diagnoses drain USD 100 billion from U.S. budgets every year. Forty-three percent of health-care leaders already deploy AI for in-hospital monitoring, and 85% expect fresh generative-AI outlays in the next budgeting cycle.
Rapid Adoption of AI-Enabled Imaging Modalities
Device makers bake inference engines straight into scanners, up-ending procurement models. GE Healthcare and NVIDIA co-develop autonomous X-ray units that move compute to the edge, removing network lag. Canon’s Adora DRFi hybrid suite earned FDA clearance in March 2025, a signal that next-generation imaging now ships with embedded intelligence by default, driving growth in the Computer Vision in Healthcare Market.
Radiologist Shortage & Workflow Automation Needs
Forty-percent vacancy rates in some markets oblige hospitals to triage images automatically. Digital pathology models such as UNI and CONCH multiply slide-reading throughput ten-fold while sustaining diagnostic rigor. FDA-cleared triage software prioritises urgent scans, raising per-modality utilisation by up to 40% further reinforcing adoption in the Computer Vision in Healthcare Market.[2]U.S. Government, “21 CFR 892.2080—Radiological Computer-Aided Triage and Notification Software,” eCFR, ecfr.gov
Government Reimbursement Shift Toward Early Diagnosis
The U.S. Centers for Medicare & Medicaid Services began covering AI-based quantitative coronary plaque analysis in 2025, turning once-experimental tools into billable services.[3]Centers for Medicare & Medicaid Services Staff, “Artificial Intelligence Enabled CT-Based Quantitative Coronary Topography (AI-QCT)/Coronary Plaque Analysis (AI-CPA) (DL39851),” Centers for Medicare & Medicaid Services, cms.gov Concurrently, AMA CPT codes for Caristo’s AI stratification solution give providers a clear path to reimbursement.
Restraints Impact Analysis*
| Restraint | (~) % Impact on CAGR Forecast | Geographic Relevance | Impact Timeline |
|---|---|---|---|
| Data-Privacy & Cybersecurity Concerns | -2.8% | Global, particularly stringent in EU and North America | Long term (≥ 4 years) |
| High Upfront Integration & CAPEX | -1.5% | Global, more pronounced in emerging markets | Medium term (2-4 years) |
| Annotated Video-Dataset Bottleneck For Model Training | -1.2% | Global, acute in specialized applications | Medium term (2-4 years) |
| Regulatory Grey-Zones For Autonomous Intra-Operative CV | -0.9% | Global, varying by jurisdiction | Long term (≥ 4 years) |
| Source: Mordor Intelligence | |||
Data-Privacy & Cybersecurity Concerns
Health-care remains the costliest sector for breaches at USD 10.9 million per incident, and 58% of providers still lack AI governance frameworks. A 2024 FDA warning to Exer Labs illustrates the compliance minefield awaiting vendors that shortcut controls.
High Upfront Integration & CAPEX
Hospital-wide roll-outs can top USD 10 million once network, training, and workflow redesign costs accrue. Integration stretches 18-24 months, straining rural facilities that most need AI assistance yet possess limited capital reserves.
*Our forecasts treat driver/restraint impacts as directional, not additive. The impact forecasts reflect baseline growth, mix effects, and variable interactions.
Segment Analysis
By Component: Services Propel Growth Beyond Software Dominance
Services surged at a 30.34% CAGR, eclipsing pure-play software even as software retained 46.52% of 2024 revenue in the computer vision in healthcare market. Health systems lean on third-party experts for training, workflow re-design, and continuous algorithm tuning—tasks that internal IT teams struggle to absorb. Hardware remains the smallest slice but climbs steadily, driven by edge accelerators required for real-time theatre guidance.
Ongoing optimisation needs explain why hospitals shift budgets toward service contracts that guarantee performance updates, documentation, and regulatory tracking. This evolution signals the computer vision in healthcare industry is maturing: differentiation now sits in seamless implementation rather than code alone.


By Application: Pathology Automation Overtakes Imaging Momentum
Medical imaging commanded 59.8 8% of the 2024 computer vision in healthcare market share, yet pathology and laboratory automation is set to post a 31.44% CAGR. Fully automated “dark labs” process thousands of slides daily, cutting turnaround from days to hours and freeing pathologists for complex cases.
Image-guided surgery, robotic assistance, and ICU patient-safety suites also expand but at gentler clips. The application mix shows computer vision in healthcare market scope widening from diagnostic support toward holistic hospital operations—monitoring flow, automating logistics, and supporting peri-operative decision-making.
By End User: Diagnostic Centers Accelerate Ahead of Providers
Hospitals still contribute 56.79% of spending, yet stand-alone imaging centres clock a market-leading 29.58% CAGR. Their flatter governance lets them deploy AI swiftly, as evidenced by RadNet’s USD 103 million iCAD acquisition spree. Academic institutes remain steady co-developers, while pharma outfits increasingly exploit visual AI for high-throughput screening in the Computer Vision in Healthcare Market.
Diagnostic chains such as SimonMed earmarked USD 40 million for breast-AI roll-outs, banking on faster reads and differentiated service. These moves illustrate how niche providers leverage the computer vision in healthcare market to out-innovate larger hospital networks.
By Deployment Mode: Edge Computing Reshapes Architecture
On-premise installations represented 61.23% of the 2024 computer vision in healthcare market revenue, yet edge-hybrid approaches race ahead at 31.81% CAGR. Edge nodes meet sub-second latency while containing data inside the firewall, a decisive benefit where HIPAA or GDPR penalties loom. Cloud retains relevance for population analytics but cedes real-time use cases to local silicon.
As surgical robots, ICU monitors, and command centres pivot to embedded inference, demand for dedicated healthcare AI chips climbs. That hardware pull boosts ancillary services—device calibration, firmware security audits, and life-cycle support—further expanding the computer vision in healthcare market.
Geography Analysis
North America generated 37.44% of 2024 turnover for the computer vision in healthcare market. FDA class-II pathways, early CPT codes, and payer coverage for AI coronary analysis encourage rapid health-system uptake. Tech giants anchor collaborative hubs with Mass General Brigham and UW Health, while Canada and Mexico ride parallel digitisation mandates. Implementation drag persists, however, as full-site installs often exceed USD 10 million and invite heightened cyber-risk audits.
Asia-Pacific is projected to climb at a 29.63% CAGR, the fastest of any region. China fields more than 150 medical-AI suppliers and sees hospital procurement bolstered by domestic reimbursement pilots. Japan pioneers focused-ultrasound oncology married to AI diagnostics, and South Ko rea’s medical-AI uptake grows 50.8% annually. India’s national digitisation strategy and Australia’s translational-medicine grants add depth, making the computer vision in healthcare market a central plank in regional health modernisation.
Europe moves steadily thanks to GDPR-aligned frameworks and multi-country projects like the EUR 28 million Thera4Care imaging consortium. Breast-cancer screening networks such as Affidea layer AI across clinics to homogenise read quality. In the Middle East & Africa, Saudi Arabia’s Vision 2030 drives AI adoption, while Uganda pilots ultrasound AI for remote maternity wards. Medical-tourism investments and cross-border data standards nudge the Computer Vision in Healthcare Market region toward meaningful scale, although funding constraints cap rollout velocity.

Competitive Landscape
The computer vision in healthcare market exhibits moderate concentration. Siemens Healthineers and GE Healthcare pair scanners with native AI, locking in long-term service revenue. NVIDIA unveiled 25 health micro-services, from MolMIM to VISTA 3D, framing itself as a neutral compute backbone for ISVs. Microsoft courts providers through Azure-hosted model libraries, easing regulatory documentation.
Specialists carve niches: Rad AI secured USD 60 million Series B at a USD 525 million valuation, focusing on automated radiology reporting [Radai.com]. AZmed raised USD 16.2 million to fast-track fracture detection. Acquisition deal-flow remains brisk as incumbents shop for algorithm portfolios and clinician relationships. Real-world evidence and seamless clinical integration are emerging as the true differentiators, superseding raw algorithm benchmarks.
Computer Vision In Healthcare Industry Leaders
NVIDIA Corporation
Intel Corporation
Microsoft Corporation
IBM Corporation
Siemens Healthineers
- *Disclaimer: Major Players sorted in no particular order

Recent Industry Developments
- July 2025: Carlsmed filed for an IPO of 6.7 million shares priced at USD 14-16, aiming to expand its AI-driven spinal-fusion platform to cervical procedures in 2026.
- June 2025: The FDA formally placed radiological CAD and CADx software in Class II, trimming approval times for hundreds of AI imaging tools.
- April 2025: AMA authorised CPT codes covering Caristo’s AI-enabled heart-disease risk tool, paving a billing pathway for vision-based diagnostics.
- March 2025: Canon Medical won FDA clearance for Adora DRFi, an AI-ready radiography-fluoroscopy hybrid that integrates full-stack clinical imaging functions.


Global Computer Vision In Healthcare Market Report Scope
| Hardware |
| Software |
| Services |
| Medical Imaging & Diagnostics |
| Image-Guided Surgeries & Robotics |
| Patient Monitoring & Safety |
| Pathology & Laboratory Automation |
| Smart Hospitals & Operations Optimisation |
| Healthcare Providers |
| Diagnostic Imaging Centers |
| Research & Academic Institutions |
| Other End Users |
| On-Premise |
| Cloud-Based |
| Edge / Hybrid |
| North America | United States |
| Canada | |
| Mexico | |
| Europe | Germany |
| United Kingdom | |
| France | |
| Italy | |
| Spain | |
| Rest of Europe | |
| Asia-Pacific | China |
| Japan | |
| India | |
| Australia | |
| South Korea | |
| Rest of Asia-Pacific | |
| Middle East and Africa | GCC |
| South Africa | |
| Rest of Middle East and Africa | |
| South America | Brazil |
| Argentina | |
| Rest of South America |
| By Component | Hardware | |
| Software | ||
| Services | ||
| By Application | Medical Imaging & Diagnostics | |
| Image-Guided Surgeries & Robotics | ||
| Patient Monitoring & Safety | ||
| Pathology & Laboratory Automation | ||
| Smart Hospitals & Operations Optimisation | ||
| By End User | Healthcare Providers | |
| Diagnostic Imaging Centers | ||
| Research & Academic Institutions | ||
| Other End Users | ||
| By Deployment Mode | On-Premise | |
| Cloud-Based | ||
| Edge / Hybrid | ||
| By Geography | North America | United States |
| Canada | ||
| Mexico | ||
| Europe | Germany | |
| United Kingdom | ||
| France | ||
| Italy | ||
| Spain | ||
| Rest of Europe | ||
| Asia-Pacific | China | |
| Japan | ||
| India | ||
| Australia | ||
| South Korea | ||
| Rest of Asia-Pacific | ||
| Middle East and Africa | GCC | |
| South Africa | ||
| Rest of Middle East and Africa | ||
| South America | Brazil | |
| Argentina | ||
| Rest of South America | ||


Key Questions Answered in the Report
1. What is the current value of the computer vision in healthcare market?
The market stands at USD 4.22 billion in 2025 and is projected to hit USD 14.14 billion by 2030.
2. How fast is the computer vision in healthcare market growing?
It is expanding at a 27.36% CAGR over 2025-2030, the highest among mainstream digital-health segments.
3. Which component segment is growing the quickest?
Services, advancing at a 30.34% CAGR, outpaces both software and hardware.
4. Which application is set to disrupt imaging’s dominance?
Pathology and laboratory automation, forecast to grow at 31.44% CAGR through 2030.
5. Why are diagnostic imaging centers adopting AI faster than hospitals?
Lean governance allows quicker implementation; some chains already invest tens of millions in AI to enhance throughput and accuracy.
6. Which region is the fastest-growing market?
Asia-Pacific, expected to post a 29.63% CAGR thanks to China’s large AI ecosystem and supportive regional policies.
Page last updated on:


