Digital Pathology Market Size and Share
Market Overview
| Study Period | 2020 - 2031 |
|---|---|
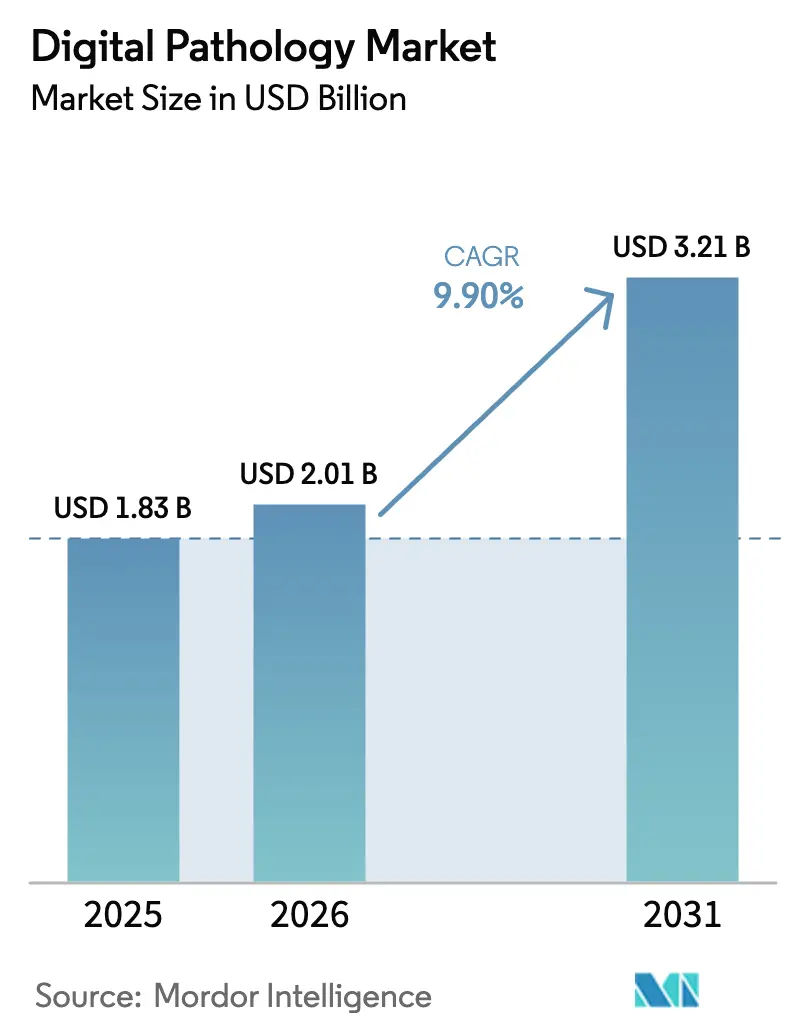
| Market Size (2026) | USD 2.01 Billion |
| Market Size (2031) | USD 3.21 Billion |
| Growth Rate (2026 - 2031) | 9.90% CAGR |
| Fastest Growing Market | Asia-Pacific |
| Largest Market | North America |
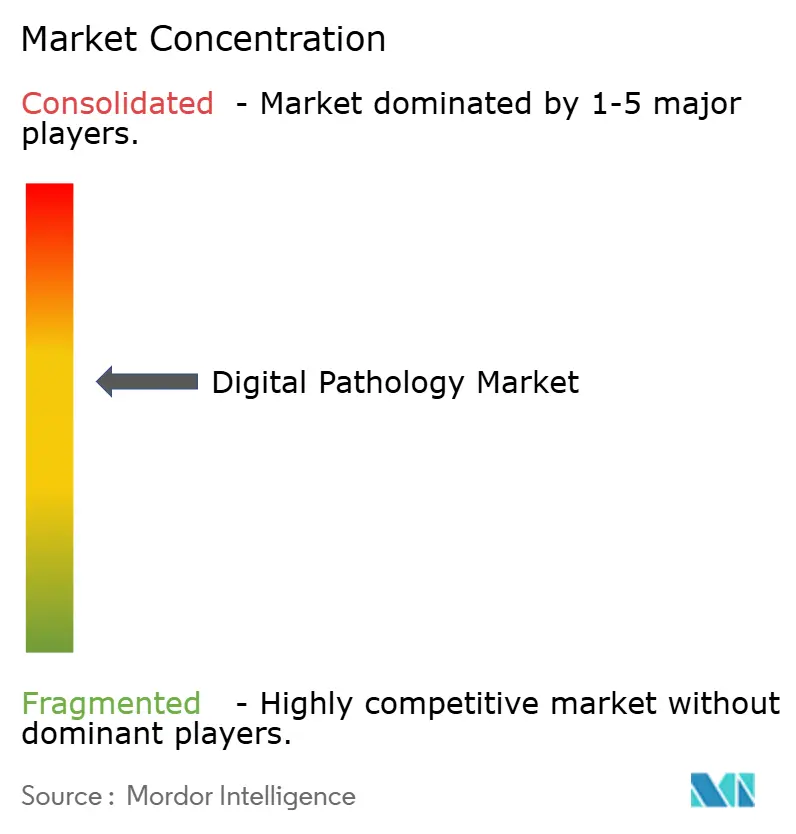
| Market Concentration | Medium |
Major Players *Disclaimer: Major Players sorted in no particular order Image © Mordor Intelligence. Reuse requires attribution under CC BY 4.0. | |
Digital Pathology Market Analysis by Mordor Intelligence
The Digital Pathology Market size is expected to increase from USD 1.83 billion in 2025 to USD 2.01 billion in 2026 and reach USD 3.21 billion by 2031, growing at a CAGR of 9.90% over 2026-2031.
Hospitals are digitizing slides to alleviate acute pathologist shortages, pharmaceutical sponsors are demanding image-based biomarker endpoints, and regulators have cleared multiple whole-slide imaging (WSI) platforms for primary diagnosis, closing historic compliance gaps [1]U.S. Food and Drug Administration, “Device Approvals,” fda.gov. Commercial momentum accelerated after the National Institutes of Health’s Bridge2AI program allotted USD 150 million in 2025 to validate pathology algorithms, while new CPT reimbursement codes began compensating remote consultations. At the same time, spatial-omics workflows that fuse morphology with proteomic or transcriptomic data are expanding scanner budgets beyond traditional brightfield devices. Scanner vendors now bundle software subscriptions instead of one-time hardware sales, shifting revenue to recurring models that laboratories find easier to justify within operating budgets.
Key Report Takeaways
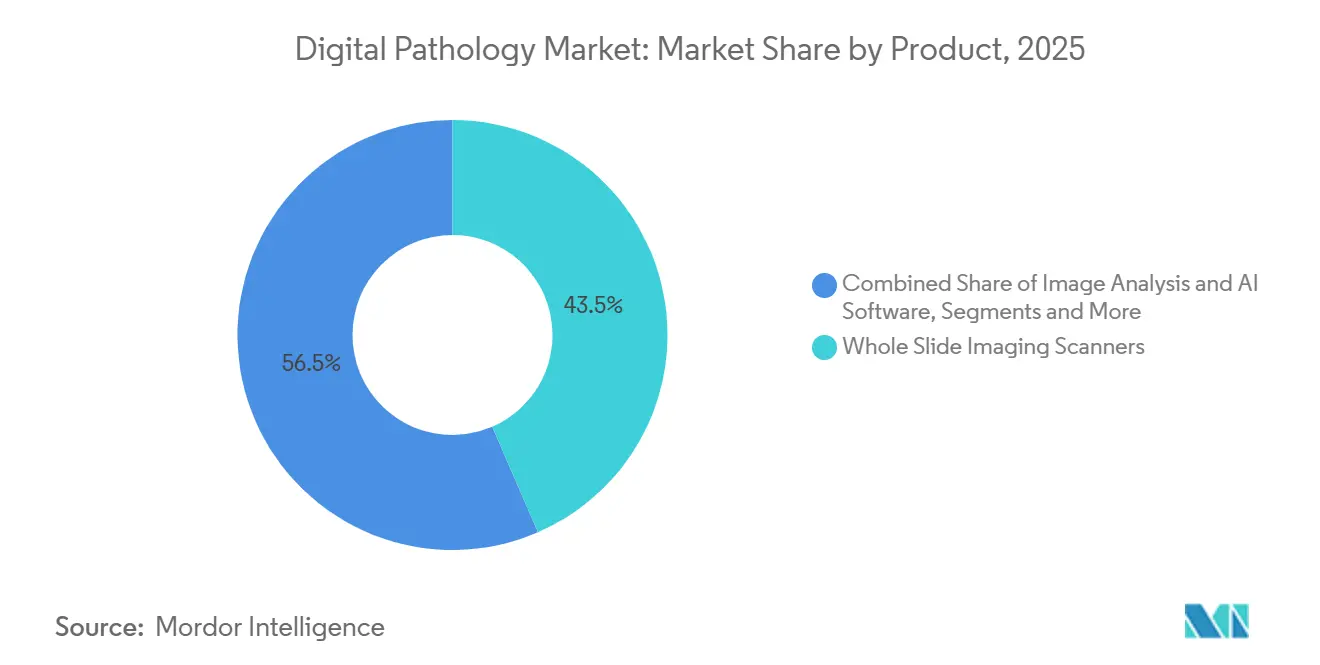
- By product, Whole Slide Imaging Scanners held 43.5% of the digital pathology market share in 2025, while Image Analysis & AI Software is forecast to grow at a 10.21% CAGR through 2031.
- By imaging technique, Brightfield accounted for an 85.1% share of the digital pathology market size in 2025, whereas Fluorescence imaging is advancing at a 10.55% CAGR.
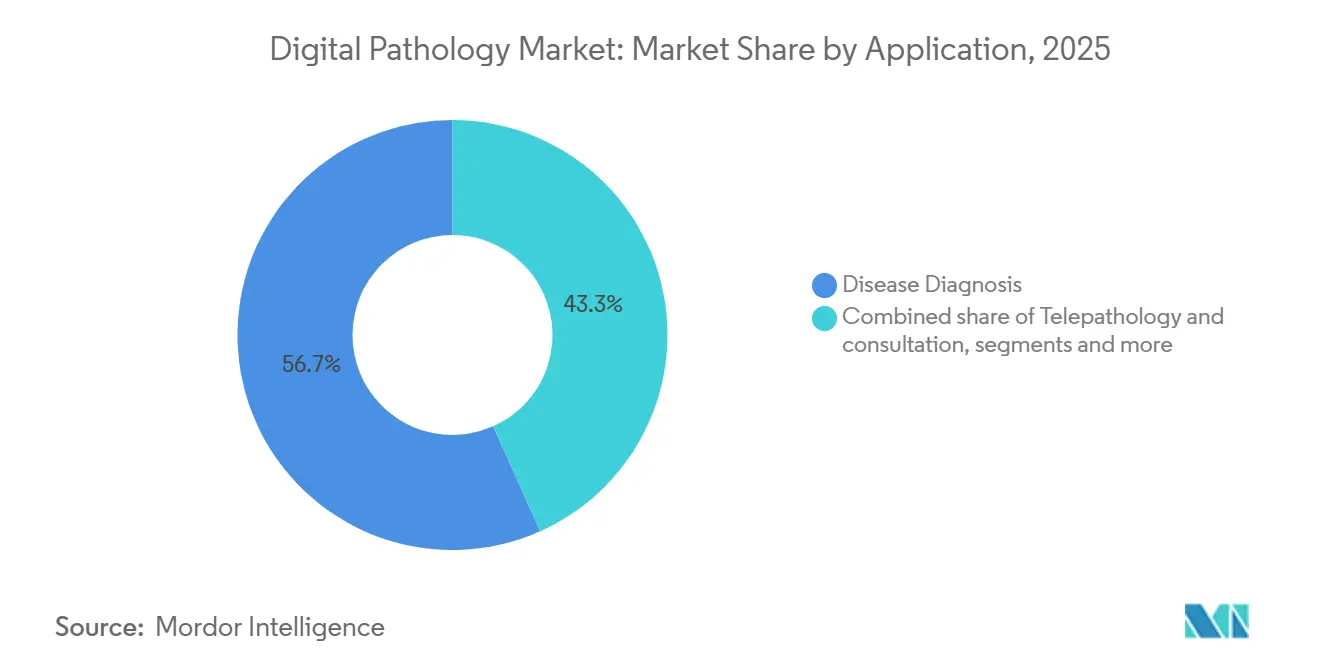
- By application, Disease Diagnosis captured 56.7% revenue share in 2025; Telepathology & Consultation is projected to expand at a 10.39% CAGR to 2031.
- By end user, Hospital & Reference Laboratories led with 38.4% of the digital pathology market share in 2025, while Pharmaceutical & Biotechnology Companies & CROs are growing at a 10.47% CAGR.
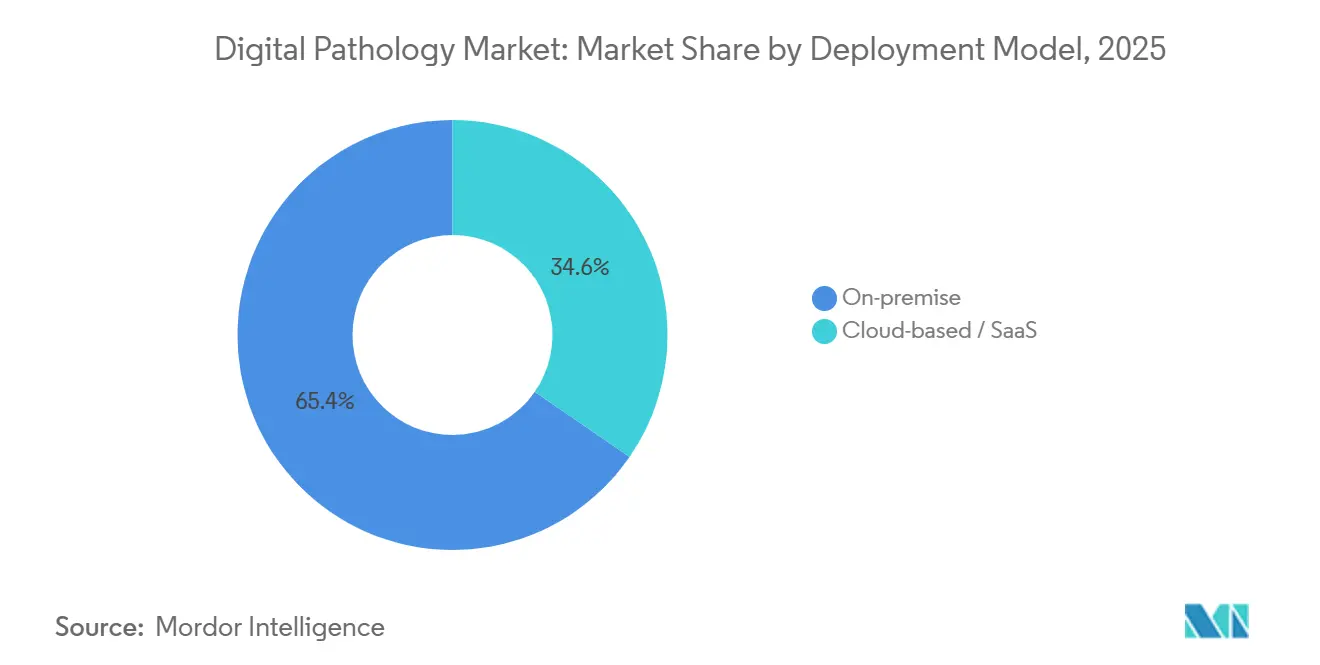
- By deployment model, On-premise installations represented 65.4% of 2025 spending, yet Cloud-based solutions are increasing at a 10.16% CAGR.
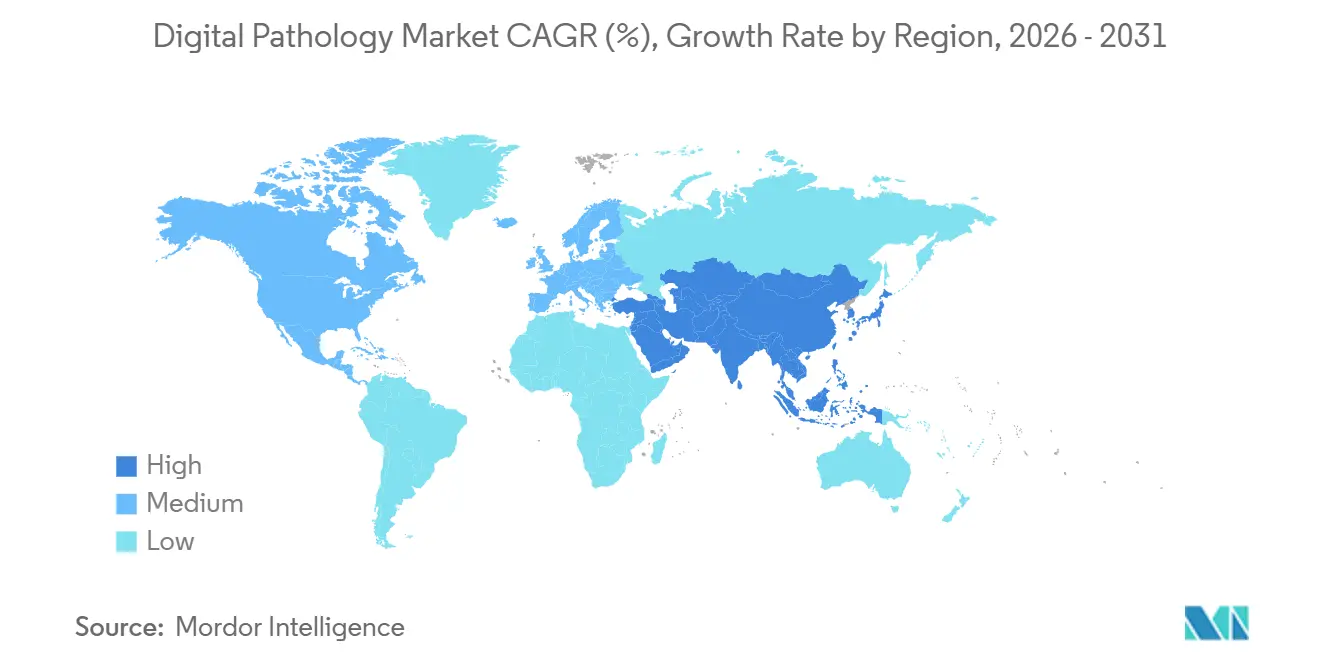
- By geography, North America commanded 47.8% revenue in 2025 and Asia-Pacific is set to post the fastest 11.21% CAGR through 2031.
Note: Market size and forecast figures in this report are generated using Mordor Intelligence’s proprietary estimation framework, updated with the latest available data and insights as of January 2026.
Global Digital Pathology Market Trends and Insights
Drivers Impact Analysis*
| Driver | (~)% Impact on CAGR Forecast | Geographic Relevance | Impact Timeline |
|---|---|---|---|
| Pathologist Workforce Shortages Accelerate Automation-Enabled Digital Workflows | +2.1% | Global, acute in North America & Europe | Medium term (2-4 years) |
| Large Oncology / Immunotherapy Trials Mandate Image-Based Biomarker Assessment | +1.8% | North America & EU, expanding to APAC | Long term (≥ 4 years) |
| Government Healthcare-Digitization & National AI Grants/Fast-Tracks | +1.5% | APAC core, spill-over to MEA & South America | Medium term (2-4 years) |
| Growth of Companion Diagnostics Needs Quantitative Tissue-Image Analytics | +1.3% | Global, led by North America & EU | Long term (≥ 4 years) |
| FDA Synthetic-Tissue Dataset Pilot Speeds Algorithm Approvals | +0.9% | North America, EU adoption following | Short term (≤ 2 years) |
| Spatial-Omics Integration Drives High-Plex Imaging Demand | +1.2% | North America & EU research hubs | Medium term (2-4 years) |
| Source: Mordor Intelligence | |||
Pathologist Workforce Shortages Accelerate Automation-Enabled Digital Workflows
Workforce models published in 2024 predicted the United States will be short 5,900 pathologists by 2030, equal to 18% of present capacity [2]Association of American Medical Colleges, “2024 Physician Workforce Projections,” aamc.org. Forty percent of consultant positions in the United Kingdom stayed vacant for more than six months in 2025. Digital platforms let one specialist review cases from several hospitals without shipping glass slides, effectively multiplying throughput. A 2025 College of American Pathologists study confirmed that AI-guided prescreening shortened routine biopsy turnaround time significantly with high diagnostic concordance. Hospitals are therefore redirecting capital from new hires to scanners and algorithm subscriptions that cost less than annual physician salaries.
Large Oncology/Immunotherapy Trials Mandate Image-Based Biomarker Assessment
Investigational new drug filings in immuno-oncology climbed to 1,847 in 2025, and 68% required digital quantification of PD-L1, tumor mutational burden, or immune-cell density. Manual scoring shows inter-observer variability exceeding 20% for PD-L1, whereas validated AI algorithms push variability below 5%, satisfying regulatory precision thresholds. Roche revealed that 82% of its late-stage oncology studies centralized slide review on digital platforms in 2025. Contract research organizations have mirrored this shift, installing scanners at regional hubs so international sites upload images to a single repository, insulating demand from hospital budget cycles.
Government Healthcare-Digitization & National AI Grants/Fast-Tracks
China earmarked RMB 2.3 billion (USD 320 million) in 2025 to deploy AI diagnostics across 300 tertiary hospitals by 2027. India’s Ayushman Bharat Digital Mission allotted INR 15 billion (USD 180 million) in 2024 for telepathology infrastructure in 5,000 district hospitals. The European Union committed EUR 120 million (USD 130 million) to digital health under Horizon Europe, channeling EUR 35 million to AI-enabled pathology projects. The United Kingdom added GBP 180 million (USD 230 million) in 2025 to roll out scanners across all 224 National Health Service trusts. Such programs underwrite capital costs and shrink adoption timelines.
Growth of Companion Diagnostics Needs Quantitative Tissue-Image Analytics
The FDA cleared 23 companion diagnostics in 2025, 17 of which use tissue-based assays that benefit from digital scoring. Agilent’s PD-L1 22C3 pharmDx assay now ships with an AI module validated on 1,200 patient samples in 2024 [3]Agilent Technologies, “PD-L1 22C3 pharmDx Digital Companion,” agilent.com. Ventana’s HER2 test added automated HER2/CEP17 ratio calculation in 2025, cutting result time from 48 hours to 6 hours. Pharmaceutical sponsors increasingly negotiate bundled assay-plus-software deals, ensuring consistent biomarker quantification at every clinical site.
Restraints Impact Analysis*
| Restraint | (~) % Impact on CAGR Forecast | Geographic Relevance | Impact Timeline |
|---|---|---|---|
| High Scanner, Storage & IT Costs for Mid-Tier/Public Labs | -1.4% | Global, acute in emerging markets & rural areas | Medium term (2-4 years) |
| Lack of Universal Interoperability Across Scanners, LIS & AI Ecosystems | -1.1% | Global, fragmented vendor landscape | Long term (≥ 4 years) |
| Volatile Global Glass-Slide Supply Constrained CAPEX Planning | -0.8% | Global, supply chain concentrated in Asia | Short term (≤ 2 years) |
| Data-Center Carbon-Footprint/ESG Limits Long-Term Cloud Storage | -0.7% | North America & EU, driven by corporate ESG mandates | Medium term (2-4 years) |
| Source: Mordor Intelligence | |||
High Scanner, Storage & IT Costs for Mid-Tier/Public Labs
A 40× WSI scanner costs USD 150,000–400,000 and generates roughly 50 terabytes per 10,000 slides, demanding enterprise storage of another USD 100,000–200,000 plus recurring cloud fees. Community hospitals operate on thin margins and cannot recoup capital through the USD 45 CPT 88360 reimbursement, prolonging payback periods. District hospitals in India budgeted only INR 5 million (USD 60,000) for all diagnostics in fiscal 2024-25, making WSI unattainable without grant support. Vendors now offer leasing and pay-per-slide pricing, but take-up remains slow where upfront cash constraints dominate purchasing.
Lack of Universal Interoperability Across Scanners, LIS & AI Ecosystems
Although DICOM Supplement 145 defines a WSI standard, vendors implement color calibration and compression differently, hampering seamless exchange. A 2025 Digital Pathology Association survey found 54% of multi-scanner sites reported workflow delays due to incompatible file formats, and 38% could not deploy a single AI model across brands. Laboratories often buy middleware costing USD 50,000–150,000 to bridge their LIS with imaging archives. Industry initiatives like IHE profiles exist, but adoption is voluntary and slow.
*Our forecasts treat driver/restraint impacts as directional, not additive. The impact forecasts reflect baseline growth, mix effects, and variable interactions.
Segment Analysis
By Product: Hardware Anchors Revenue, Software Captures Margin
Whole Slide Imaging Scanners generated 43.5% of 2025 revenue, reflecting the prerequisite hardware investment before any digitized workflow begins. Image Analysis & AI Software is expected to grow at a 10.21% CAGR, the fastest among products, as laboratories recognize that raw images have limited clinical value without automated quantification tools. Philips shifted to a subscription model in 2025, bundling its IntelliSite scanner and algorithms for USD 8,000 per month, lowering upfront costs that previously exceeded USD 350,000. Communication & Storage Systems also expand steadily because the College of American Pathologists mandates 10-year retention of diagnostic images, prompting multi-petabyte archives.
Slide Management Systems & Accessories, including barcode labelers and robotic loaders, reduce technician touch-time. Leica reports its GT 450 DX paired with a 400-slide loader drops handling from 45 seconds to 8 seconds per slide. AI firms increasingly embed algorithms directly into scanner firmware, blurring hardware and software revenue streams. This convergence complicates vendor positioning but enhances user experience, strengthening the digital pathology market value proposition.


By Imaging Technique: Brightfield Dominance Persists, Fluorescence Gains Share
Brightfield imaging accounted for 85.1% of 2025 revenue because most primary diagnoses rely on hematoxylin-and-eosin staining, and FDA approvals still emphasize brightfield platforms. Fluorescence imaging should grow at a 10.55% CAGR through 2031 on demand from multiplex immunofluorescence and spatial-omics assays. Akoya’s PhenoCycler, which profiles up to 100 proteins, expanded placements from 87 in 2024 to 142 in 2025, mostly at academic and pharma R&D sites. Fluorescence scanners command premiums of USD 250,000–600,000, yet grant funding and trial budgets often cover incremental costs, sustaining adoption.
Hybrid scanners that toggle between brightfield and fluorescence modes help laboratories consolidate equipment. Ventana’s DP 200 won FDA clearance in November 2025 for dual-mode primary diagnosis, signaling regulatory endorsement of integrated workflows. Confocal and light-sheet platforms enable 3D reconstruction but remain confined to research because diagnostic pathways for volumetric imaging have not been defined.
By Application: Diagnosis Leads, Telepathology Ascends
Disease Diagnosis held a 56.7% share in 2025, encompassing surgical pathology, cytology, and hematopathology. Telepathology & Consultation is poised for a 10.39% CAGR, propelled by subspecialty shortages. The American Telemedicine Association recorded a 34% increase in digital consultations in 2025, with dermatopathology and neuropathology forming 48% of cases. Frozen-section turnaround times at rural hospitals halve when remote pathologists read slides digitally, improving surgical workflow.
Drug Discovery & Companion Diagnostics usage is rising because sponsors need standardized tissue analytics for regulatory filings. Roche noted that centralized digital review now covers 82% of its late-stage oncology trials. Education & Training stays niche but growing; Harvard Medical School digitized 12,000 teaching slides in 2024, enabling global access. Lastly, Quality Assurance & Archiving remains essential for auditing diagnostic concordance and meeting record-retention rules.
By End User: Hospitals Dominate, Pharma Accelerates
Hospital & Reference Laboratories delivered 38.4% of 2025 spending, anchored by daily diagnostic volume. Pharmaceutical & Biotechnology Companies & CROs are forecast to record a 10.47% CAGR, embedding digital pathology into Phase II–III trials for reproducible biomarker assessment. Labcorp reported 41% digital-pathology revenue growth in 2025, driven by oncology contracts. Diagnostic Centers such as Quest Diagnostics adopt scanners to win hospital referrals requiring subspecialty opinions. Other End Users - including veterinary and forensic labs - remain small but benefit from scanner vendors tailoring software to non-human tissue types.
By Deployment Model: On-Premises Prevails, Cloud Gains Traction
On-premise installations accounted for 65.4% of revenue in 2025 because hospitals prefer to store patient data within their firewalls. Still, cloud-based offerings are projected to grow at a 10.16% CAGR as vendors offer consumption pricing and regulatory frameworks mature. Proscia’s Concentriq charges USD 0.50 per gigabyte of storage plus USD 2.00 per AI inference, avoiding million-dollar capital outlays. Philips launched a hybrid model in 2025 that keeps images local, but streams algorithms from secure data centers, addressing sovereignty rules while leveraging scalable compute.
Geography Analysis
North America captured 47.8% of 2025 revenue and benefits from FDA clarity, CPT reimbursement, and NIH dataset funding. Clearance of Philips IntelliSite, Leica Aperio AT2, and Hamamatsu NanoZoomer between 2017 and 2024 ended compliance uncertainty, accelerating procurement. CMS introduced CPT 88360 in 2024, providing USD 45 per digital consultation, a modest but critical catalyst. The NIH Bridge2AI program invested USD 150 million in standardized datasets during 2025, fueling algorithm R&D. Canada’s Ontario province linked 12 community hospitals to a central telepathology hub in 2025, cutting turnaround time by 38%.
Europe follows with strong regulatory push. The EU Medical Device Regulation requires CE-IVD certification for AI software by mid-2027, prompting hospitals to validate workflows early. The United Kingdom committed GBP 180 million in 2025 to digitize pathology across all NHS trusts by 2028. Germany’s health ministry opened a EUR 50 million grant program in 2025 for university hospitals, while France’s regulator approved seven AI algorithms for clinical use, the highest in Europe.
Asia-Pacific posts the fastest 11.21% CAGR. China’s Healthy China 2030 plan mandates county-level telepathology links and funds scanner rollouts worth RMB 2.3 billion. India’s Ayushman Bharat Digital Mission awarded INR 15 billion for 5,000 hospitals. Japan began reimbursing AI-assisted diagnosis at JPY 8,000 (USD 55) per case in April 2025, outpacing U.S. payment rates. Australia published national practice guidelines in 2025, giving hospitals a clear compliance roadmap. Middle East & Africa and South America lag due to infrastructure gaps. The UAE piloted digital pathology at eight hospitals in 2025 to test nationwide feasibility. South Africa’s National Health Laboratory Service connected rural clinics via telepathology in 2024 but struggles with bandwidth. Brazil invested BRL 120 million (USD 24 million) in 2025 to equip 50 cancer centers, focusing on high-mortality regions.

Competitive Landscape
The digital pathology market exhibits moderate concentration: the top five scanner vendors, Danaher (Leica Biosystems), Koninklijke Philips, Roche Ventana, Hamamatsu Photonics, and 3DHISTECH, held the majority of 2025 scanner revenue, while more than 30 software firms compete for algorithm contracts. Established hardware suppliers leverage global service networks and long hospital relationships, but software-first firms like PathAI, Paige, and Proscia bypass capex barriers through subscription models.
Strategic moves focus on AI integration and open ecosystems. Philips bought a minority stake in Paige in 2024 to embed algorithms into IntelliSite. Roche Ventana partnered with Visiopharm in 2025 to combine quantitative analysis with its BenchMark stainers. Sectra launched an open API in 2025, attracting 12 third-party AI partners within six months. Proscia’s cloud pricing resonates with budget-limited labs that cannot commit USD 500,000–1 million upfront.
Regional players also emerge. South Korea’s DeepBio raised USD 44 million in 2025, touting superior performance on Asian cohorts. Interoperability remains a differentiator: vendors holding both FDA and CE-IVD clearances command price premiums and dominate tenders, whereas research-use-only suppliers face smaller budgets and longer sales cycles. Mid-tier community hospitals and emerging markets remain under-penetrated, offering growth whitespace for vendors that can deliver low-cost, turnkey systems.
Digital Pathology Industry Leaders
Hamamatsu Photonics KK
3DHistech Ltd
Danaher Corporation (Leica Biosystems Nussloch GmbH)
F. Hoffmann-La Roche Ltd
Koninklijke Philips N.V.
- *Disclaimer: Major Players sorted in no particular order

Recent Industry Developments
- September 2025: Aiforia and Siemens Healthineers announced a partnership in September 2025 to expand the availability of Aiforia's AI applications across European diagnostic laboratories.
- June 2025: PathAI received FDA 510(k) clearance for its AISight® Dx digital pathology image management system for primary diagnosis, notably including a Predetermined Change Control Plan (PCCP) to accelerate future updates.
- January 2025: Leica Biosystems made a strategic investment in Indica Labs to accelerate the development of AI-enabled companion diagnostics and create an integrated digital pathology platform.


Research Methodology Framework and Report Scope
Market Definitions and Key Coverage
Our study defines the digital pathology market as global revenue from whole-slide scanners, imaging software (analysis plus storage), and integrated communication tools that convert histology slides into shareable diagnostics-grade images.
Scope exclusion: Conventional microscopes, generic PACS archives detached from pathology workflows, and outsourced specimen-processing services sit outside the scope.
Segmentation Overview
- By Product
- Whole Slide Imaging Scanners
- Image Analysis & AI Software
- Communication & Storage Systems
- Slide Management Systems & Accessories
- By Imaging Technique
- Brightfield
- Fluorescence
- By Application
- Disease Diagnosis
- Drug Discovery & Companion Diagnostics
- Telepathology & Consultation
- Education & Training
- Quality Assurance & Archiving
- By End User
- Hospital & Reference Laboratories
- Pharmaceutical & Biotechnology Companies & CROs
- Diagnostic Centers
- Other End Users
- By Deployment Model
- On-premise
- Cloud-based / SaaS
- By Geography
- North America
- United States
- Canada
- Mexico
- Europe
- Germany
- United Kingdom
- France
- Italy
- Spain
- Russia
- Rest of Europe
- Asia-Pacific
- China
- Japan
- India
- South Korea
- Australia
- Rest of APAC
- Middle East & Africa
- GCC
- South Africa
- Rest of Middle East & Africa
- South America
- Brazil
- Argentina
- Rest of South America
- North America
Detailed Research Methodology and Data Validation
Primary Research
We spoke with laboratory heads, histotechnologists, and pathology IT leads on three continents. Their insights on installed units, slide throughput, and software renewal plans validated secondary numbers and corrected early assumptions.
Desk Research
We scanned tier-one sources such as FDA 510(k) files, NCI SEER cancer cases, UN Comtrade tariff data, and position papers from the European Digital Pathology Society. Annual reports, device price lists, PubMed studies, and financial signals captured by D&B Hoovers and Factiva refined volume, pricing, and pipeline views. This list is indicative; many other datasets and filings informed data collection.
Market-Sizing & Forecasting
A top-down model starts with national slide volumes, applies digital adoption ratios, average scanner prices, and software fees to reach the base year. Bottom-up cross checks through shipment tallies and sampled license revenues temper totals along the way. We then feed variables such as imaging penetration, pathologist density, bandwidth cost, AI reimbursement codes, and scanner ASP trends into a multivariate regression that projects to 2030.
Data Validation & Update Cycle
Mordor analysts test outputs against independent sales disclosures, flag anomalies, and pass models through senior review. We refresh annually and issue interim updates after major clearances or bulk orders.
Why Mordor's Digital Pathology Baseline Stands Firm
Published estimates differ because each firm selects its own product mix, adoption curve, and currency basis.
Key gap drivers span inclusion of AI revenue, uptake speed in emerging markets, cloud subscription treatment, and refresh timing.
Benchmark comparison
| Market Size | Anonymized source | Primary gap driver |
|---|---|---|
| USD 1.42 B (2025) | Mordor Intelligence | (not applicable) |
| USD 1.46 B (2025) | Global Consultancy A | Adds archive servers and uses constant ASPs |
| USD 1.30 B (2024) | Regional Consultancy B | Omits cloud licenses, assumes slower ex-US adoption |
| USD 1.11 B (2024) | Industry Portal C | Counts hardware only, drops service income |
These comparisons show Mordor's disciplined scope selection, driver-based modeling, and timely refresh produce a transparent baseline decision-makers can trust.


Key Questions Answered in the Report
What is the projected value of the digital pathology market in 2031?
The market is forecast to reach USD 3.21 billion by 2031, expanding at a 9.90% CAGR.
Which product segment is expected to grow fastest?
Image Analysis & AI Software is anticipated to deliver a 10.21% CAGR through 2031 as laboratories seek automated quantification.
Why is Asia-Pacific the fastest-growing region?
Government digitization mandates in China, India, and Japan underpin an 11.21% regional CAGR by funding scanners and reimbursement for AI-assisted reads.
What restrains adoption in community hospitals?
High upfront costs for scanners and enterprise storage, coupled with limited reimbursement, hinder deployments in budget-constrained labs.
How are vendors addressing interoperability challenges?
Industry leaders are publishing open APIs and embracing DICOM standards so laboratories can run third-party AI tools across multi-vendor scanner fleets.
Page last updated on:


