Artificial Intelligence In Diagnostics Market Size and Share
Market Overview
| Study Period | 2020 - 2031 |
|---|---|
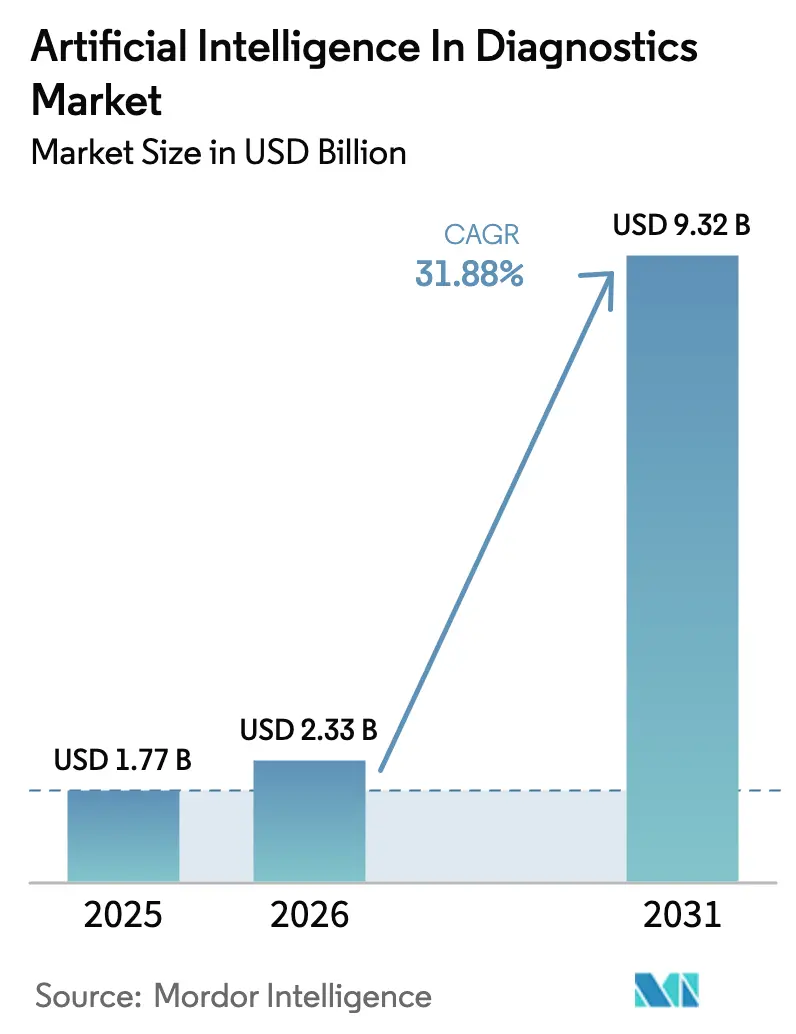
| Market Size (2026) | USD 2.33 Billion |
| Market Size (2031) | USD 9.32 Billion |
| Growth Rate (2026 - 2031) | 31.88% CAGR |
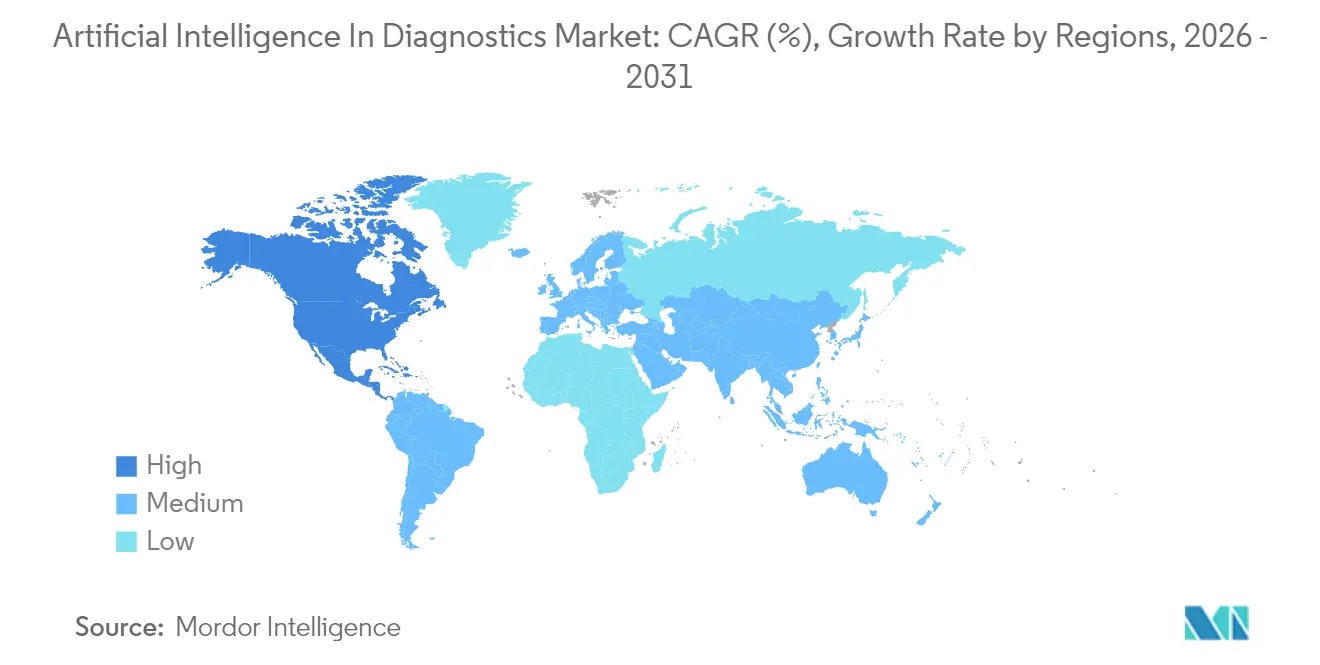
| Fastest Growing Market | Asia-Pacific |
| Largest Market | North America |
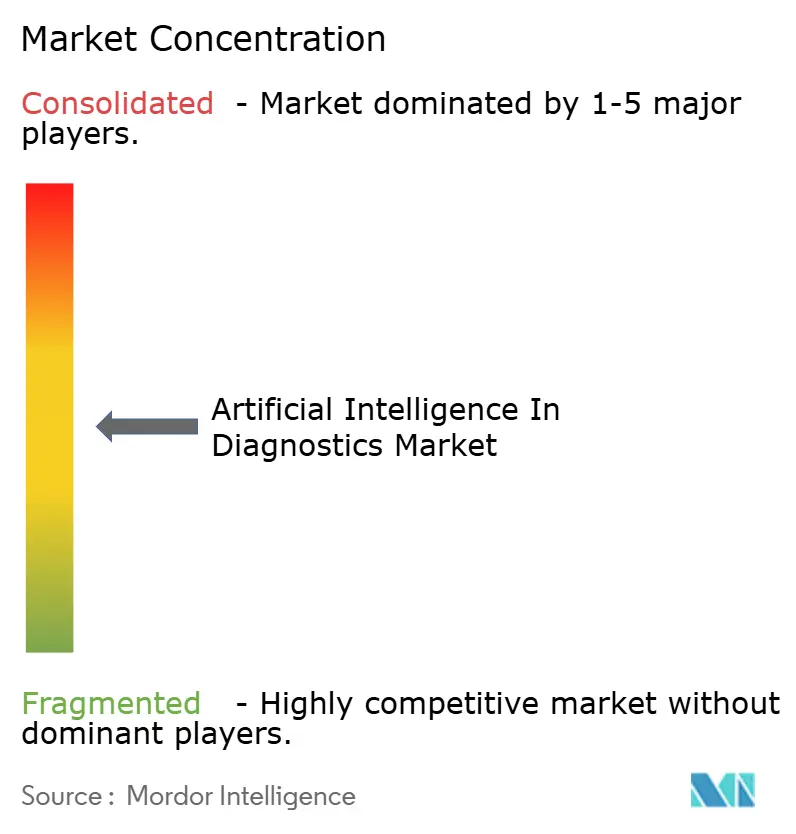
| Market Concentration | Medium |
Major Players *Disclaimer: Major Players sorted in no particular order Image © Mordor Intelligence. Reuse requires attribution under CC BY 4.0. | |
Artificial Intelligence In Diagnostics Market Analysis by Mordor Intelligence
The Artificial Intelligence in Diagnostics market size was valued at USD 1.77 billion in 2025 and estimated to grow from USD 2.33 billion in 2026 to reach USD 9.32 billion by 2031, at a CAGR of 31.88% during the forecast period (2026-2031). Expansion rests on three intertwined factors: maturing regulation, the arrival of dedicated reimbursement codes, and accelerating algorithmic performance gains. In January 2025 the FDA issued comprehensive draft guidance for AI-enabled medical devices, clarifying clinical study design and post-market monitoring expectations. At nearly the same time, the Centers for Medicare & Medicaid Services (CMS) finalized the first permanent payment codes for stand-alone AI algorithms used in radiology, transforming once-pilot deployments into billable clinical services. Venture funding floods the field; a sample of 2024–2025 deals shows Imagen Technologies, AZmed and ThinkSono raising a combined USD 50 million for expansion and regulatory submissions. Meanwhile, technology leaders such as GE HealthCare and Siemens Healthineers are embedding NVIDIA’s MONAI Deploy toolkit in their scanners, shortening the path between model development and bedside deployment. Hospitals adopt these tools to counter rising imaging volumes and radiologist shortages, while diagnostic laboratories deploy AI to scale high-throughput screening and remote interpretation.
Key Report Takeaways
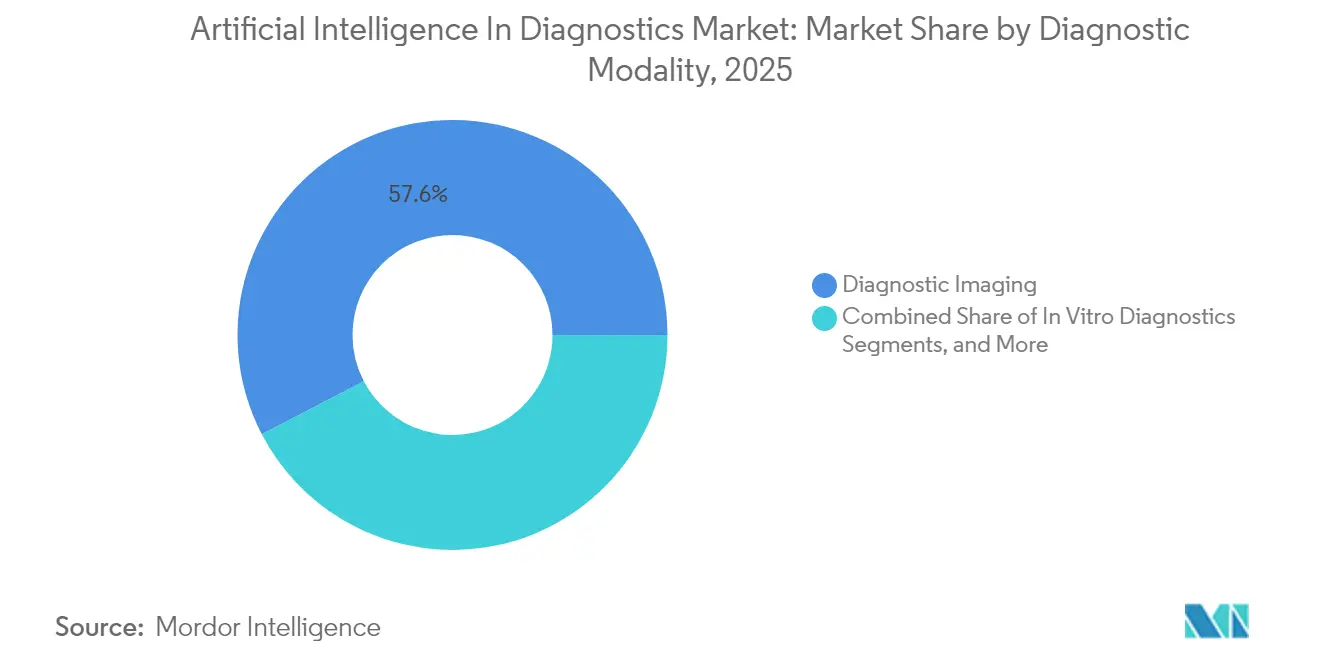
- By diagnostic modality, imaging accounted for 57.64% of the Artificial Intelligence in Diagnostics market share in 2025; in vitro diagnostics is forecast to expand at a 32.9% CAGR through 2031.
- By application, neurology led with a 25.21% revenue share in 2025, while oncology is tracking a 33.2% CAGR to 2031.
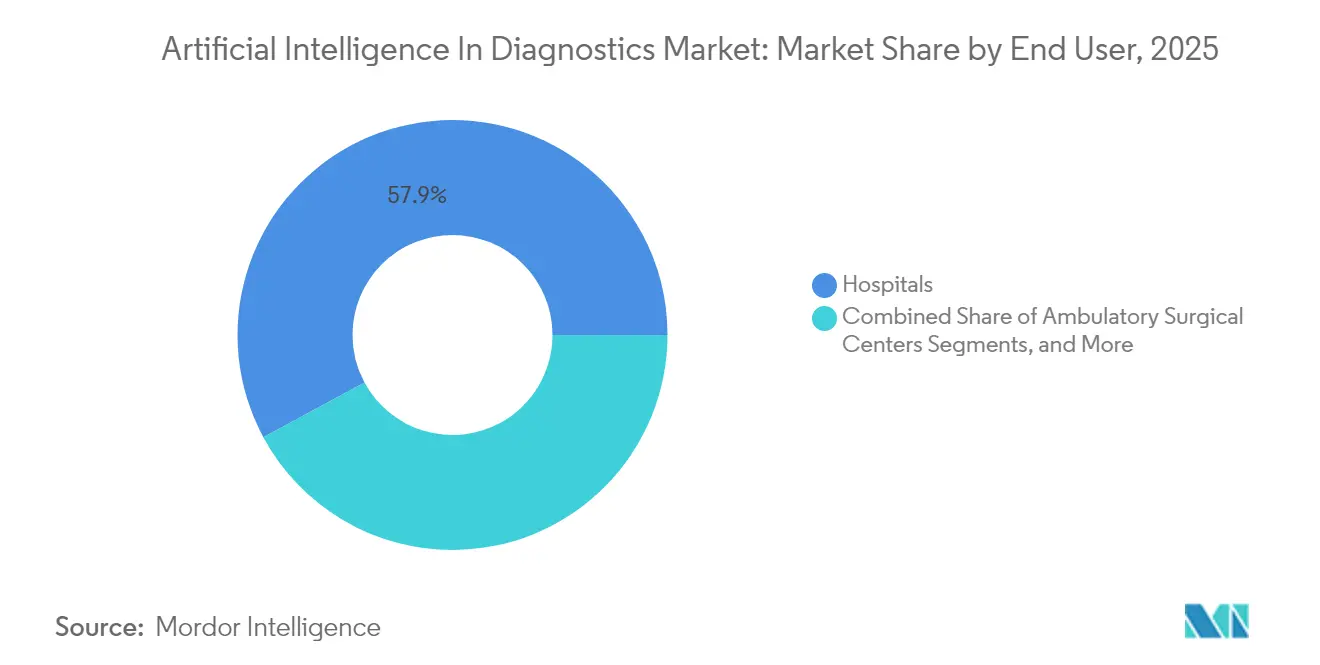
- By end-user, hospitals held 57.88% of the Artificial Intelligence in Diagnostics market share in 2025; diagnostic laboratories post the fastest 32.85% CAGR through 2031.
Note: Market size and forecast figures in this report are generated using Mordor Intelligence’s proprietary estimation framework, updated with the latest available data and insights as of 2026.
Global Artificial Intelligence In Diagnostics Market Trends and Insights
Driver Impact Analysis*
| Driver | (~) % Impact on CAGR Forecast | Geographic Relevance | Impact Timeline |
|---|---|---|---|
| Increasing demand for AI tools in medical imaging & workload reduction | +8.5% | Global, highest in North America & Europe | Medium term (2–4 years) |
| Government incentives accelerating AI adoption | +6.2% | North America & European Union; emerging impact in Asia-Pacific | Long term (≥ 4 years) |
| Surge in venture & strategic funding for AI-diagnostics start-ups | +5.8% | Global, concentrated in North America & Europe | Short term (≤ 2 years) |
| FDA fast-track 510(k) clearances for AI diagnostic devices (post-2024) | +4.9% | Global, primary impact in North America | Medium term (2–4 years) |
| Foundation-model integration enabling multimodal diagnostics | +4.1% | Global, led by North America & Europe | Long term (≥ 4 years) |
| Emergence of CMS reimbursement codes for AI algorithms | +3.9% | North America, with spillover to other developed markets | Medium term (2–4 years) |
| Source: Mordor Intelligence | |||
Increasing demand for AI tools in medical imaging & workload reduction
Worldwide shortages of radiologists intensify interest in automation. Siemens Healthineers reports that its AI-Rad Companion Chest CT reduces report preparation time by up to 74%, freeing specialists for complex cases [1]Siemens Healthineers, “AI-Rad Companion Chest CT Delivers 74% Time Savings,” Siemens Healthineers, siemens-healthineers.com. Emergency departments see similar gains: RapidAI’s stroke-triage model delivers 98% sensitivity, accelerating door-to-needle decisions. Imaging networks such as RadNet spent more than USD 54 million on AI acquisitions in 2024 alone to preserve turnaround speed and referral loyalty.
Administrators also cite reduced burnout and fewer repetitive stress injuries among sonographers after AI-guided scanning protocols. As imaging volumes keep rising faster than staff rosters, the Artificial Intelligence in Diagnostics market becomes core infrastructure rather than optional add-on.
Government incentives accelerating AI adoption
National policies now combine grants, standards and payment reform. The U.S. HHS AI Strategy earmarks funding for hospital pilots and codifies an HHS AI Council for ongoing governance. In Europe, the EU AI Act classifies diagnostic imaging algorithms as “high-risk,” but offers regulatory sandboxes and harmonized conformity assessment, lowering multi-country launch costs. Legislatures in 34 U.S. states debated over 250 AI-related healthcare bills in 2025, many mandating coverage or setting liability shields for AI-guided diagnosis. In emerging Asian markets, public procurement programs subsidize cloud-hosted inference services so rural clinics can access city-grade image reading without on-site radiologists.
Surge in venture & strategic funding for AI-diagnostics start-ups
Capital flows speed commercialization. Imagen Technologies secured USD 32 million in Series C financing; AZmed raised USD 16.2 million; and ThinkSono attracted GBP 2.1 million to advance ultrasound AI. Corporate investors mirror this activity: GE HealthCare purchased Intelligent Ultrasound’s clinical AI business for USD 53 million to deepen point-of-care offerings [2]GE HealthCare, “NVIDIA Partnership To Deliver Autonomous Imaging,” GE HealthCare, gehealthcare.com. Aidoc reserved USD 30 million specifically to train foundation models that span multiple imaging organs within a single architecture. Ready access to cash translates into faster regulatory submissions and broader geographic roll-outs, fuelling compound growth in the Artificial Intelligence in Diagnostics market.
FDA fast-track 510(k) clearances for AI diagnostic devices
Post-2024, the FDA granted breakthrough designation to algorithms such as Cleerly’s coronary artery disease staging platform and icometrix’s tool for amyloid-related imaging abnormality detectioN. January 2025 draft guidance underscores continuous performance monitoring and bias audits, but also outlines a clear pre-submission workflow, cutting uncertainty for innovators. The streamlined route encourages early alignment between developers and reviewers, shrinking average submission-to-clearance timelines and reinforcing investor confidence.
Restraint Impact Analysis*
| Restraint | (~) % Impact on CAGR Forecast | Geographic Relevance | Impact Timeline |
|---|---|---|---|
| Reluctance among medical practitioners to adopt AI | −4.2% | Global, steeper in traditional healthcare systems | Medium term (2–4 years) |
| High procurement & lifecycle-maintenance costs | −3.8% | Global, toughest for small providers | Short term (≤ 2 years) |
| Algorithmic bias triggering regulatory scrutiny | −2.9% | Global, stricter oversight in EU & North America | Long term (≥ 4 years) |
| Fragmented data-interoperability standards | −2.1% | Global, acute challenges in multi-vendor environments | Medium term (2–4 years) |
| Source: Mordor Intelligence | |||
Reluctance among medical practitioners to adopt AI
Clinicians worry about loss of autonomy, liability exposure and algorithmic opacity. A 2024 survey of Polish physicians found that only 32% were fully comfortable delegating image interpretation to AI, despite 68% agreeing it improves throughput [3]Ewelina Kowalewska, “Physicians and AI in Healthcare: Insights From a Mixed-Methods Study in Poland on Adoption and Challenges,” Frontiers in Digital Health, frontiersin.org. Experienced radiologists voice concerns that atypical cases fall outside training data, requiring nuanced human judgment. Cost adds friction: department chairs identified procurement expense as the primary roadblock even when quality benefits were acknowledged. Finally, job-security fears linger; almost half of surveyed nurses expressed unease about AI replacing certain tasks, though structured training programs significantly improved acceptance rates.
High procurement & lifecycle-maintenance costs
Initial licensing, GPU infrastructure and PACS integration often exceed USD 1 million for multi-site deployments. Annual support contracts can reach 30% of the upfront price as vendors roll out iterative model updates to meet evolving FDA performance expectations. Smaller laboratories struggle to amortize these expenses across limited procedure volumes. Cloud-based subscription models promise relief but raise data-sovereignty and latency issues in markets with fragile connectivity. As standardization improves, cost curves are expected to drop, yet near-term adoption remains skewed toward well-capitalized health systems.
*Our forecasts treat driver/restraint impacts as directional, not additive. The impact forecasts reflect baseline growth, mix effects, and variable interactions.
Segment Analysis
By Diagnostic Modality: Imaging Dominates Despite IVD Acceleration
Diagnostic imaging captured 57.64% of the Artificial Intelligence in Diagnostics market share in 2025, leveraging decades of archived DICOM files that enable supervised deep-learning at scale. Foundation models, pre-trained on millions of X-ray, CT and MRI slices, now deliver organ-agnostic workflows that read multiple pathologies in one pass. Vendors such as GE HealthCare pair these algorithms with edge processors embedded directly in detectors, cutting latency and reducing data-center fees. The Artificial Intelligence in Diagnostics market size for imaging is projected to expand steadily as autonomous acquisition protocols reduce retakes and standardize quality, making AI indispensable in resource-tight departments.
In vitro diagnostics (IVD) is the fastest-growing modality, set to scale at a 32.9% CAGR through 2031. Pattern-recognition networks classify genomic variants, metabolomic spectra and microbial signatures with higher specificity than rule-based analyzers. The Artificial Intelligence in Diagnostics market size for IVD will benefit from turnkey cloud APIs that deliver assay interpretation to small labs without dedicated data scientists. Digital pathology sits at the intersection of imaging and IVD; slide scanners feed whole-slide images into convolutional nets that mark tumor margins and grade inflammation, allowing pathologists to focus on complex differential diagnoses.


By Application: Oncology Disrupts Neurology’s Leadership
Neurology held 25.21% of Artificial Intelligence in Diagnostics market share in 2025, underpinned by stroke, epilepsy and dementia workloads that demand rapid intervention. Real-time CT perfusion mapping shortens door-to-thrombolysis times, while 3D volumetry quantifies multiple sclerosis lesion load with sub-millimeter precision. Yet oncology is advancing at a 33.2% CAGR to 2031, propelled by tools such as Clairity BREAST, the first device authorized to predict five-year breast-cancer risk from a single mammogram. Multimodal fusion of radiology, pathology and genomic data further elevates accuracy, shifting oncology from image-centric detection to holistic prognostication.
Cardiology continues steady adoption as HeartFlow’s AI-derived plaque analysis gains Medicare coverage, validating reimbursement-driven uptake. Infectious-disease algorithms classify pathogen species directly from chest X-rays or broad-spectrum sequencing, a priority in antimicrobial-resistance stewardship. Meanwhile, obstetric AI tracks fetal growth curves in motion-compensated 3D ultrasound, expanding prenatal care access in low-resource regions.
By End-User: Laboratories Challenge Hospital Dominance
Hospitals commanded 57.88% of the Artificial Intelligence in Diagnostics market share in 2025 thanks to large scanner fleets, enterprise PACS and in-house IT teams capable of supporting GPU clusters. Integrated AI raises scanner utilization, creating headroom without capital expansion. The Artificial Intelligence in Diagnostics market size attributable to hospitals will keep growing as reimbursement stabilizes and bundled-payment models reward diagnostic accuracy.
Diagnostic laboratories post the fastest 32.85% CAGR by leveraging AI to automate high-volume studies ranging from full-body CT screenings to multiplex PCR interpretation. The Artificial Intelligence in Diagnostics market size for laboratories is lifted by remote-read services that route images through secure clouds to subspecialists thousands of miles away. Partnerships such as Integral Diagnostics’ expansion of Aidoc workflows across Australia and New Zealand show how independent chains level the playing field against tertiary hospitals. Ambulatory centers and tele-imaging platforms round out the user base, exploiting software-as-a-service models that eliminate on-site GPU ownership.
Geography Analysis
North America remains the epicenter, accounting for 53.48% of global revenue in 2025. Early FDA clearances—129 radiology AI devices since 2015—established a precedent that de-risked pilot budgets, while new CMS codes ensure monetization for stroke detection, cardiac CTA analysis and breast-cancer triage. Strategic collaborations are a hallmark: GE HealthCare and NVIDIA co-develop autonomous imaging suites to offset staff shortages, and Siemens Healthineers inks decade-long “value partnerships” bundling scanners, AI software and managed service agreements.
Europe follows closely. The EU AI Act mandates risk-based classification, model transparency and bias testing but also provides common technical documentation templates, accelerating cross-border market entry. Vendors like ThinkSono obtained CE marking for point-of-care ultrasound AI that guides novice operators through DVT scans, broadening the sonographer pool. National health systems in Germany, France and the Nordics run reimbursement pilots that tie AI performance to outcome-based bonuses.
Asia-Pacific is the fastest-growing territory. Government-backed electronic medical-record rollouts in India, Japan and South Korea generate structured image archives ideal for machine-learning. The National Health Authority of India and IIT Kanpur launched open-access datasets under IndiaAI to spur domestic algorithm development. Regional leaders like Qure.ai deployed tuberculosis triage across more than 90 districts, reporting 15 million cumulative patient scans. In China, hospital groups bundle AI lung-nodule detection with annual physicals, illustrating consumer-direct monetization outside insurance frameworks.

Competitive Landscape
Moderate fragmentation defines the Artificial Intelligence in Diagnostics market. Incumbent equipment makers—GE HealthCare, Siemens Healthineers and Philips—integrate proprietary algorithms at the firmware layer, selling scanners as analytics platforms rather than hardware appliances. GE HealthCare has more than 40 FDA-cleared AI applications embedded in its Revolution CT line, while Siemens Healthineers holds over 450 active imaging-AI patents. Pure-play vendors such as Aidoc, Viz.ai and RapidAI compete on triage speed and breadth of FDA-cleared indications; Aidoc alone covers 13 acute findings across the neuro and chest domains.
Strategic alliances blur boundaries. GE HealthCare’s 2025 tie-up with NVIDIA grants access to accelerated inference libraries and MONAI DevKit, halving development cycles for autonomous X-ray positioning. Cleerly and HeartFlow specialize in cardiovascular imaging, while Nanox pairs low-dose digital X-ray hardware with cloud AI that screens for bone fragility at population scale. Standards bodies such as IHE release workflow profiles that govern how AI results populate radiology reports, enhancing vendor interoperability and customer lock-in.
M&A pressures rise as start-ups confront elongating sales cycles and higher validation costs. RadNet’s USD 103 million purchase of iCAD in April 2025 bolsters its breast-imaging AI stack and demonstrates provider appetite for captive algorithm teams. Health-system venture funds increasingly trade minority stakes for exclusive deployment rights, signaling a pivot from vendor-centric to buyer-centric bargaining power. Overall, competitive intensity centers on pipeline breadth, regulatory agility and proof of economic value delivered.
Artificial Intelligence In Diagnostics Industry Leaders
Nanox Imaging LTD (Zebra Medical Vision, Inc.)
Riverain Technologies
Aidoc
Siemens Healthineers
Vuno, Inc.
- *Disclaimer: Major Players sorted in no particular order

Recent Industry Developments
- June 2025: FDA authorized Clairity BREAST as the first AI platform to predict five-year breast-cancer risk from standard mammograms alone.
- April 2025: RadNet announced acquisition of iCAD for USD 103 million to expand DeepHealth’s breast-imaging AI capabilities.
- March 2025: GE HealthCare and NVIDIA unveiled collaboration to build autonomous X-ray and ultrasound systems using the Isaac for Healthcare platform.


Research Methodology Framework and Report Scope
Market Definitions and Key Coverage
Our study defines the artificial intelligence in diagnostics market as software and embedded algorithms that ingest clinical data, chiefly medical images, laboratory values, and electronic records, to assist clinicians in detecting, classifying, or ruling out disease at the point of decision. Hardware sales, administrative bots, and broader AI-enabled care coordination tools remain outside scope.
Scope exclusion: Pure research platforms and AI engines that never generate a patient-facing diagnostic output are excluded.
Segmentation Overview
- By Diagnostic Modality
- In Vitro Diagnostics
- Molecular Diagnostics
- Immunoassays & Clinical Chemistry
- Point-of-Care Tests
- Diagnostic Imaging
- MRI
- CT
- X-ray
- Ultrasound
- PET/SPECT & Others
- Digital Pathology
- Other Modalities
- In Vitro Diagnostics
- By Application
- Oncology
- Cardiology
- Neurology
- Infectious Disease
- Obstetrics & Gynecology
- Respiratory & Pulmonology
- Other Applications
- By End-User
- Hospitals
- Diagnostic Laboratories
- Ambulatory Surgical Centers
- Other End-Users
- By Geography
- North America
- United States
- Canada
- Mexico
- Europe
- Germany
- United Kingdom
- France
- Italy
- Spain
- Rest of Europe
- Asia-Pacific
- China
- Japan
- India
- South Korea
- Australia
- Rest of Asia-Pacific
- Middle East
- GCC
- South Africa
- Rest of Middle East
- South America
- Brazil
- Argentina
- Rest of South America
- North America
Detailed Research Methodology and Data Validation
Primary Research
Mordor analysts interviewed radiologists, lab directors, hospital CIOs, and AI vendors across North America, Europe, and Asia-Pacific. These conversations validated real-world deployment volumes, ASP ranges, and expected reimbursement trajectories, filling gaps that secondary data could not address.
Desk Research
We began with open data from authorities such as the US FDA 510(k) database, the CMS Physician Fee Schedule, the WHO Global Health Observatory, and OECD Health Statistics, which anchor volumes, reimbursement, and epidemiology. Trade groups such as RSNA, the Digital Pathology Association, and HIMSS publish procedure counts, algorithm performance benchmarks, and adoption surveys that refine modality splits. Company filings gathered through D&B Hoovers, conference abstracts, patent families screened via Questel, and verified press releases add revenue clues and pipeline visibility. This list is illustrative; many additional public sources informed minor validations and clarifications.
A second pass reviewed academic articles indexed on PubMed and clinical trial registries to quantify algorithm accuracy gains and typical software price bands, giving us realistic average selling price (ASP) inputs.
Market-Sizing & Forecasting
A top-down demand pool, built from global imaging and lab procedure counts, prevalence rates, and documented AI penetration, establishes the 2025 baseline. Select bottom-up checks, sampled vendor revenues, channel feedback, and hospital spend surveys tighten the total before finalizing. Key variables include annual CT/MRI volumes, number of FDA-cleared diagnostic algorithms, average software ASP, hospital AI adoption rate, reimbursement code penetration, and oncology incidence trends. A multivariate regression with scenario analysis projects each driver to 2030; where bottom-up data lag, gap-filling ratios drawn from matched installations are applied.
Data Validation & Update Cycle
Outputs pass variance checks against independent indicators, then move through peer review and senior analyst sign-off. We refresh every twelve months, triggering interim updates when regulatory or reimbursement shocks materially shift the outlook, so clients always receive the latest view.
Why Our Artificial Intelligence in Diagnostics Baseline Commands Reliability
Published estimates diverge because firms differ in scope, driver selection, and update cadence, which skews totals and growth curves.
Key gap drivers include whether services or triage-only tools are counted, how aggressively future reimbursement is modeled, and if exchange rate swings are locked at a single point or trued up annually. Mordor's disciplined scope, dual-path validation, and yearly refresh narrow these uncertainties for decision-makers.
Benchmark comparison
| Market Size | Anonymized source | Primary gap driver |
|---|---|---|
| USD 1.77 B | Mordor Intelligence | - |
| USD 1.97 B | Global Consultancy A | Includes broad imaging analytics and uses vendor revenue roll-ups without procedure cross-checks |
| USD 1.94 B | Industry Association B | Limits scope to software, omits emerging markets, and applies fixed five-year currency averages |
In sum, the disciplined mix of transparent variables, live primary insights, and scheduled refreshes makes Mordor's baseline both balanced and reproducible, giving stakeholders a dependable launchpad for strategic planning.


Key Questions Answered in the Report
How big is the Global Artificial Intelligence in Diagnostics Market?
The Global Artificial Intelligence in Diagnostics Market size is expected to reach USD 2.33 billion in 2026 and grow at a CAGR of 31.88% to reach USD 9.32 billion by 2031.
What is the current Global Artificial Intelligence in Diagnostics Market size?
Imaging modalities hold 57.64% share, supported by vast DICOM-based datasets and embedded GPU workflows.
Who are the key players in Global Artificial Intelligence in Diagnostics Market?
Nanox Imaging LTD (Zebra Medical Vision, Inc.), Riverain Technologies, Aidoc, Siemens Healthineers and Vuno, Inc. are the major companies operating in the Global Artificial Intelligence in Diagnostics Market.
Which is the fastest growing region in Global Artificial Intelligence in Diagnostics Market?
Asia-Pacific is estimated to grow at the highest CAGR over the forecast period (2026-2031).
Why is North America ahead in adoption?
Streamlined FDA clearances, CMS reimbursement codes and strong venture funding give North America 53.48% revenue share.
Page last updated on:


