Augmented Reality (AR) In Healthcare Market Size and Share
Market Overview
| Study Period | 2020 - 2031 |
|---|---|
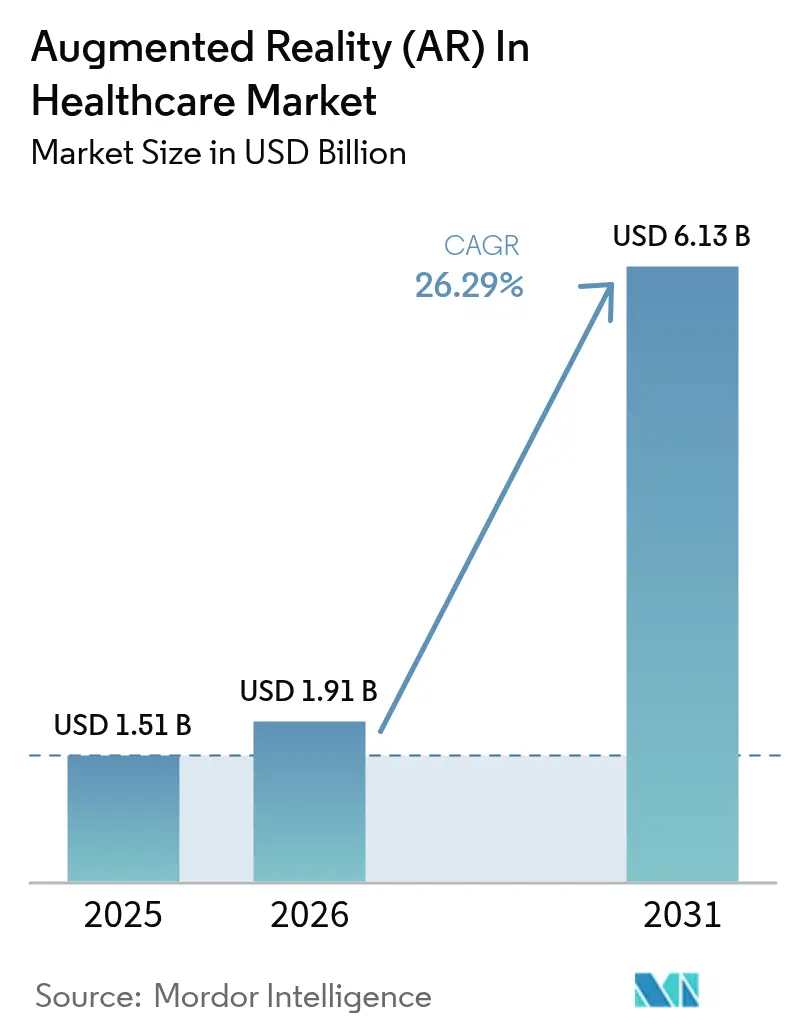
| Market Size (2026) | USD 1.91 Billion |
| Market Size (2031) | USD 6.13 Billion |
| Growth Rate (2026 - 2031) | 26.29% CAGR |
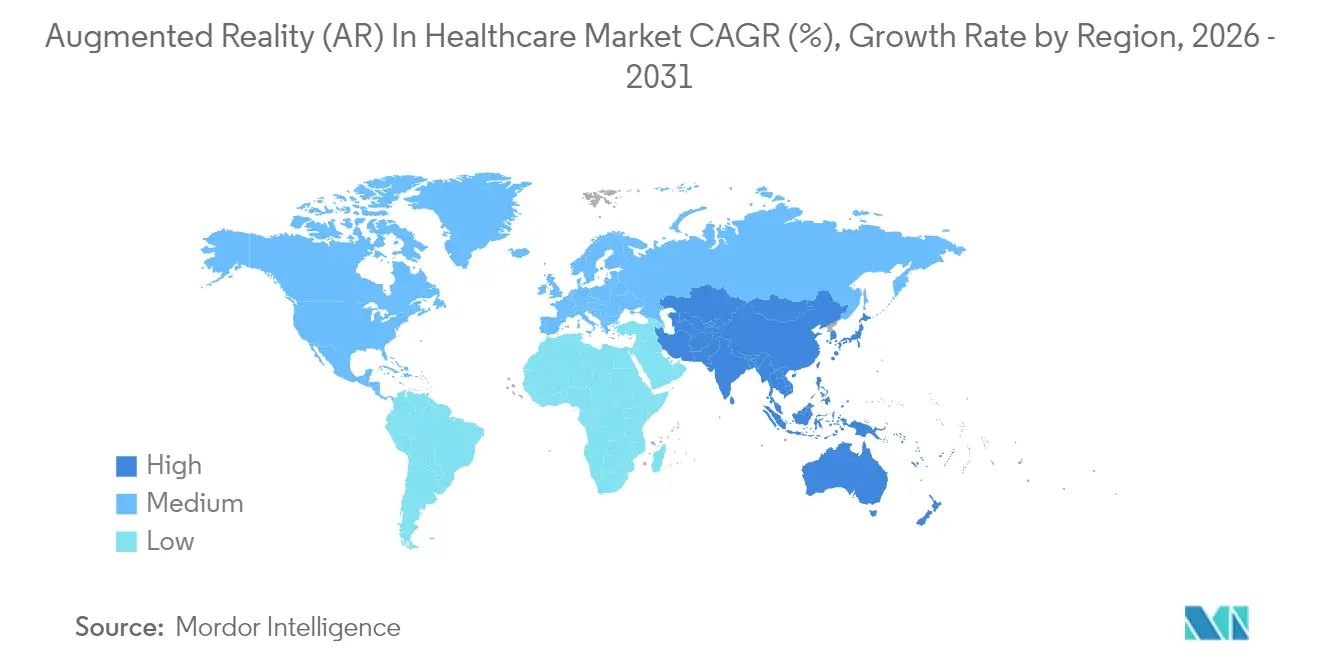
| Fastest Growing Market | Asia-Pacific |
| Largest Market | North America |
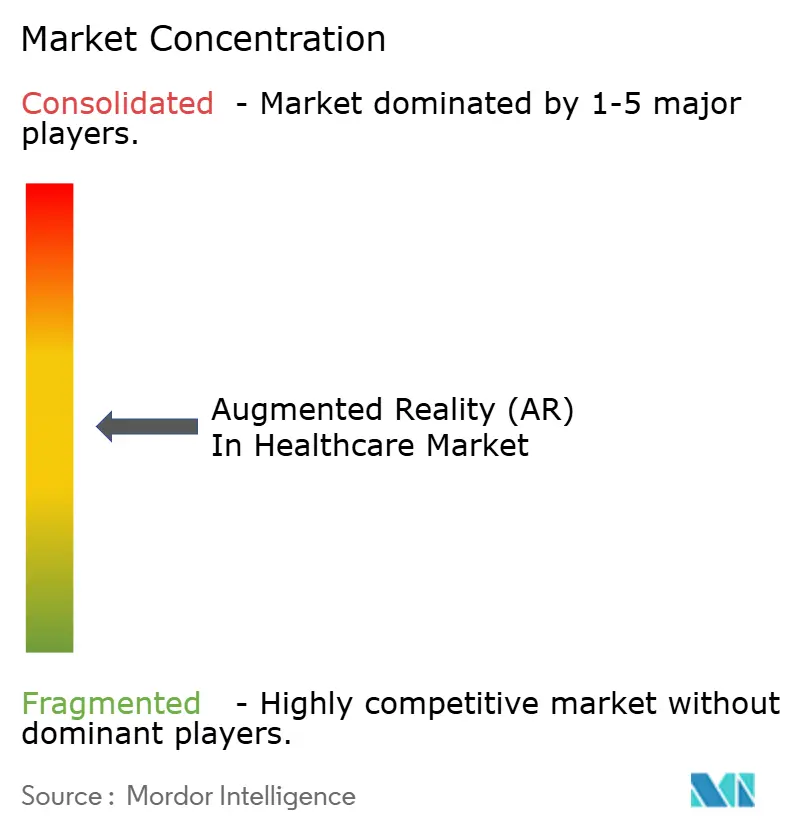
| Market Concentration | Medium |
Major Players *Disclaimer: Major Players sorted in no particular order Image © Mordor Intelligence. Reuse requires attribution under CC BY 4.0. | |
Augmented Reality (AR) In Healthcare Market Analysis by Mordor Intelligence
Augmented reality in healthcare market size in 2026 is estimated at USD 1.91 billion, growing from 2025 value of USD 1.51 billion with 2031 projections showing USD 6.13 billion, growing at 26.29% CAGR over 2026-2031. The growth pace shows that hospitals, training centers, and home-care providers are moving from isolated pilots to enterprise-wide deployments that improve surgical accuracy, shorten learning curves, and raise patient engagement. FDA clearances for intra-operative head-mounted systems and the post-pandemic priority on touch-free visualization tools have turned augmented reality into a clinical requirement rather than an experimental add-on[1]U.S. Food and Drug Administration, “De Novo and 510(k) Clearances for Immersive Medical Devices,” fda.gov. Hardware continues to generate the bulk of current revenue, yet demand is shifting toward turnkey service contracts that cover workflow integration, data security, and outcomes monitoring. North America leads adoption because of its mature reimbursement systems, while Asia-Pacific delivers the steepest growth as governments fund technology that eases physician shortages. Competitive intensity is building as device majors embed AR into imaging suites and younger firms secure multi-center trials that validate efficacy.
Key Report Takeaways
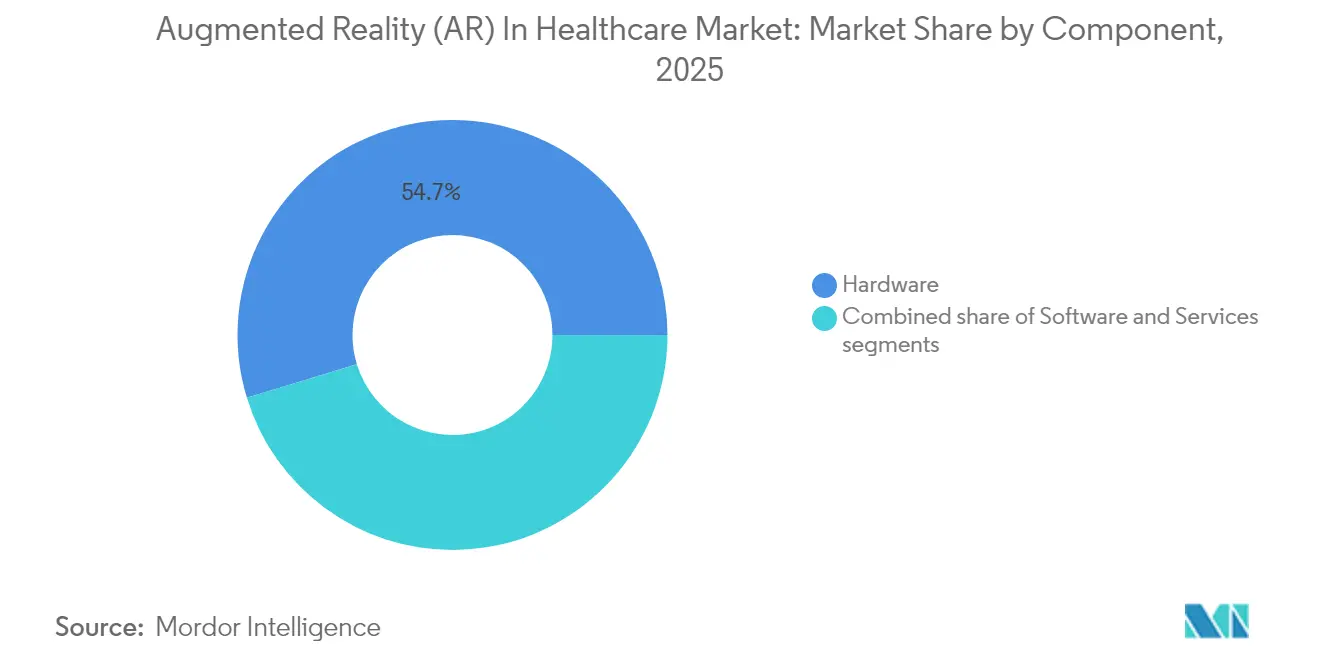
- By component, hardware controlled 54.72% of Augmented Reality in Healthcare market share in 2025; services are projected to grow at a 27.90% CAGR to 2031.
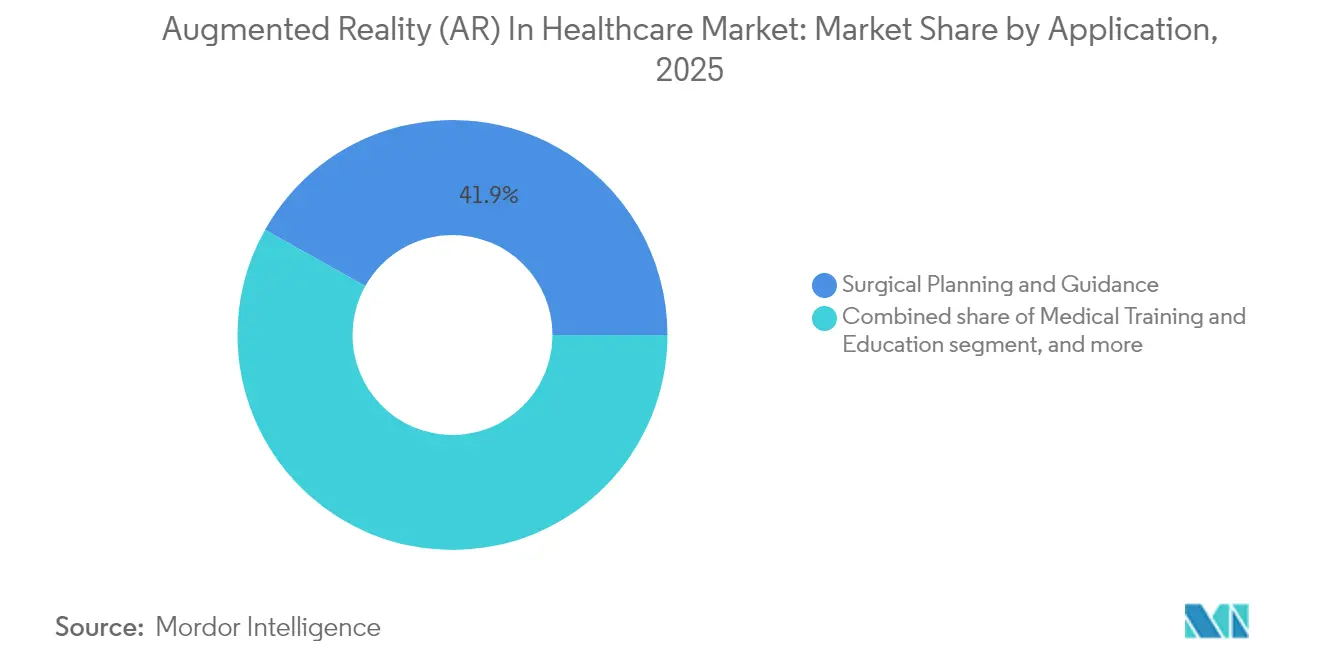
- By application, surgical planning & guidance held 41.86% of the Augmented Reality in Healthcare market size in 2025 and is expanding at 28.35% CAGR through 2031.
- By technology, handheld devices led revenue with 38.12% in 2025, while head-mounted displays post the fastest 28.12% CAGR.
- By Product, AR displays generated 35.02% of 2025 revenue and is growing at 27.86% CAGR.
- By end user, hospitals & clinics accounted for 51.20% of 2025 revenue; research laboratories record the highest 28.80% CAGR.
- By geography, North America captured 42.60% revenue in 2025; Asia-Pacific is advancing at 27.10% CAGR.
Note: Market size and forecast figures in this report are generated using Mordor Intelligence’s proprietary estimation framework, updated with the latest available data and insights as of 2026.
Global Augmented Reality (AR) In Healthcare Market Trends and Insights
Driver Impact Analysis*
| Driver | % Impact on CAGR Forecast | Geographic Relevance | Impact Timeline |
|---|---|---|---|
| Growing adoption of augmented reality for surgical training & guidance | +6.2% | Global, strongest in North America & EU | Medium term (2-4 years) |
| Increasing investments & funding in augmented-reality healthcare start-ups | +4.8% | North America & EU core, expanding to APAC | Short term (≤2 years) |
| Rising demand for minimally invasive procedures enhanced by visualization | +5.1% | Global, particularly developed markets | Long term (≥4 years) |
| Expanding use of augmented reality in patient education & rehabilitation | +3.9% | APAC leading, emerging markets following | Medium term (2-4 years) |
| Integration of augmented reality with medical-imaging systems | +4.3% | Global, concentrated in major healthcare hubs | Medium term (2-4 years) |
| Accelerating digital transformation & telehealth adoption post-COVID | +2.7% | Global, with rural and underserved areas prioritized | Short term (≤2 years) |
| Source: Mordor Intelligence | |||
Growing Adoption of AR for Surgical Training & Guidance
Medical schools and major centers have adopted immersive simulators that combine high-resolution overlays with haptic feedback, cutting error rates and trimming the hours required to reach proficiency. Mayo Clinic reports lower procedural complications when residents practice on AR modules before entering the theatre[2]Daniel Sorin et al., “Voice-Controlled Navigation in AR-Guided Pancreatic Surgery,” arXiv, arxiv.org. Recent prototypes add voice-controlled navigation that lets surgeons reposition virtual anatomy without touching screens, lowering infection risk and mental workload. These capabilities align with competency-based curricula that mandate objective performance tracking, something marker-based cameras and motion analytics supply natively. As reimbursement policies move toward outcomes, training directors view AR as a cost-effective path to faster credentialing. Medium-term momentum is therefore locked in; growth later accelerates when cloud-hosted libraries make updates available across entire residency networks.
Increasing Investments in AR Healthcare Start-Ups
Venture funding has pivoted from experimental prototypes to firms holding multiple FDA clearances and live hospital contracts. Augmedics drew USD 82.5 million in its 2024 Series D, bringing total backing to USD 149 million and supporting a 250-hospital roll-out of its xvision spine system. Strategic acquirers such as Stryker and Philips now value clinical data sets and integration know-how more than raw optics, prompting tuck-in deals that accelerate time-to-market. Capital inflows shorten the gap between concept and commercial production, which compresses product life cycles and raises competitive pressure. Over the next two years, boards will reward platforms that publish peer-reviewed outcomes and prove cost avoidance rather than those relying on general XR hype.
Rising Demand for Minimally Invasive Procedures Enhanced by Visualization
Surgeons using AR-guided laparoscopy have recorded 43% lower intraoperative blood loss and fewer postoperative infections versus standard video scopes. Three-dimensional overlays project hidden vessels and bile ducts onto live imagery, letting physicians choose tighter incision paths and spare adjacent tissue. Force-feedback-equipped robots further limit trauma, with prototype systems slashing peak instrument forces by 43% in preclinical trials. Hospitals quantifying total episode costs see shorter stays and fewer readmissions, which boosts margins under bundled-payment rules. Long-term growth therefore rests on a virtuous loop of clinical and economic benefits that build strong ROI cases for administrators.
Expanding Use of AR in Patient Education & Rehabilitation
Patients who preview their own anatomy with AR tablets grasp procedural steps more clearly, which reduces pre-operative anxiety and raises consent quality. Post-stroke individuals using gesture-tracked rehabilitation games regained wider ranges of motion and reported higher adherence than peers on standard exercise sheets. Tele-rehab extensions now stream clinician dashboards that score movement accuracy in real time, letting therapists adjust routines remotely. APAC health ministries back these programs to stretch limited specialist staff across rural populations. As 5G networks mature, cross-border services will widen, positioning patient-facing AR as the next high-volume contributor to the augmented reality in healthcare market.
Restraints Impact Analysis*
| Restraints Impact Analysis | (~) % Impact on CAGR Forecast | Geographic Relevance | Impact Timeline |
|---|---|---|---|
| High initial cost of augmented-reality hardware & integration | -3.8% | Global, most acute for smaller facilities | Short term (≤2 years) |
| Data privacy & cybersecurity concerns in clinical environments | -2.9% | Global, strictest in EU | Medium term (2-4 years) |
| Lack of standardized regulatory & reimbursement frameworks | -3.2% | Global, with pronounced impact in emerging markets | Medium term (2-4 years) |
| Limited clinical evidence and validation of long-term outcomes | -2.5% | Global, hospitals with evidence-based purchasing policies | Long term (≥4 years) |
| Source: Mordor Intelligence | |||
High Initial Cost of AR Hardware and Integration
Entry-level smart glasses start near USD 5 000, yet the fully loaded cost of an enterprise surgical suite surpasses USD 250 000 once software licenses, training, and IT build-outs are counted. Smaller regional hospitals hesitate because reimbursement codes for AR-assisted procedures are still limited, forcing them to shoulder capital expenses upfront. Custom links to PACS, EMR, and navigation stacks add further expense when vendors lack common interoperability standards. Early adopters counter these concerns with operating-lease models and evidence that procedure times can drop enough to free operating room capacity. Even so, near-term growth is capped where funding is tight or where CFOs demand three-year payback horizons.
Data Privacy and Cybersecurity Concerns in Clinical Environments
Immersive overlays pull live imaging, EMR data, and biometric signals into one viewport, expanding the attack surface that hackers could exploit. Regulators now treat headset firmware and cloud renderers as covered components under HIPAA and GDPR, raising compliance workloads. Researchers demonstrated that adversarial pixels can inject false vessel contours, proving that patient safety risks extend beyond data theft[3]IEEE Spectrum Staff, “Hacking the Operating Room Headset,” spectrum.ieee.org. Hospitals therefore impose encrypted transport layers and multi-factor authentication, steps that can introduce latency unless systems are optimized. Vendor risk-assessment questionnaires have doubled in length since 2023, delaying procurement cycles in Europe and parts of Asia.
*Our forecasts treat driver/restraint impacts as directional, not additive. The impact forecasts reflect baseline growth, mix effects, and variable interactions.
Segment Analysis
By Component: Services Drive Long-Term Value Creation
In 2025 hardware composed 54.72% of Augmented Reality in Healthcare market revenue, reflecting the up-front purchase of optical engines, sensors, and compute packs. The Augmented Reality in Healthcare market size for services is, however, expanding fastest at 27.90% CAGR through 2031 as hospitals demand turnkey workflow mapping, staff certification, and cybersecurity support alongside devices. Vendor contracts are moving to recurring subscription bundles, giving suppliers year-over-year revenue visibility while easing capital budgeting hurdles for providers. Hardware margins, in contrast, are slipping when generic waveguides and commodity processors lower differentiation; firms that pivot to managed services preserve profitability. Over the forecast period, custom analytics dashboards, remote calibration, and guaranteed uptime clauses will become standard, aligning AR procurement with broader digital-health sourcing models. This transition mirrors the path already traveled by radiology PACS and surgical robotics, where service revenue now exceeds hardware sales. Manufacturers who excel at clinical onboarding and cross-platform integration will secure higher renewal rates, cementing services as the primary engine of lifetime customer value.
Second-generation deployments demonstrate that robust services shorten learning curves and boost utilization. Hospitals that buy devices without structured support often stall below 40% usage after six months, while sites on full-service plans exceed 75% utilization within the first year. These metrics help CFOs justify subscription spending, creating a self-reinforcing cycle that channels budget growth toward service line items. As a result, investors increasingly assess competitive positioning by the scale of field-support teams and the depth of implementation playbooks rather than optical specifications alone. Services thus shift bargaining power away from component suppliers toward integrators that own the clinical relationship, reshaping competitive hierarchy across the Augmented Reality in Healthcare market.


By Technology: Head-Mounted Displays Gain Surgical Adoption
Handheld tablets and phones delivered 38.12% of 2025 revenue because their familiar form factor lowered entry barriers for patient-education kiosks and bedside use. Head-mounted displays now post a 28.12% CAGR as operating-room teams value hands-free navigation and 3-D depth cues critical for intricate procedures. Apple Vision Pro’s first documented shoulder-replacement case showed surgeons completing tasks 19% faster than those using 2-D screens, proving clinical viability. Lightweight optics and battery sleeves have trimmed headset weight below 220 grams, mitigating neck fatigue that previously hampered adoption. Future releases add myoelectric gesture sensors, enabling sterile interaction without voice commands that struggle in noisy theatres. Over the forecast window, hybrid architectures will appear: surgeons will reference patient-specific holograms through headsets while circulating nurses trigger medication reminders on handheld consoles. Vendors that synchronize annotations across both device classes stand to capture multi-department budgets and lock in cloud-rendering subscriptions.
Commercial momentum also reflects progress in regulatory pathways. The FDA’s 510(k) panel cleared 16 head-mounted systems in 2024 alone, prompting group-purchasing organizations to negotiate framework agreements that pool demand across member hospitals. Such deals remove administrative friction, accelerating volume ramps. Long term, extended-reality chipsets built on 3-nanometer nodes will unlock 4K-per-eye resolution, positioning headsets to anchor even pathology and catheterization lab workflows. Consequently, research labs investing in next-generation optics are laying the foundation for a technology mix that tilts definitively toward head-mounted modalities by decade’s end.
By Product: AR Displays Lead Both Share and Growth
AR displays generated 35.02% of 2025 revenue and are growing at 27.86% CAGR, an uncommon dual leadership that underscores their centrality to every workflow. The Augmented Reality in Healthcare market share advantage arises because crisp, wide-field visuals directly influence surgeon confidence and patient comprehension. SCHOTT’s high-index glass wafers now allow mass-production of waveguides that boost brightness 40% without enlarging optics. On the backplane, micro-OLED arrays deliver 3,000 nits, ensuring anatomical overlays remain visible under surgical lights. Sensors and input devices follow as enabling categories, supplying spatial mapping and gesture capture, yet their revenue ranks lower because many units are embedded inside the display chassis. Semiconductor components, critical though they are, behave like commodities once vendors lock design wins, so their pricing trends downward even as unit volume climbs.
The dominance of displays feeds a growing aftermarket for optical calibration and sterilisable lens covers, both bundling into service contracts that raise lifetime account value. Hospitals experimenting with remote tele-mentoring found that display clarity, not bandwidth, dictated mentor satisfaction scores, reinforcing the thesis that visualization performance governs clinical acceptance. Early indications show that AI up-scalers integrated at the edge can refine model overlays in real time, hinting that future differentiation will blend optical hardware with on-device intelligence. For now, firms that control proprietary coating recipes and etalon stacks set the performance ceiling and thus capture premium margins inside the Augmented Reality in Healthcare market.
By Application: Surgical Planning Dominates Across Metrics
Surgical planning & guidance absorbed 41.86% of 2025 revenue and advances at 28.35% CAGR, cementing its status as the anchor segment of the Augmented Reality in Healthcare market size. Clinicians appreciate the quantifiable outcome gains: shorter incision lengths, reduced fluoroscopy exposure, and fewer readmissions. FDA clearances for Augmedics xvision and ImmersiveTouch give hospitals regulatory confidence to scale beyond pilot phases. Growth continues as spine and craniomaxillofacial workflows expand into orthopedics and structural heart, areas demanding high-fidelity overlay registration. Training and education rank second; however, they overlap heavily with surgical modules, indicating that many vendors repurpose anatomical models across both revenue streams. Rehabilitation and remote monitoring form the youngest sub-cluster, leveraging inertial sensors and cloud analytics to gamify patient exercise and supply insurers with adherence metrics.
Product-market fit in surgery sparks ecosystem effects: implant makers pre-load AR visualization files onto sterilised drives, while imaging vendors embed spatial registration tags into CT datasets. These linkages lock surgeons into vertically integrated toolchains that elevate switching costs. At the same time, machine-learning libraries transform intra-operative video into continuous quality-assurance datasets, which hospitals mine for performance improvement programs. The upshot is that surgical planning not only fuels device sales but also catalyzes service, software, and data-analytics revenue, making it the flywheel around which the broader Augmented Reality in Healthcare market revolves.
By End User: Research Labs Accelerate Translational Adoption
Hospitals & clinics generated 51.20% of 2025 turnover, reflecting their purchasing power and central role in acute care. The Augmented Reality in Healthcare market size contribution from research laboratories, however, is racing ahead at 28.80% CAGR because grant-funded institutes pilot experimental features and publish peer-reviewed evidence. Their validations persuade hospital boards to issue broader requests for proposals, creating a pipeline effect that seeds future clinical revenue. Academic centers sit in between, training residents on AR platforms they will later demand as attending surgeons. Pharmaceutical firms and device makers deploy AR during R&D to visualise molecular structures or simulate implant placement, representing a smaller but strategically important niche.
Research labs also shape standards. Consortia led by Cleveland Clinic and University College London are drafting open data formats that enable headset-agnostic overlays, lowering integration burdens for hospitals downstream. Vendor partnerships with these labs therefore pay dual dividends: early performance feedback plus influence over emerging interoperability norms. As a result, firms courting laboratory relationships may capture a disproportionate share of long-run clinical spend, reinforcing the labs’ pivotal role in the Augmented Reality in Healthcare market.
Geography Analysis
North America retained 42.60% revenue in 2025, reflecting premium pricing power and a regulatory environment that has cleared 69 augmented-reality or virtual-reality devices to date. The United States dominates regional uptake as integrated-delivery networks bundle AR into digital theatre rebuilds, while Canada’s publicly funded system channels grants toward rural tele-rehab pilots. Mexico shows budding demand tied to its medical-tourism corridor, where private hospitals promote AR-guided orthopedic packages for inbound patients. Cross-border collaborations allow U.S. academic surgeons to mentor Mexican procedures in real time, foreshadowing hemispheric service lines that could unlock fresh device shipments.
Asia-Pacific posts the highest 27.10% CAGR, giving it outsize influence on future Augmented Reality in Healthcare market growth. China funds provincial-level procurement of AR simulators for resident training, targeting doubled specialist numbers by 2030. India couples tele-mentoring headsets with government insurance that reimburses minimally invasive procedures, narrowing urban–rural outcome disparities. Japan pushes precision applications that converge with its robotics industry, while South Korea layers 5G slicing onto surgical feeds to prove remote cadaver dissections across islands. Australia’s CSIRO anchors multi-center trials focusing on indigenous health, ensuring regional data diversity that shapes global algorithms. Collectively, Asia-Pacific buyers prize scalable, cost-efficient bundles, steering suppliers toward modular designs and aggressive price-performance road maps.
Europe delivers steady though slower expansion as health ministries require rigorous cost–benefit dossiers before acquisition. Germany leverages its optics supply chain to localise headset production, which satisfies EU sovereignty goals and trims import dependencies. The United Kingdom embeds AR evaluations inside NHS Clinical Entrepreneur programs that favor population-wide impact over boutique innovations. France and Italy host academic hubs where choreographed multi-discipline teams validate AR across cardiology, oncology, and orthopedics, driving ecosystem breadth. Middle East & Africa and South America remain nascent; Gulf hospitals import turnkey suites for medical-tourism clusters, while Brazil’s research institutes explore public-sector tele-rehab to extend reach into the Amazon basin. Infrastructure gaps limit scale today, yet fast mobile-broadband rollouts position these regions for late-decade acceleration.

Competitive Landscape
The augmented reality in healthcare market supports a moderately fragmented field where top players own complementary but not dominant positions. Microsoft capitalizes on its HoloLens platform and Azure compliance blocks to offer full-stack delivery that integrates with major EMR vendors, giving it an enterprise edge for health-system-wide deployments. Siemens Healthineers and Philips embed AR into imaging suites, bundling head-mounted navigation with intra-operative CT, thereby tapping existing radiology budgets. Augmedics, Surgical Theater, and ImmersiveTouch specialize in high-acuity surgical niches, using proprietary registration algorithms to maintain clinical differentiation despite smaller resource pools. Brainlab pursues a software-first strategy: its Elements suite feeds AI-derived segmentations into multi-modal headsets, and the company aims to accelerate this approach via a planned IPO that would fund deeper AI-AR convergence.
Competitive intensity is shifting from optics to workflow. Hardware component costs are falling 12% annually, turning advanced waveguides into commodities. Consequently, firms now race to lock hospitals into cloud dashboards that score procedures, populate audit logs, and forecast implant sizes. Those analytics loops create data moats that dissuade platform switching, echoing electronic-health-record battles a decade earlier. M&A is therefore tilting toward software talent and regulatory dossiers rather than lens patents. Another vector is cybersecurity maturity: vendors able to certify end-to-end encryption and zero-trust architectures win multi-hospital contracts in Europe where GDPR penalties loom large. Finally, partnerships between AR specialists and robotics companies point to integrated digital-surgery suites that could consolidate procurement under fewer suppliers by 2030.
Investors monitor three leading indicators: renewal rates for software subscriptions, the depth of referenceable peer-review studies, and the number of multi-specialty workflows supported within a single interface. Companies scoring high on all three metrics raise barriers even against well-funded new entrants. Meanwhile, open-source initiatives backed by academic consortia threaten to commoditize baseline visualization engines, pressuring incumbents to deliver premium functionality such as AI-generated safety alerts. The competitive balance remains fluid, but the trajectory favors firms that embed deeply into clinical operations rather than those banking solely on optical breakthroughs.
Augmented Reality (AR) In Healthcare Industry Leaders
Siemens Healthineers
Koninklijke Philips N.V.
AccuVein Inc.
Vuzix Corporation
Augmented Pixels Inc
- *Disclaimer: Major Players sorted in no particular order

Recent Industry Developments
- June 2025: Brainlab filed for an IPO on the Frankfurt Stock Exchange to scale its software-centric AR surgery platform.
- April 2025: Nanox gained FDA clearance for the Nanox.ARC X digital tomosynthesis scanner that enhances 3-D visualization of the musculoskeletal system.
- March 2025: Endo debuted a spatial-computing injection simulator that runs on Apple Vision Pro for hands-on clinician training.
- February 2025: XRHealth announced a multi-acquisition program to create the world’s largest XR healthcare platform focused on chronic-care management.
- February 2025: EssilorLuxottica secured FDA clearance for Nuance Audio Glasses, the first SaMD smart spectacles to double as hearing aids.


Global Augmented Reality (AR) In Healthcare Market Report Scope
As per the scope of this report, Augmented Reality in Healthcare is an enhancement of the real-world environment by the use of screens, cameras, and sensors. It projects digital information onto the current surroundings to create a representation of the real world. Augmented Reality in Healthcare Market is segmented by Technology (Head Mounted Devices, Handheld Devices), By Product (AR Displays, AR Sensors, AR Input Devices, AR Semiconductor Components, Others), End User (Hospitals and Clinics, Research Laboratories, Others) and Geography (North America, Europe, Asia-Pacific, Middle-East and Africa, and South America). The market report also covers the estimated market sizes and trends for 17 different countries across major regions, globally. The report offers the value (in USD million) for the above segments.
| Hardware |
| Software |
| Services |
| Head-Mounted Devices |
| Handheld Devices |
| AR Displays |
| AR Sensors |
| AR Input Devices |
| AR Semiconductor Components |
| Other Products |
| Surgical Planning & Guidance |
| Medical Training & Education |
| Patient Monitoring & Rehabilitation |
| Other Applications |
| Hospitals & Clinics |
| Research Laboratories |
| Academic & Training Institutes |
| Other End Users |
| North America | United States |
| Canada | |
| Mexico | |
| Europe | Germany |
| United Kingdom | |
| France | |
| Italy | |
| Spain | |
| Rest of Europe | |
| Asia-Pacific | China |
| Japan | |
| India | |
| Australia | |
| South Korea | |
| Rest of Asia-Pacific | |
| Middle East & Africa | GCC |
| South Africa | |
| Rest of Middle East & Africa | |
| South America | Brazil |
| Argentina | |
| Rest of South America |
| By Component | Hardware | |
| Software | ||
| Services | ||
| By Technology | Head-Mounted Devices | |
| Handheld Devices | ||
| By Product | AR Displays | |
| AR Sensors | ||
| AR Input Devices | ||
| AR Semiconductor Components | ||
| Other Products | ||
| By Application | Surgical Planning & Guidance | |
| Medical Training & Education | ||
| Patient Monitoring & Rehabilitation | ||
| Other Applications | ||
| By End User | Hospitals & Clinics | |
| Research Laboratories | ||
| Academic & Training Institutes | ||
| Other End Users | ||
| Geography | North America | United States |
| Canada | ||
| Mexico | ||
| Europe | Germany | |
| United Kingdom | ||
| France | ||
| Italy | ||
| Spain | ||
| Rest of Europe | ||
| Asia-Pacific | China | |
| Japan | ||
| India | ||
| Australia | ||
| South Korea | ||
| Rest of Asia-Pacific | ||
| Middle East & Africa | GCC | |
| South Africa | ||
| Rest of Middle East & Africa | ||
| South America | Brazil | |
| Argentina | ||
| Rest of South America | ||


Key Questions Answered in the Report
What is the current value of the Augmented Reality in Healthcare market?
The market stands at USD 1.91 billion in 2026 and is on track to reach USD 6.13 billion by 2031.
Which segment grows fastest through 2031?
Services record the highest 27.90% CAGR because hospitals increasingly seek turnkey implementation contracts.
How large is surgical planning within the overall opportunity?
Surgical planning & guidance holds 41.86% of 2025 revenue and is expanding at 28.35% CAGR, making it the anchor application.
Which region delivers the strongest growth?
Asia-Pacific advances at 27.10% CAGR as large-scale public programs fund physician-training and remote-care deployments.
What are the main barriers to adoption?
High up-front acquisition costs and heightened cybersecurity requirements slow near-term uptake, especially among smaller facilities.
Who are key players shaping competitive dynamics?
Microsoft, Siemens Healthineers, Philips, Augmedics, Brainlab, and Surgical Theater lead through platform scale, regulatory clearances, and specialized surgical workflows.
Page last updated on:


